Jim Cramer Says Comparing the Mag 7 Is a Mistake: Here Are 5 Reasons Each Stock Is Different
Jim Cramer owns six of the Magnificent Seven and argues that grouping them together is one of the costliest mistakes an investor can make. The five dimensions separating these stocks reveal why selling them as a basket when one stumbles…

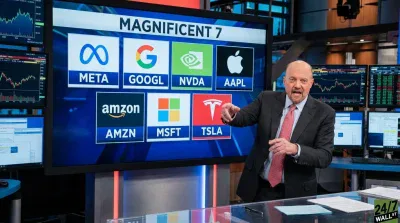
On an early July episode of Mad Money, Jim Cramer walked through the Magnificent Seven one stock at a time and pushed back on treating them as a single basket. Cramer’s charitable trust owns six of the seven, save Tesla, and the point was that each name has its own thesis, growth curve, and risks. Investors who dump the whole group when one stumbles leave money on the table.
The day’s price action helped make the case. Meta Platforms (NASDAQ:META | META Price Prediction) closed up 5.97% at $669.21 on July 10, while the broader S&P 500 gained just 0.43%. That is one name responding to its own capital spending story while the rest trade on their own catalysts.
Five Dimensions That Separate the Seven
The framework: distinct business models, different growth curves, wildly different margin profiles, valuation gaps, and separate AI angles. Cramer’s breakdown is an argument for those five axes.
Meta: A Data Moat Funding a Superintelligence Bet
Meta is an ad machine financing an AI moonshot. Q1 revenue hit $56.31 billion, up 33.08% year over year, with EPS of $10.44, helped by a tax benefit but still far above consensus. Management then raised 2026 capex guidance to $125 billion to $145 billion, per the Q1 8-K filing. That capex line is why the stock swings on infrastructure headlines, and why Meta’s 3.56 billion daily users give the spending story a scale few companies can match.
Alphabet: Search, Cloud, and a Gemini Distribution Story
Alphabet (NASDAQ:GOOGL) posted $109.90 billion in Q1 revenue, up 21.8%, with Google Cloud growing 63% to $20.03 billion and backlog above $460 billion. Polymarket assigns a 92% probability that Alphabet beats its next quarterly report. The stock is up 14.26% year to date and 101.67% over one year. Gemini’s deeper integration across Android, Workspace, Cloud, and partner devices gives Alphabet a different AI path from Meta’s ad-first model.
NVIDIA: The Supplier Everyone Else Pays
NVIDIA (NASDAQ:NVDA) sits at the center of nearly every major hyperscaler’s capex line. Q1 fiscal 2027 revenue hit $81.6 billion, up 85%, with Data Center revenue reaching $75.2 billion and Data Center networking growing 199%. The non-GAAP gross margin held at 75.0%. Jensen Huang called the AI factory buildout “the largest infrastructure expansion in human history,” and NVIDIA remains the company most directly monetizing that expansion. A trailing P/E near 32 reads modestly against 85% revenue growth.
Apple: Hardware Cycle Plus Services Annuity
Apple (NASDAQ:AAPL) reported a record March quarter of $111.18 billion, up 16.6%, with iPhone sales at $56.99 billion and Services at an all-time high of $30.98 billion. The board added another $100 billion buyback, highlighting the company’s cash-generation power. A trailing P/E near 38 says the market is still paying for Apple’s installed base, Services engine, and capital-return machine, not a pure AI infrastructure story.
Amazon: Retail Cash Flow, AWS Growth, Custom Silicon
Amazon (NASDAQ:AMZN) posted $181.52 billion in Q1 revenue, up 17%, with EPS of $2.78, boosted by Anthropic-related investment gains but still ahead of consensus. AWS grew 28% to $37.59 billion, with operating margin reaching 37.7%. CEO Andy Jassy said Amazon’s chips business, including Graviton, Trainium, and Nitro, has topped a $20 billion annual revenue run rate. Prediction markets peg 98.5% odds that 2026 capex clears $170 billion.
Microsoft: Enterprise Copilot and an Azure Backlog
Microsoft (NASDAQ:MSFT) delivered $82.89 billion in Q3 revenue with Azure and other cloud-services revenue up 40% and the AI business at a $37 billion annual run rate, up 123%. Yet the stock is down 20.3% year to date, the outlier in the group and a live example of Cramer’s point that these names decouple.
Tesla: The One Cramer Sets Aside
Tesla (NASDAQ:TSLA) is the deliberate exclusion. Trailing P/E of 371, a 3.95% profit margin, and a 9.33% year-to-date decline describe a business that trades on robotaxi and Optimus optionality, a distinct thesis from the ad and cloud cash flows that anchor the other six.
The takeaway: companies growing anywhere from about 15% to 85%, carrying profit margins from 4% to 66%, and trading at trailing P/E multiples from 24 to 371 do not belong in one bucket. The Mag 7 label is useful shorthand, but it can blur the very differences that matter most. Investors who evaluate each thesis on its own have a better chance of holding the winners when one of the seven stumbles.
Contact [email protected] for any questions or corrections.
Gerelyn Terzo is the author of dividend investing handbook "Dividend Investing Strategies: How to Have Your Cake & Eat It Too." A veteran financial journalist, she covers agri-finance for outlets like Global AgInvesting and the broader stock market and personal finance for 24/7 Wall Street. She began at CNBC and later helped launch Fox Business in New York. Gerelyn currently resides in Woodland Park, Colorado and dabbles in nature photography as a hobby.