Here’s the Smartest S&P 500 ETF to Buy Before July Ends
Market concentration has turned most S&P 500 index funds into a quiet bet on a handful of AI mega-caps, and one overlooked ETF is already outperforming in 2026 for a structural reason most investors ignore.


Market concentration has become the defining risk of large-cap investing in 2026. The top 10 names in the S&P 500 still drive an outsized share of returns, and any investor putting $1,000 to work in a cap-weighted index fund is effectively making an overweight bet on a handful of AI-linked mega-caps.
For readers who want broad U.S. equity exposure without that lopsided tilt, the Invesco S&P 500 Equal Weight ETF (NYSEARCA:RSP) offers a more diversified structure for investors weighing where to allocate fresh cash this July.
The setup matters. The 10-year Treasury yield sits at 4.58% as of July 20, in the 93.2nd percentile of the past 12 months. Elevated rates raise the cost of capital for long-duration growth names, which is precisely where cap-weighted S&P 500 funds carry their heaviest exposure. Equal-weight construction leans the other way, toward financials, industrials, and value-oriented cyclicals that tend to hold up better in a higher-for-longer rate regime.
Why RSP Fits the Moment
RSP tracks the S&P 500 Equal Weight Index, which gives every constituent roughly the same starting weight and rebalances quarterly. The fund’s most recent NPORT filing showed $87.86 billion in net assets as of April 30, 2026, with 508 positions. That’s real institutional scale. Stanley Druckenmiller’s Duquesne Family Office made it a top position last year, acquiring over 1.1 million shares of RSP and making it his fourth-largest holding while trimming Meta, Tesla, and Nvidia.
The holdings snapshot tells the story. RSP’s positions include names like Texas Instruments, Capital One Financial, Micron Technology, AvalonBay Communities, Air Products and Chemicals, and Robinhood Markets, each sitting in the roughly 0.16% to 0.27% range of net assets. Compare that to a cap-weighted S&P 500 fund, where a single name can command a weighting many multiples larger, and the diversification benefit becomes obvious.
The Performance Case Right Now
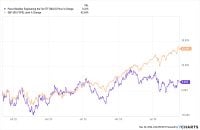
RSP has begun to close its longstanding gap versus the cap-weighted index. Year to date through midday trading on July 20, RSP has returned 10.52%, edging out Vanguard S&P 500 ETF (NYSEARCA:VOO), which has returned 8.98% over the same window. Over the past month, RSP is up 3.54% versus VOO’s loss of 0.2%, evidence that market breadth is expanding beyond the very top names.
That mirrors what David Beren noted earlier this year on 24/7 Wall St.: “In early 2026, the Invesco S&P 500 Equal Weight ETF (RSP) outperformed the Vanguard S&P 500 ETF (VOO), reversing a trend where VOO had dominated due to its concentration in mega-cap tech.” Morningstar’s 2026 outlook flagged the same structural issue, noting that the top 10 US stocks now account for over one-third of the market, up from 18% a decade ago, and recommending investors consider diversifying into value and small-cap exposure to reduce that risk.
RSP’s rebalancing mechanics create another quiet advantage. As Motley Fool contributors have observed, equal-weight ETFs could outperform under different market conditions where stock performance is more rotational, as their rebalancing strategy sells high and buys low. That built-in discipline is exactly what most investors fail to execute on their own.
What $1,000 Buys You
At a current price of $213.15, a $1,000 allocation gets you more than four shares of RSP (4.6915 to be precise), spread across all 500 S&P constituents rather than concentrated in the top handful. The fund also pays a quarterly distribution, most recently 81 cents per share declared June 26. Over the past year, RSP has returned 16.3%, and over the past decade it has delivered more than 156%, not including reinvested dividends.
The Risk You’re Accepting
RSP carries a stated expense ratio of 0.2%, materially higher than VOO’s 0.03% gross expense ratio per Vanguard’s most recent fact sheet. That fee difference matters over long holding periods, and it’s the price you pay for the equal-weight methodology and its associated turnover. RSP will also lag when mega-cap leadership resumes.
JP Morgan’s 2026 outlook also flagged the persistence of that dynamic, noting that 2026 Mag 7 earnings estimates have been revised up by 3.4% vs. -1.2% for the S&P 493 since the start of the year. If AI capex continues to drive disproportionate earnings growth at the top of the index, cap-weighted funds will keep their edge.
What to watch next: market breadth indicators, the July earnings cycle from mid-cap S&P components, and whether the 10-year yield holds above the 4.4% level. If breadth stays healthy and rates stay firm, RSP’s structural setup should keep working. For investors uncomfortable letting seven stocks decide the fate of their “index” portfolio, equal-weight construction offers a structurally different exposure worth considering in July.
Contact [email protected] for any questions or corrections.
Joel South covers large-cap stocks, dividend investing, and major market trends, with a focus on earnings analysis, valuation, and turning complex data into actionable insights for investors.
He brings more than 15 years of experience as an investor and financial journalist, including 12 years at The Motley Fool, where he served as an investment analyst, Bureau Chief, and later led the Fool.com investing news desk. He has also co-hosted an investing podcast and appeared across TV and radio discussing market trends.