KBWD’s 14.4% Yield Masks a Troubling Reality for Income Investors
KBWD's double-digit yield draws income investors in, but the monthly checks come with a hidden cost that quietly chips away at the capital funding them.


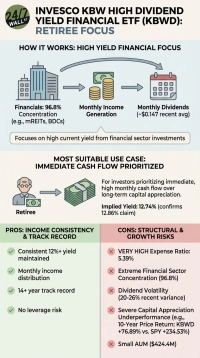
The Invesco KBW High Dividend Yield Financial ETF (NASDAQ:KBWD) is a go-to income vehicle for investors willing to trade diversification for yield in the financial sector. KBWD pays monthly distributions and screens with a trailing yield well into double digits, with one recent snapshot pegging the payout at 14.4% against an annual dividend of roughly $1.75. The key question for anyone holding KBWD for income is whether that stream is durable or whether distributions are quietly funded by capital rather than earnings.
How KBWD Generates Its Income
The income is a pass-through of what those underlying holdings distribute. If mortgage REIT book values compress or BDC net investment income slips, KBWD’s payout follows.
Mortgage REIT concentration defines the fund. The largest positions include Invesco Mortgage Capital at 4%, Orchid Island Capital at 4%, ARMOUR Residential REIT at 4%, and Dynex Capital at 4%. These agency-focused mREITs borrow short and invest in longer-duration mortgage-backed securities, so earnings power depends heavily on the yield curve shape.
What the Rate Environment Is Doing to the Payout
The macro backdrop is mixed. The Fed funds target upper bound sits at 3.75%, down 0.75 percentage points from a year ago, lowering financing costs for BDCs and mREITs.
The 10-year Treasury yield is roughly 4.5%, and the 10-year minus 2-year spread has recovered to roughly 40 basis points from a June low of 27 basis points. A steeper curve helps bank net interest margins and widens the spread mREITs earn on new investments. Consumer credit cooperates: card delinquencies are 3%, inside the normalizing band.
Even with those tailwinds, the distribution is drifting lower. KBWD paid $0.15 in January 2026 and $0.14 for the July 20 ex-date. The forward annualized rate of $1.62 sits below the trailing twelve-month total of $1.74, meaning holders receive less cash each month than they did in early 2026.
Payout Ratio and Total Return
The clearest warning sign is a payout ratio of 139%, meaning the fund distributes more than its underlying earnings support. Part of that gap is a return of capital rather than income, which is why 24/7 Wall St. analysis from June 2026 concluded the yield is “partly a return-of-capital experience rather than pure wealth creation.”
That framing matches the price record. Shares are $12.09, down 3.5% year to date and 0.75% over the past year, with a five-year total price change of just 6%.
Cost is the other drag. The expense ratio has been reported at 5%, which includes acquired fund fees from the underlying BDCs. Lower-fee financial sector ETFs such as VFH and XLF offer broader exposure at a fraction of the cost, and dividend-growth alternatives like SCHD have delivered better total returns with less principal erosion.
Verdict on the Distribution
Contact [email protected] for any questions or corrections.
David Beren has been a Flywheel Publishing contributor since 2022. Writing for 24/7 Wall St. since 2023, David loves to write about topics of all shapes and sizes. As a technology expert, David focuses heavily on consumer electronics brands, automobiles, and general technology. He has previously written for LifeWire, formerly About.com. As a part-time freelance writer, David’s “day job” has been working on and leading social media for multiple Fortune 100 brands. David loves the flexibility of this field and its ability to reach customers exactly where they like to spend their time. Additionally, David previously published his own blog, TmoNews.com, which reached 3 million readers in its first year. In addition to freelance and social media work, David loves to spend time with his family and children and relive the glory days of video game consoles by playing any retro game console he can get his hands on.