Scott Bessent Has a $40 Trillion Problem as Interest Rates Are Closing in on a Multi-Decade High
Treasury yields are surging toward levels not seen since before the 2007 financial crisis, and Scott Bessent now faces the most punishing debt rollover environment in a generation with trillions in low-rate bonds coming due.


The 10-year Treasury yield climbed to 4.705% on Thursday morning, its highest level since January 15, 2025, when it briefly touched 4.79%. Outside that spike, the last comparable readings date to the period before the 2007 financial crisis to find a comparable level. The 30-year sits at 5.182%, the 2-year at 4.343%. Two catalysts drove the move: Brent crude topped $100 a barrel, reviving inflation anxiety, and weekly jobless claims fell to 187,000, well below the roughly 212,000 economists expected. About half of Federal Reserve officials now pencil in a rate hike this year. For Treasury Secretary Scott Bessent, that combination is the worst possible backdrop for the job in front of him.
The Refinancing Treadmill
Total federal debt stood at $39.065 trillion as of January 1, 2026, according to the Federal Reserve’s GFDEBTN series, and is on pace to cross $50 trillion before 2030. The stock has grown by roughly $16 trillion since 2020. The bigger issue is the vintage of that debt. A large share of that debt was issued when the 10-year yielded under 2%. As that paper matures, Bessent has to reissue it into a market where the 10-year yields 4.67% and the 30-year yields 5.15%. Every rollover raises the ongoing carrying cost of the national debt.
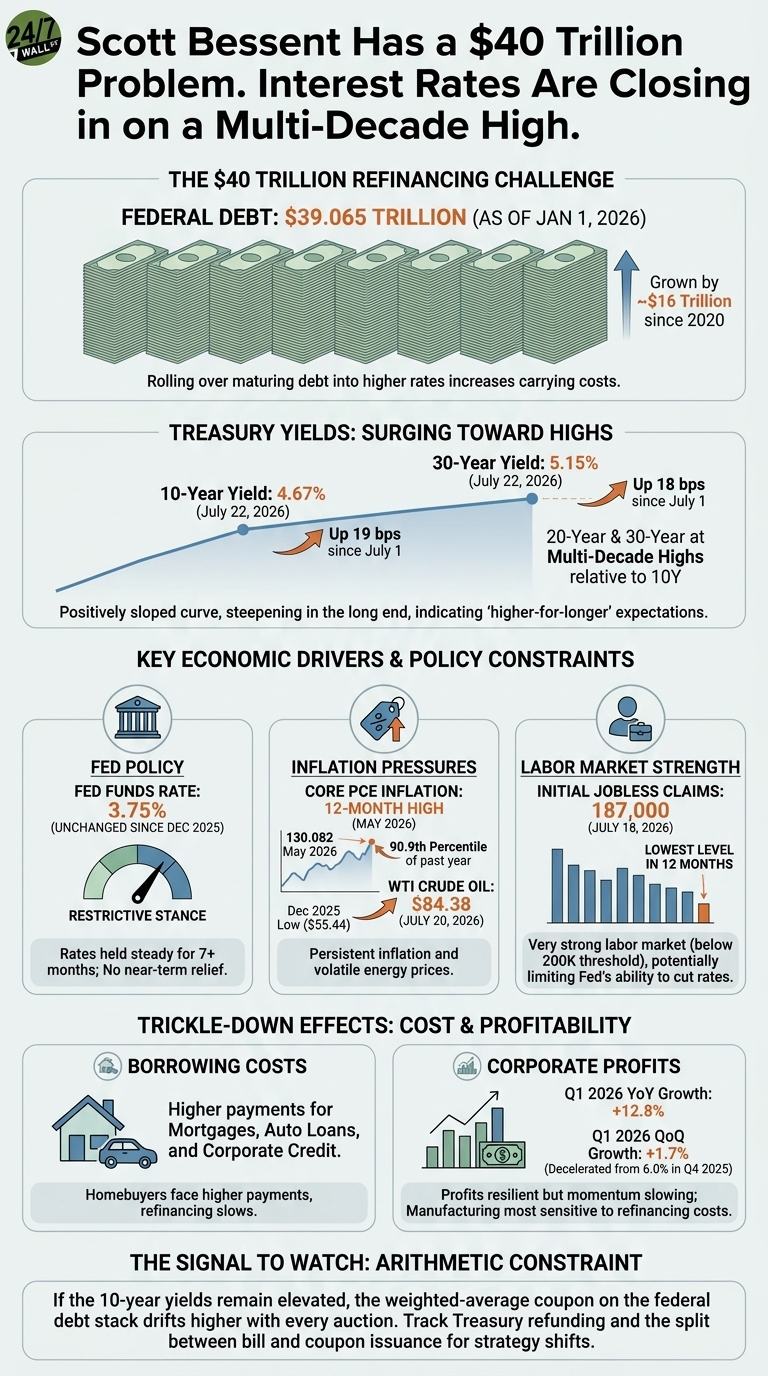
The Fed offers no near-term relief. The federal funds target upper bound has sat at 3.75% since December 10, 2025, unchanged for more than seven months. Core PCE, the Fed’s preferred inflation gauge, printed at a 12-month high in May 2026, sitting in the 90.9th percentile of the past year’s readings. WTI crude, meanwhile, has climbed from a December low of $55.44 to $84.38 on July 20, and Brent has cleared triple digits. Real yields tell the same story stripped of inflation expectations: the 30-year TIPS yield is 2.93%, up from 2.78% on July 1. Investors are demanding a genuinely higher real return to hold long-duration government paper.
Bond markets have repriced accordingly. The 10-year has climbed 19 basis points since July 1; the 30-year, 18 basis points. The curve is not inverted anywhere along the maturity spectrum. That points to a market pricing higher-for-longer.
What Trickles Down
The 10-year is the benchmark that prices 30-year mortgages, auto loans, and much of the credit spread stack for corporate and consumer credit. When it rises 30 basis points in a month, homebuyers face higher payments, refinancing activity slows, and marginal capex decisions are deferred. Corporate profits so far have absorbed the pressure. Total corporate profits grew 12.8% year over year in the first quarter of 2026, with financial sector profits up 16.1% on wider net interest margins. But quarter-over-quarter growth decelerated to 1.7% from 6.0% in the prior quarter, hinting that cumulative rate pressure is starting to bite.
The Signal to Watch
Bessent’s constraint is arithmetic. If the 10-year settles above the January 2025 peak of 4.79% and holds, the weighted-average coupon on the federal debt stack drifts higher with every auction. The signals worth tracking over the next two quarters are the Treasury’s refunding announcements, the split between bill and coupon issuance (a heavier bill mix would signal Bessent is trying to duck the long end), and whether the September Fed dot plot confirms the emerging hike faction. If oil holds above $100 and claims stay below 200,000, the pressure on Bessent, and on every household refinancing a mortgage, does not ease.
Contact [email protected] for any questions or corrections.
David Beren has been a Flywheel Publishing contributor since 2022. Writing for 24/7 Wall St. since 2023, David loves to write about topics of all shapes and sizes. As a technology expert, David focuses heavily on consumer electronics brands, automobiles, and general technology. He has previously written for LifeWire, formerly About.com. As a part-time freelance writer, David’s “day job” has been working on and leading social media for multiple Fortune 100 brands. David loves the flexibility of this field and its ability to reach customers exactly where they like to spend their time. Additionally, David previously published his own blog, TmoNews.com, which reached 3 million readers in its first year. In addition to freelance and social media work, David loves to spend time with his family and children and relive the glory days of video game consoles by playing any retro game console he can get his hands on.