Forget EEM. iShares Sells Nearly the Same Emerging Markets for 87% Less
BlackRock quietly launched a second emerging markets ETF that costs almost nothing compared to its famous sibling, and the long-term performance numbers reveal just how expensive investor loyalty to the original has become.


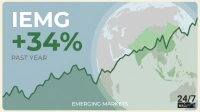
The iShares MSCI Emerging Markets ETF (NYSEARCA:EEM) is the ticker most U.S. investors still reach for when they want emerging markets exposure. Launched in 2003, EEM tracks the MSCI Emerging Markets Index and remains one of the most heavily traded international ETFs in the world, with deep options markets and tight spreads that institutional traders rely on. The problem is that EEM is charging long-term holders a legacy fee that its own issuer, BlackRock (NYSE:BLK | BLK Price Prediction), has quietly obsoleted with a nearly identical fund. That successor, the iShares Core MSCI Emerging Markets ETF (NYSEARCA:IEMG), costs a fraction as much and has drawn the assets to prove it.
Why Investors Still Hold EEM
The Fee Problem
On a $100,000 position, the annual fee drag on EEM works out to $690 versus $90 in IEMG, a $600 yearly difference before compounding. Held for a decade at flat markets, that gap alone approaches $6,000. In a rising market, the drag grows because the fee applies to a larger base each year.
Where IEMG Actually Wins
The cost story is the headline, but IEMG also tracks a broader benchmark. It follows the MSCI Emerging Markets Investable Market Index (IMI), which includes small-cap constituents that EEM’s standard index excludes. The core holdings look almost identical: IEMG’s top position is also Taiwan Semiconductor at 11.49%, followed by Samsung at 4.39% and Tencent at 3.34%. The lower concentration reflects the wider small-cap tail, not a different country mix.
Returns have followed the fee math. Over the trailing five years, IEMG has returned 42.30% versus 39.28% for EEM, and 137.34% versus 125.08% over ten years. Distributions have followed the same pattern: IEMG paid $0.658439 per share on its June 2026 ex-date, compared with $0.350802 for EEM. Adjusted for share price, IEMG’s trailing yield sits near 2.29% against EEM’s 1.73%.
The Market Already Moved
Assets tell the same story as the numbers. IEMG now holds $149.33 billion in assets against EEM’s $28.08 billion. Long-term allocators, target-date funds, and model portfolios shifted to the Core product years ago. EEM’s remaining base is heavily weighted toward traders who need the options liquidity and the tighter intraday spreads that only massive daily turnover produces.
The Real Tradeoffs
The other consideration is taxes. Swapping EEM for IEMG in a taxable account can trigger capital gains, and the two funds are similar enough that a wash-sale wrinkle is unlikely to help. In tax-advantaged accounts (IRA, 401(k), HSA), the switch is a simple sell and buy with no tax consequence, and the fee savings begin the next trading day.
What to Do With the Position
For readers holding EEM inside retirement accounts, the case for moving to IEMG is straightforward: same issuer, essentially the same exposure, roughly 87% lower fee, broader index, and stronger long-run returns. In taxable accounts, the answer depends on embedded gains. Comparing the tax bill against a decade of compounded fee savings is the calculation that matters. Traders who actively use EEM’s options market have a reason to stay. Everyone else is paying for liquidity they do not use.
Contact [email protected] for any questions or corrections.
David Beren has been a Flywheel Publishing contributor since 2022. Writing for 24/7 Wall St. since 2023, David loves to write about topics of all shapes and sizes. As a technology expert, David focuses heavily on consumer electronics brands, automobiles, and general technology. He has previously written for LifeWire, formerly About.com. As a part-time freelance writer, David’s “day job” has been working on and leading social media for multiple Fortune 100 brands. David loves the flexibility of this field and its ability to reach customers exactly where they like to spend their time. Additionally, David previously published his own blog, TmoNews.com, which reached 3 million readers in its first year. In addition to freelance and social media work, David loves to spend time with his family and children and relive the glory days of video game consoles by playing any retro game console he can get his hands on.