Meta vs. Microsoft: Two AI Spenders, Two Very Different Verdicts From Wall Street
Meta and Microsoft both reported the same week, both spending billions on AI infrastructure, yet Wall Street greeted them very differently. The reason comes down to one thing neither CEO said outright.

This post may contain links from our sponsors and affiliates, and Flywheel Publishing may receive compensation for actions taken through them.

Meta (NASDAQ: META | META Price Prediction) and Microsoft (NASDAQ: MSFT) both reported on July 29, 2026, and the results split Wall Street into two camps.
Meta beat on revenue but missed badly on earnings as AI infrastructure costs swallowed the quarter. Microsoft delivered a clean beat, an Azure milestone, and a backlog number so large it reframed the entire AI capex debate. Same theme, opposite verdict.
Ads Still Print Cash for Meta. Azure Is Doing the Heavy Lifting for Microsoft.
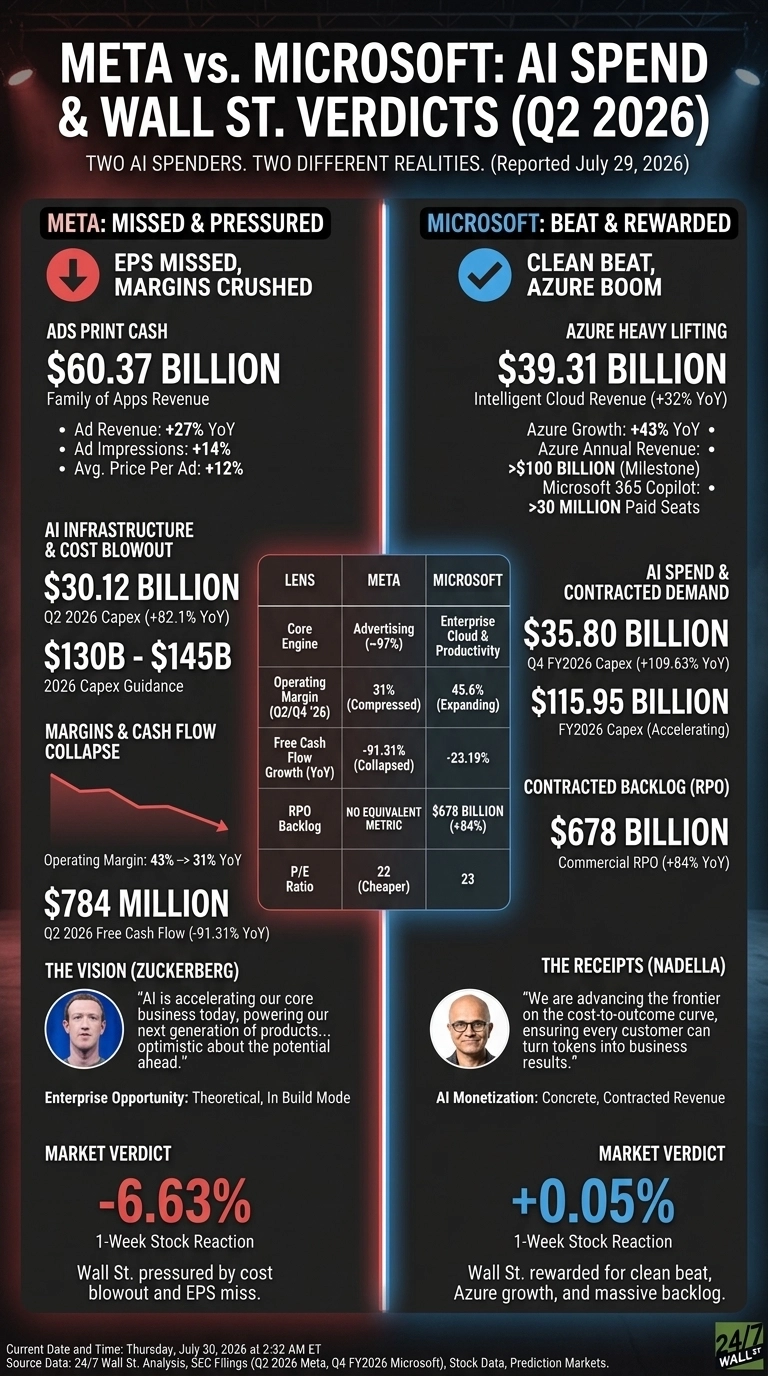
Meta’s Family of Apps produced $60.37 billion in revenue, with advertising up 27% year over year on a 14% lift in impressions and a 12% gain in average price per ad. The engine works.
The problem sat below the top line: operating margin compressed to 31% from 43%, weighed down by a $2.4 billion legal charge and $1.18 billion in severance tied to an 8,000-person cut. EPS of $6.18 missed the $7.2173 consensus, snapping a six-quarter beat streak.

Microsoft’s Intelligent Cloud segment delivered $39.31 billion, growing 32%. Azure alone grew 43% and crossed $100 billion in annual revenue for the first time. Microsoft 365 Copilot passed 30 million paid seats. EPS came in at $4.74 versus a $4.2397 estimate, an 11.81% beat aided by a $3.2 billion Anthropic-related gain.

One Company Is Selling the Vision. The Other Is Selling the Receipts.
Both CEOs sound optimistic, but the proof looks very different. Mark Zuckerberg framed the quarter as an investment year, saying “AI is accelerating our core business today, powering our next generation of products, and opening the door to entirely new enterprise opportunities.”
The enterprise opportunity is still theoretical. Meta’s 2026 capex guide moved to $130 billion to $145 billion, and free cash flow collapsed 91.31% to $784 million.
Satya Nadella pointed to specific numbers: “We are advancing the frontier on the cost-to-outcome curve, ensuring every customer can turn tokens into business results.” Behind that quote sits a $678 billion commercial RPO backlog, up 84% year over year. Meta has no equivalent contracted-revenue metric.
| Lens | Meta | Microsoft |
| Core Engine | Advertising (~97% of revenue) | Enterprise cloud and productivity |
| 2026 CapEx | $130B to $145B | $115.95B (FY26) |
| AI Monetization Proof | Ad targeting lift | 30M+ Copilot seats |
| Post-Report Reaction | -6.63% (1-week) | +0.05% (1-week) |
The Next Test Is Whether Meta’s AI Spend Turns Into Ad Yield
For Meta, Q3 guidance of $61 billion to $64 billion keeps the topline healthy, but full-year expenses of $165 billion to $169 billion mean margins stay pressured. Watch whether AI-driven ad pricing keeps climbing without another legal or severance jolt.

For Microsoft, the question is whether Azure can sustain a 40%+ growth cadence while capex runs at $35.80 billion a quarter. That RPO backlog says demand is there.
How the Setup Compares Heading Into Next Quarter
On the data, Microsoft heads into next quarter with a $678 billion backlog and 30 million Copilot seats — concrete, contracted demand signals.
Meta trades cheaper at a 22 P/E versus Microsoft near 23, and the ad engine is still growing 27%, which gives a value-oriented framing room to breathe. The Meta setup would look meaningfully different if the next quarter shows free cash flow stabilizing and legal charges fading. For now, Microsoft is monetizing AI outcomes today, while Meta is still in build mode.
Contact [email protected] for any questions or corrections.
Vandita Jadeja is a financial publisher with over a decade of experience writing about financial topics, including investment, savings, retirement, insurance and banking. Vandita is a Chartered Accountant who loves to debunk financial concepts for readers.
Her work has appeared on sites that include The Motley Fool, InvestorPlace, and Benzinga. She covers investing and focuses on stock picks and price prediction for 24/7 Wall St.
When not looking for the next stock investment opportunity, she can be found traveling, reading, chasing sunsets and enjoying her iced latte.