Forget SMH. The Chip Fund That Owns Less Nvidia Is Beating It by 20 Points
Two semiconductor ETFs hold nearly identical stocks, yet one has left the other in the dust this year by a staggering margin. The difference has nothing to do with which chips are inside and everything to do with how the…

This post may contain links from our sponsors and affiliates, and Flywheel Publishing may receive compensation for actions taken through them.
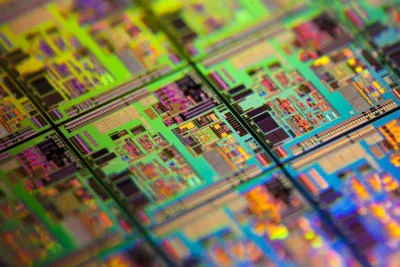
The VanEck Semiconductor ETF (NASDAQ:SMH) is the most popular way to bet on chips. SMH is the default semiconductor ETF for most brokerage accounts, prized for its concentrated exposure to the largest AI names and its long track record of leading the sector higher. That reputation is earned. But in 2026, a quieter chip fund with a flatter weighting has beaten SMH by roughly 20 percentage points year to date, and the reason has less to do with stock picking than with how the two indexes are built.
The alternative is the iShares Semiconductor ETF (NASDAQ:SOXX), which tracks the NYSE Semiconductor Index using a capped, more evenly distributed methodology. It holds many of the same names as SMH, but the weights sit closer together across the top of the book. That subtle structural difference has produced a large performance gap this year.
Why Investors Hold SMH
The expense ratio is 0.35%, competitive for a sector fund. Liquidity is deep. For someone seeking a single ticker that captures the mega-cap semiconductor complex, SMH is a defensible core holding.
Where the Concentration Bites
The issue is the fund’s top-heavy construction, which leaves it vulnerable when the largest positions lag the rest of the group. In 2026, that is exactly what happened. AMD, Broadcom, and Micron each carry weights above 9% in SMH, so any underperformance among that trio pulls the whole fund down. Meanwhile, mid-weighted names like Lam Research at 5.62% and Applied Materials at 5.53% contribute less to returns than their strong individual performances would suggest.
How SOXX Won by 20 Points
Over one year, SOXX has returned 126.59% versus 99% for SMH. Over five years, SMH’s cap-weighting has actually helped, delivering 339.48% against SOXX’s 261.59%. The pattern is consistent: when a few giants lead, SMH wins. When leadership broadens across the sector, SOXX wins. 2026 has been a broadening year.
The Fee Alternative: SOXQ
For cost-focused investors, the Invesco PHLX Semiconductor ETF (NASDAQ:SOXQ) tracks the PHLX Semiconductor Sector Index at an expense ratio of 0.10%, well below SOXX at 0.33% and SMH at 0.35%. SOXQ has returned 72.20% year-to-date, splitting the difference between the two larger funds. Its top holdings include NVIDIA at 13.30%, Micron at 7.76%, and AMD at 4.20%, so it does carry more NVIDIA exposure than either SMH or SOXX, a meaningfully higher single-name concentration.
The Tradeoffs
Switching from SMH to SOXX shifts the profile toward equipment makers and mid-cap chip names and away from the largest mega-caps. That has helped in 2026 and hurt over the last five years. Holders of SMH in a taxable account may want to weigh the capital gains impact before any sale. One path is to redirect new contributions into SOXX or SOXQ while leaving the SMH position in place; another is to swap inside a tax-advantaged account, where the change carries no tax cost.
What to Do With This
Contact [email protected] for any questions or corrections.
David Beren has been a Flywheel Publishing contributor since 2022. Writing for 24/7 Wall St. since 2023, David loves to write about topics of all shapes and sizes. As a technology expert, David focuses heavily on consumer electronics brands, automobiles, and general technology. He has previously written for LifeWire, formerly About.com. As a part-time freelance writer, David’s “day job” has been working on and leading social media for multiple Fortune 100 brands. David loves the flexibility of this field and its ability to reach customers exactly where they like to spend their time. Additionally, David previously published his own blog, TmoNews.com, which reached 3 million readers in its first year. In addition to freelance and social media work, David loves to spend time with his family and children and relive the glory days of video game consoles by playing any retro game console he can get his hands on.