SMCI Price Prediction: High Risk, High Reward, Huge Potential
Super Micro Computer has doubled its revenue year over year while accumulating $8.8 billion in debt and sitting under an active board review, leaving investors to decide whether the $13 billion Blackwell order book justifies the baggage.


Super Micro Computer (NASDAQ:SMCI | SMCI Price Prediction) is one of the most polarizing AI infrastructure names on the tape. Trading at $31.13 with revenue that more than doubled year over year in the March quarter, SMCI offers real AI leverage with real governance and margin risk attached.
Our 24/7 Wall St. price target for Super Micro is $33.83 over the next 12 months, implying 8.68% upside. Our recommendation is buy with 90% confidence.
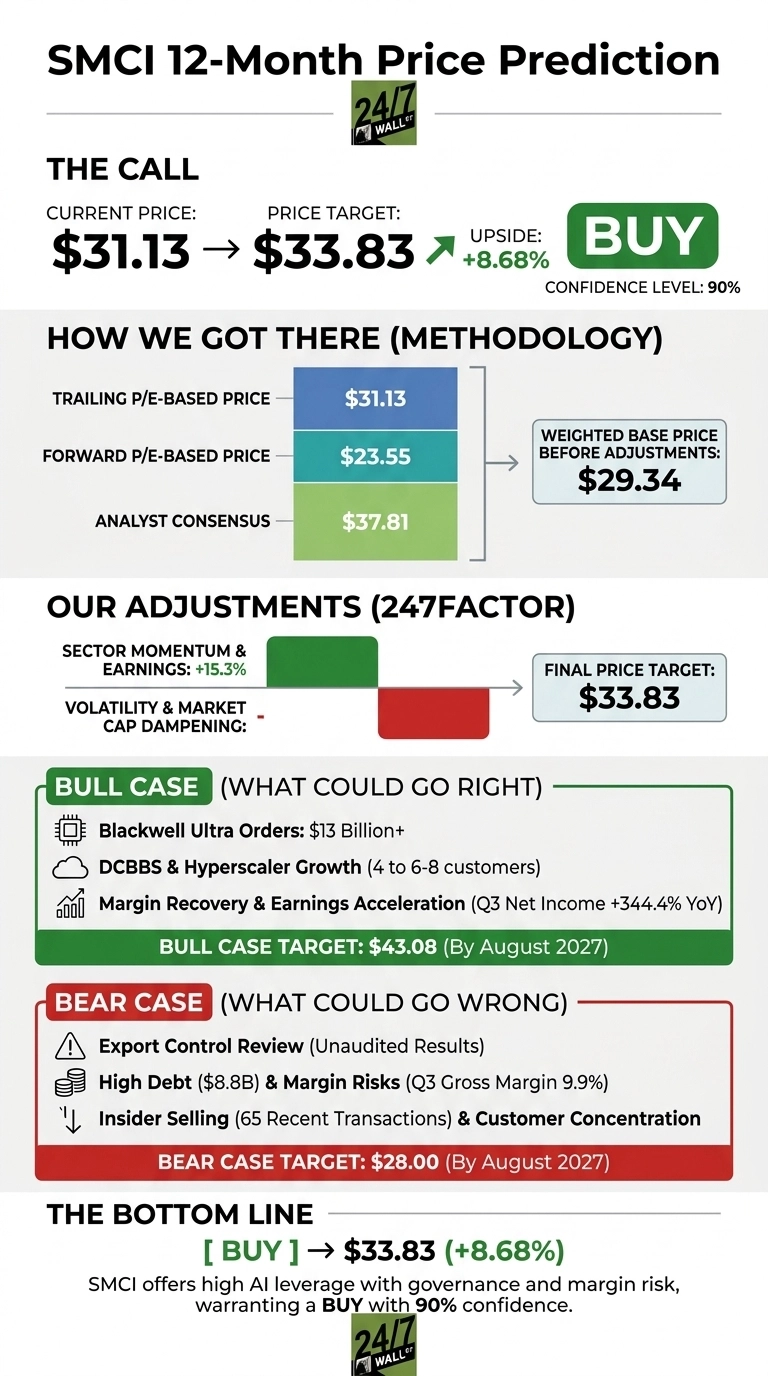

24/7 Wall St. Price Target Summary
| Metric | Value |
|---|---|
| Current Price | $31.13 |
| 24/7 Wall St. Price Target | $33.83 |
| Upside | 8.68% |
| Recommendation | BUY |
| Confidence Level | 90% |
A Round Trip Year for SMCI Shareholders
SMCI shares are down 33.3% over the past year and sit 36% below the 52-week high of $58.78, yet the last month gained 10.51%.
The Q3 FY26 report on May 5, 2026 marked a pivot: revenue missed the top line but non-GAAP EPS of $0.84 topped expectations and GAAP gross margin recovered to 9.9% from 6.3% sequentially. Management guided FY26 revenue to $38.9 billion to $40.4 billion.
The Case for $43 and Higher
SMCI’s Blackwell Ultra order book stood at more than $13 billion as of Q1 FY26, and CEO Charles Liang said the company is on track to grow large-scale datacenter customers from four in FY25 to six to eight in FY26. Q3 FY26 net income surged 344.4% year over year to $483 million.
Wall Street’s consensus target is $37.81, with two Strong Buys and three Buys in coverage. Our bull scenario points to $43.08 by August 2027, a 38.4% return if margins normalize into low double digits and DCBBS scales.
What Could Send SMCI Back Toward $28
The bear case starts with governance. Q3 results are preliminary and unaudited pending an independent board review of export-control matters. Debt has ballooned to $8.8 billion in bank debt and convertible notes, and gross margin, while recovering, remains below the mid-teens level SMCI once ran. Insider activity has been net selling across 65 recent transactions.
Our bear scenario lands at $28, a 10.06% drawdown. Bulls counter that Q3’s margin recovery and Silicon Valley manufacturing buildout show the operational thesis is intact, and debt funds inventory build of $1.09 billion aimed at Blackwell shipments.
How SMCI Compares to Dell and HPE
Dell Technologies (NYSE:DELL) is the sharpest comp, competing head-to-head for AI server orders. Dell booked $24.4 billion in AI orders in a single quarter (Q1 FY27) and guides FY27 AI-optimized server revenue to roughly $60 billion. The stock trades at P/E of roughly 25 versus SMCI at 16, making our SMCI target look conservative on relative multiples if execution holds.
Hewlett Packard Enterprise (NYSE:HPE) is the third leg. HPE’s Q2 FY26 revenue rose 40% year over year to $10.68 billion with server revenue up 32.7%, but its P/E is distorted by acquisition charges and gross margin (roughly 29%) benefits from Juniper networking mix that SMCI lacks. That structural margin gap is why our SMCI model is disciplined about forward multiple expansion.
| Company | Forward P/E | Market Cap |
|---|---|---|
| SMCI | 9 | $20.1B |
| DELL | ~14 | $147.5B |
| HPE | ~15 | $70.5B |
SMCI Price Prediction 2026-2030
My 24/7 Wall St. price target is $33.83, my recommendation is buy, and my confidence is 90%. The tipping factor is forward P/E of 9 on rapidly accelerating earnings.
I’d buy here if the independent board review clears without material restatement and Q4 lands inside the $11 billion to $12.5 billion guide. I’d stay on the sidelines if margin slips below 8% or debt climbs further.
Here is where our model projects SMCI could trade, assuming current growth trajectories hold.
| Year | 24/7 Wall St. Price Target |
|---|---|
| 2026 | $33.83 |
| 2027 | $36.54 |
| 2028 | $38.75 |
| 2029 | $40.80 |
| 2030 | $43.03 |
These projections assume SMCI executes on Blackwell Ultra shipments and DCBBS scaling. Significant upside or downside could result from export-control review outcome or a step change in hyperscaler capex.
Contact [email protected] for any questions or corrections.
Vandita Jadeja is a financial publisher with over a decade of experience writing about financial topics, including investment, savings, retirement, insurance and banking. Vandita is a Chartered Accountant who loves to debunk financial concepts for readers.
Her work has appeared on sites that include The Motley Fool, InvestorPlace, and Benzinga. She covers investing and focuses on stock picks and price prediction for 24/7 Wall St.
When not looking for the next stock investment opportunity, she can be found traveling, reading, chasing sunsets and enjoying her iced latte.