Down 50% in The Year, Is SMCI a Buy?
Super Micro Computer has shed half its value in a year, and now a board investigation, a $6.6 billion cash outflow, and a potential 48% upside are all pointing in different directions at once.

This post may contain links from our sponsors and affiliates, and Flywheel Publishing may receive compensation for actions taken through them.

Super Micro Computer (NASDAQ:SMCI | SMCI Price Prediction) has had a brutal stretch. Shares are down 51.84% over the past year and sit 36% below the 52-week high of $59.40. Despite the pain, our proprietary model sees value emerging.
Our 24/7 Wall St. price target for SMCI is $32.28, implying 13.44% upside from the current $28.46. The recommendation is buy with high confidence at 90%.
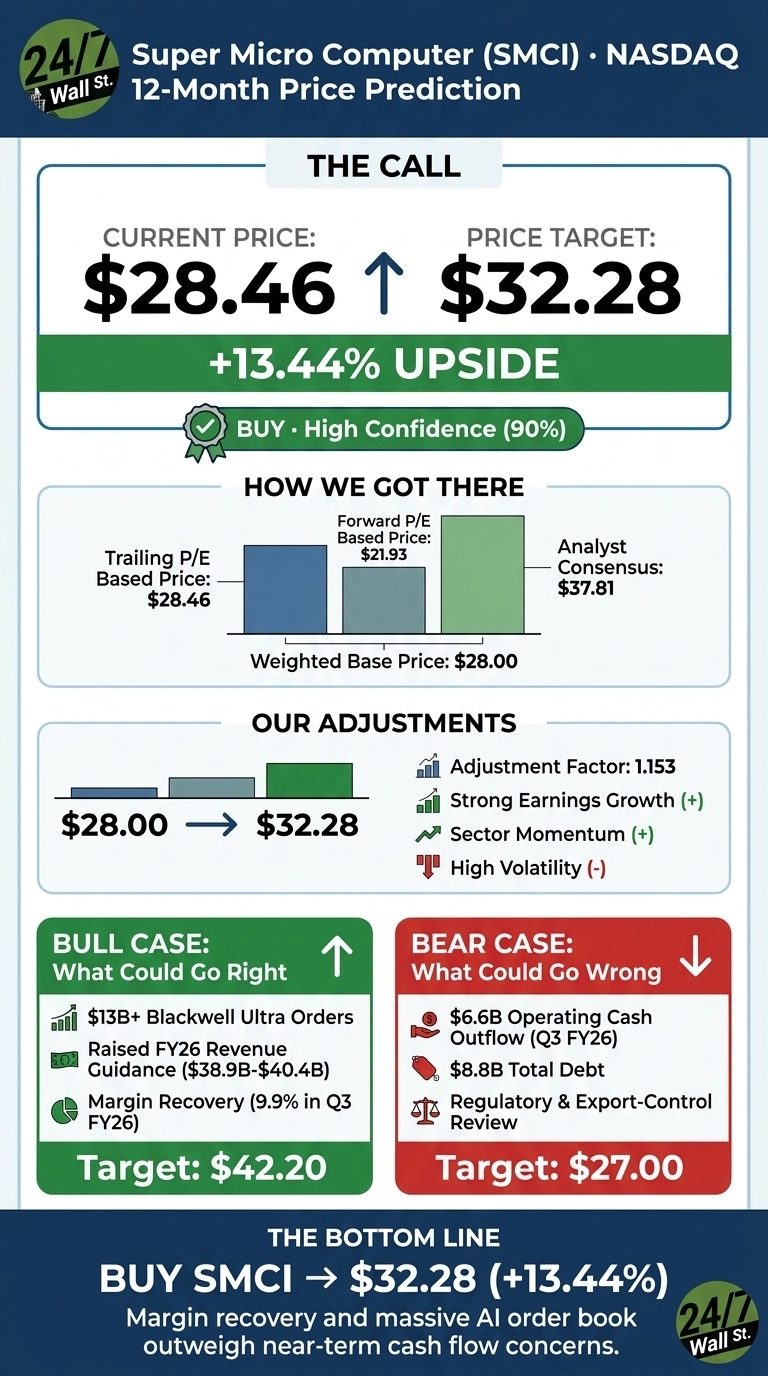
24/7 Wall St. Price Target Summary
| Metric | Value |
|---|---|
| Current Price | $28.46 |
| 24/7 Wall St. Price Target | $32.28 |
| Upside | 13.44% |
| Recommendation | BUY |
| Confidence Level | 90% |
From $59 to $28: What Broke the Story
SMCI has fallen 5.65% over the past week, though it is up 2.71% over the past month as buyers step in near lows. Pain centers on two stories. First, cash flow: Q3 FY26 saw operating cash outflow of $6.6 billion and cash reserves fell to $1.29B, down 49.12% YoY. Second, the Board is running an independent review tied to export-control matters, with preliminary results.
The offset is real. Q3 FY26 revenue reached $10.24B, up 122.68% YoY, non-GAAP EPS beat by 34.51%, and gross margin recovered to 9.9% from 6.3%. A new ITC patent investigation over Netlist memory tech has added regulatory overhang heading into the August 11, 2026 Q4 earnings report.

The Case for $42 and Beyond
The bull setup is the AI infrastructure ramp. CEO Charles Liang cited $13B in Blackwell Ultra orders and management raised FY26 revenue guidance to $38.9B to $40.4B from $33B.
Preliminary Q4 gross margins track 15% to 17%, well above prior guidance, and new orders reportedly exceed $60B. Seeking Alpha’s Pythia Research recently upgraded from sell to bullish, citing structural margin improvement. Our bull-case price is $42.20, a 48.27% return.
What Could Go Wrong
The bear case hinges on cash. The $6.6B operating cash outflow, $8.8B in bank debt and convertibles, and $169M in inventory write-downs raise real balance-sheet risk.
Bulls counter that inventory build reflects aggressive Blackwell positioning, and CFO David Weigand acquired 13,780 RSUs and 30,622 options on May 8. If export-control findings escalate or the ITC investigation restricts memory supply, the bear-case target is $27.

How SMCI Compares to Dell and HPE
Dell Technologies (NYSE:DELL) is the most direct competitor. Dell trades at 22x earnings with a 6.5% FCF yield and posted AI-optimized server revenue growth of 757% YoY in Q1 FY27. Against that, SMCI’s 18x P/E looks cheap, but Dell’s 20% gross margin dwarfs SMCI’s 11.06%. The discount is earned.
Hewlett Packard Enterprise (NYSE:HPE) offers a growth counterpoint. HPE grew Q2 FY26 revenue 40% YoY with 28.77% gross margin. SMCI outgrows HPE in top line but at meaningfully lower margins. The peer group makes our $32.28 target reasonable.
| Company | P/E | Gross Margin |
|---|---|---|
| SMCI | 18x | 11.06% |
| DELL | 22x | 20.0% |
| HPE | N/M | 28.77% |
The Setup Is the Reason to Buy
My 24/7 Wall St. price target is $32.28 with a buy rating and 90% confidence. Margin recovery in Q3 FY26 and preliminary Q4 gross margins in the 15% to 17% range are the tipping factor.
I’d buy here if the August 11 earnings report confirms sustained margin expansion and no material export-control findings. I’d stay on the sidelines if operating cash burn continues at Q3’s pace into the new fiscal year.

| Year | 24/7 Wall St. Price Target |
|---|---|
| 2026 | $32.28 |
| 2027 | $35.50 |
| 2028 | $38.75 |
| 2029 | $41.00 |
| 2030 | $43.49 |
These projections assume SMCI executes on its DCBBS strategy and Silicon Valley manufacturing ramp. Significant upside or downside could come from Blackwell demand durability or export-control outcomes.
Contact [email protected] for any questions or corrections.
Vandita Jadeja is a financial publisher with over a decade of experience writing about financial topics, including investment, savings, retirement, insurance and banking. Vandita is a Chartered Accountant who loves to debunk financial concepts for readers.
Her work has appeared on sites that include The Motley Fool, InvestorPlace, and Benzinga. She covers investing and focuses on stock picks and price prediction for 24/7 Wall St.
When not looking for the next stock investment opportunity, she can be found traveling, reading, chasing sunsets and enjoying her iced latte.