Opinion: No, Elon Musk Isn’t the Best CEO in the Magnificent 7 – It’s Jensen Huang, and Here’s Why
Everyone assumes Elon Musk runs the most impressive operation among the Magnificent Seven, but a single financial metric separates the contenders from the pretenders, and the gap turns out to be staggering.

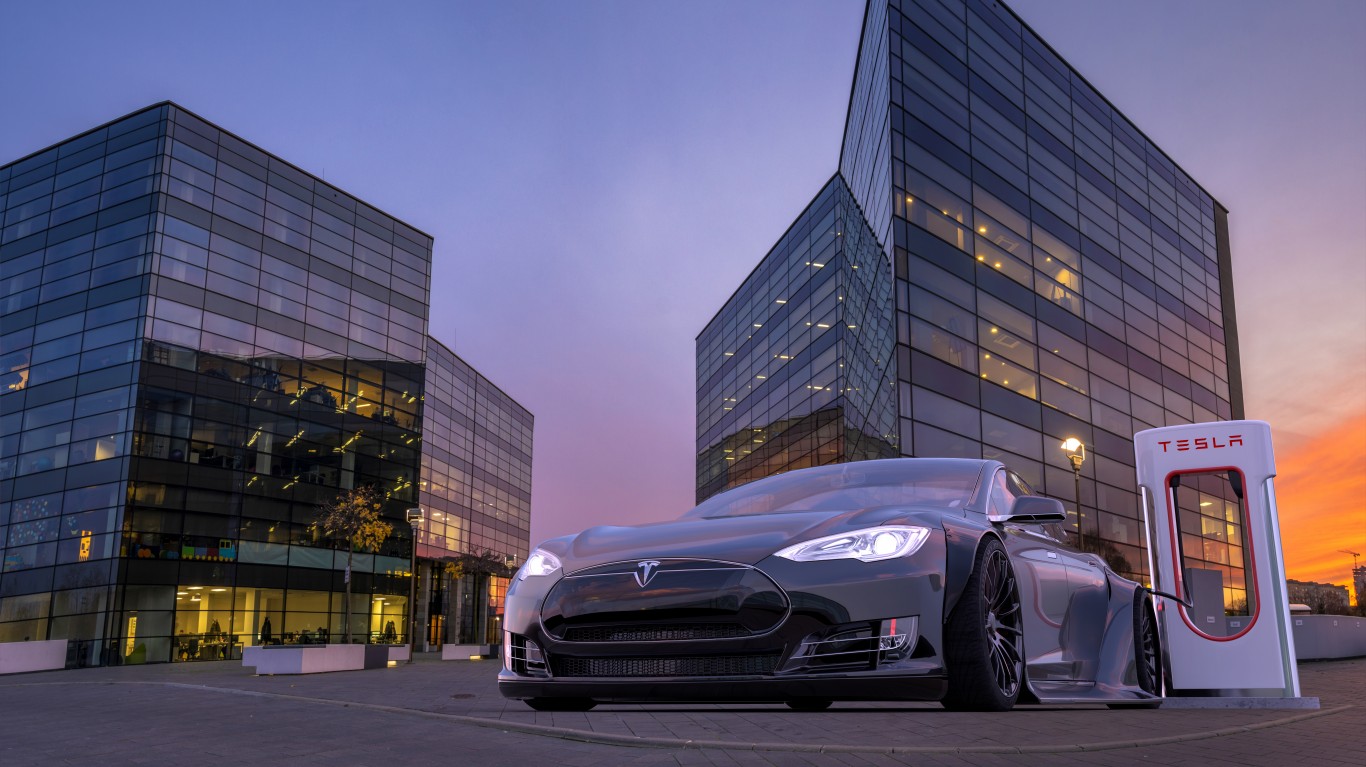
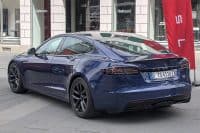
Elon Musk built the only American car company to reach mass scale since the Depression and turned an EV skeptic industry into a race. Tesla (NASDAQ:TSLA | TSLA Price Prediction) keeps growing its fleet, active FSD subscriptions reached 1.48 million, up 56%, and the robotaxi program is live in seven U.S. metros.
It’s not surprising, then, that plenty of people would say he’s the best tech CEO out there, or at the very least the best among the Magnificent Seven.
But they’re wrong, it’s actually Jensen Huang at NVIDIA (NASDAQ:NVDA), and I’ll show you why with math.
The Returns Test
Return on invested capital measures what a company earns on every dollar of debt and equity deployed. ROIC cannot be flattered by leverage or share buybacks the way return on equity can.
Tesla’s ROIC over the past 12 months is 4.1%. NVIDIA’s ROIC, by contrast, is…92.21%. That’s more than a 20x difference.
Now, in all fairness, NVIDIA’s Q1 FY27 net income included $15.9 billion of net gains on equity securities, a non-operating item that flatters trailing returns. But strip it out and the ranking still stands by an order of magnitude. This is not a close contest.
Cash In Versus Cash Out
In fact, capital discipline separates the two records even more vividly. In fiscal 2026, NVIDIA generated $96.6 billion of free cash flow against $6 billion of capital expenditure. In the first quarter of fiscal 2027, free cash flow was $48.6 billion on $1.8 billion of capex. Huang spends pennies on the dollar to produce the cash that funds the business.
Tesla runs the opposite pattern. Full-year 2025 free cash flow was $6.2 billion against capex of $8.5 billion, and the trend has worsened this year. Q2 2026 free cash flow was negative $1.1 billion, with capex of $5.8 billion, up 142% year over year. Management has guided to a roughly $25 billion capital budget for 2026. Musk is spending faster than the business currently produces cash, betting that AI infrastructure, Optimus, and Cybercab will justify it later. Today he is a net consumer of cash while Huang is a net generator on an enormous scale.
What The Income Statement Says
Operating margin strips out capital structure and one-time items. NVIDIA’s trailing operating margin is 60.4%. Tesla’s is 4.6%, and the most recent quarter was worse: Q2 2026 operating margin of 1.4%, operating income of $398 million, down 57% year over year, on an EPS miss of 39%. Revenue grew that quarter. Tesla is selling more and keeping less. NVIDIA is selling more and keeping most of it.
A View From The Table
| Metric (TTM) | Musk / Tesla | Huang / NVIDIA |
|---|---|---|
| ROIC | 4.1% | 92.21% |
| ROE | 4.89% | 101.49% |
| Operating margin | 4.59% | 60.38% |
| Debt-to-equity | 0.102 | 0.073 |
Huang framed the environment plainly on the Q1 FY27 call, calling the moment “the largest infrastructure expansion in human history”. From the operator running a 60.38% margin business that turns roughly half of revenue into free cash flow, it reads as description rather than marketing.
What Would Change The Verdict
Of course, in no way is any of this meant to diminish Musk’s enormous successes! He’s done amazing things as CEO of Tesla and SpaceX. And it’s distinctly possible that all of these investments pay off in a really huge way. A sustained recovery in operating margin toward the mid-teens, positive free cash flow through a full year of the $25 billion capex plan, and evidence that robotaxi and Optimus contribute meaningful gross profit would rewrite the script. The next filing to watch is Tesla’s Q3 2026 report, where investors can measure whether operating income catches up to the capital going in. Until then, the numbers say the best CEO in this group is the one running NVIDIA.
Contact [email protected] for any questions or corrections.
I've spent more than 15 years inside enterprise software, working alongside the finance, sales operations, and HR leaders who run the revenue engines at some of the largest tech companies in the country.
My day job is helping enterprise executives make smarter decisions about retention, compensation, and growth. These are the same operational levers that show up in every earnings report investors actually read. That perspective shapes my writing for 24/7 Wall St.
The headline numbers are easy. The interesting stuff is underneath: how companies make money, what executives are worried about, and what any of it means for the person checking their 401(k) on a Sunday afternoon. I write about personal finance and business as someone who has spent her career inside the rooms where these decisions get made.