Tesla vs Amazon: Two Giants, Two AI Bets, One Better Stock to Buy
Tesla is burning cash to build robots and robotaxis while Amazon quietly turns AI infrastructure into a profit machine. Which giant is making the smarter bet with your money right now?


Tesla (NASDAQ: TSLA | TSLA Price Prediction) and Amazon (NASDAQ: AMZN) reported Q2 2026 results that exposed their divergent AI strategies. Tesla poured cash into robotaxis, Optimus, and training compute while operating margins collapsed. Amazon leaned on AWS, advertising, and retail to fund its AI buildout without denting the operating model.
AWS Booms. Tesla’s Margins Break.
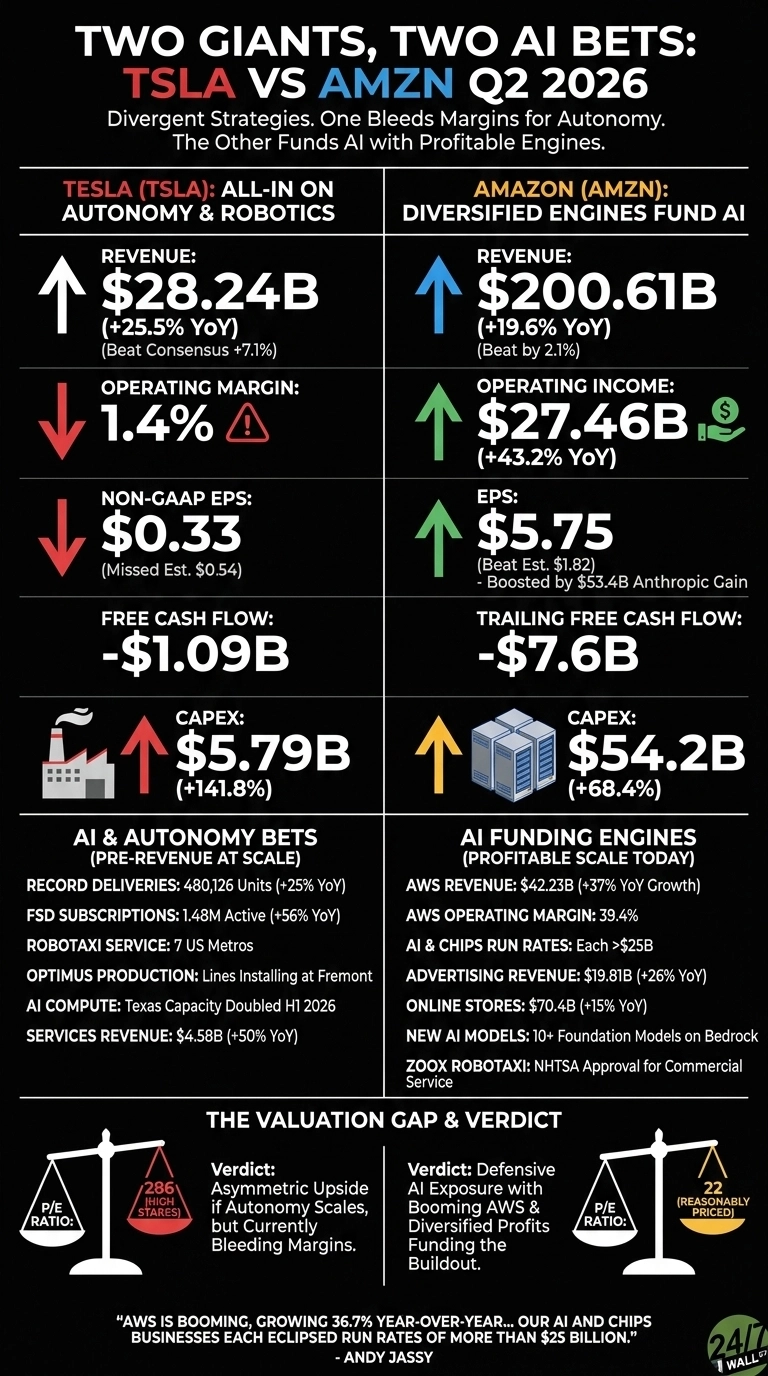
Tesla posted revenue of $28.24 billion, up 25.52% YoY and beating consensus by 7.10%. Non-GAAP EPS of $0.33 missed expectations of $0.5367, operating margin fell to 1.4%, and free cash flow flipped to -$1.09 billion as capex jumped 141.81%. Deliveries hit a record 480,126 units, Services and Other grew 50%, and active FSD subscriptions climbed to 1.48 million.
Amazon printed revenue of $200.606 billion with operating income of $27.461 billion, up 43.24% YoY. AWS delivered $42.232 billion with a 39.4% operating margin.
CEO Andy Jassy told investors, “AWS is booming, growing 36.7% year-over-year in Q2, our fastest growth in 18 quarters, and our AI and Chips businesses each eclipsed run rates of more than $25 billion.” The reported $5.75 EPS was flattered by a $53.40 billion non-operating gain tied to Anthropic.
One Bets the Company. One Diversifies the Bet.
Tesla funds autonomy and humanoid robotics from a single hardware P&L. Optimus lines are being installed at Fremont, Cybercab production began at Gigafactory Texas, and robotaxi service runs in seven U.S. metros. AI training compute in Texas more than doubled during H1 2026. That burden falls on quarterly operating income of only $398 million.
| Business Driver | Tesla | Amazon |
| Core growth engine | Deliveries, FSD, Services | AWS, Advertising |
| AI monetization today | Pre-scale | AI + Chips at $25B+ run rates each |
| Operating margin | 1.4% | AWS 39.4% |
Amazon spreads the load. Online Stores hit $70.432 billion, Third-Party Seller Services reached $46.780 billion, and Advertising grew 26% to $19.809 billion.
Graviton5 arrived with up to 25% better compute performance than Graviton4, Bedrock added 10+ foundation models, and Zoox received NHTSA approval for commercial paid robotaxi service. Capex reached $54.208 billion in a single quarter, pushing trailing free cash flow to -$7.6 billion.
| Lens | Tesla | Amazon |
| Core AI bet | Robotaxi, Optimus, FSD | AWS, Trainium, Bedrock |
| Funding source | Auto hardware | Retail, ads, cloud |
| P/E Ratio | 286 | 22 |
The Next Test Is Whether Tesla’s Cash Burn Pays Off
Amazon guided Q3 revenue to $197 billion to $202 billion and operating income to $22.5 billion to $26.5 billion, up meaningfully from $17.4 billion a year ago. Tesla offered no numeric guide.
Polymarket traders give Optimus a release by year-end just a 14.5% probability, a sober tell on the robotics timeline. TSLA is down 18.14% over the past month, while AMZN ripped 22.75% higher in the past week on the earnings report.
Why I Lean Toward Amazon at These Prices
I want the AI story where the meter is already running. Amazon at a P/E near 22, with 37% AWS growth and two AI businesses at $25 billion run rates, looks more defensible than Tesla at a P/E near 286 and a 1.4% operating margin.
If Optimus and robotaxi scale meaningfully in 2027, Tesla offers asymmetric upside. Tesla’s setup looks more compelling once free cash flow turns positive. Amazon looks like the more reasonably priced exposure to the AI infrastructure trade at current levels.
Contact [email protected] for any questions or corrections.
Vandita Jadeja is a financial publisher with over a decade of experience writing about financial topics, including investment, savings, retirement, insurance and banking. Vandita is a Chartered Accountant who loves to debunk financial concepts for readers.
Her work has appeared on sites that include The Motley Fool, InvestorPlace, and Benzinga. She covers investing and focuses on stock picks and price prediction for 24/7 Wall St.
When not looking for the next stock investment opportunity, she can be found traveling, reading, chasing sunsets and enjoying her iced latte.