Price Prediction: One Number Could Decide How High Microsoft Goes in 2027
Azure just crossed $100 billion and Copilot is scaling fast, yet Microsoft shares sit flat on the year. One overlooked number buried in the earnings report could determine whether this stock doubles Wall Street's expected upside by 2027.


Microsoft (NASDAQ:MSFT | MSFT Price Prediction) just wrapped a fiscal year where Azure crossed $100 billion in annual revenue and Microsoft 365 Copilot passed 30 million paid seats.
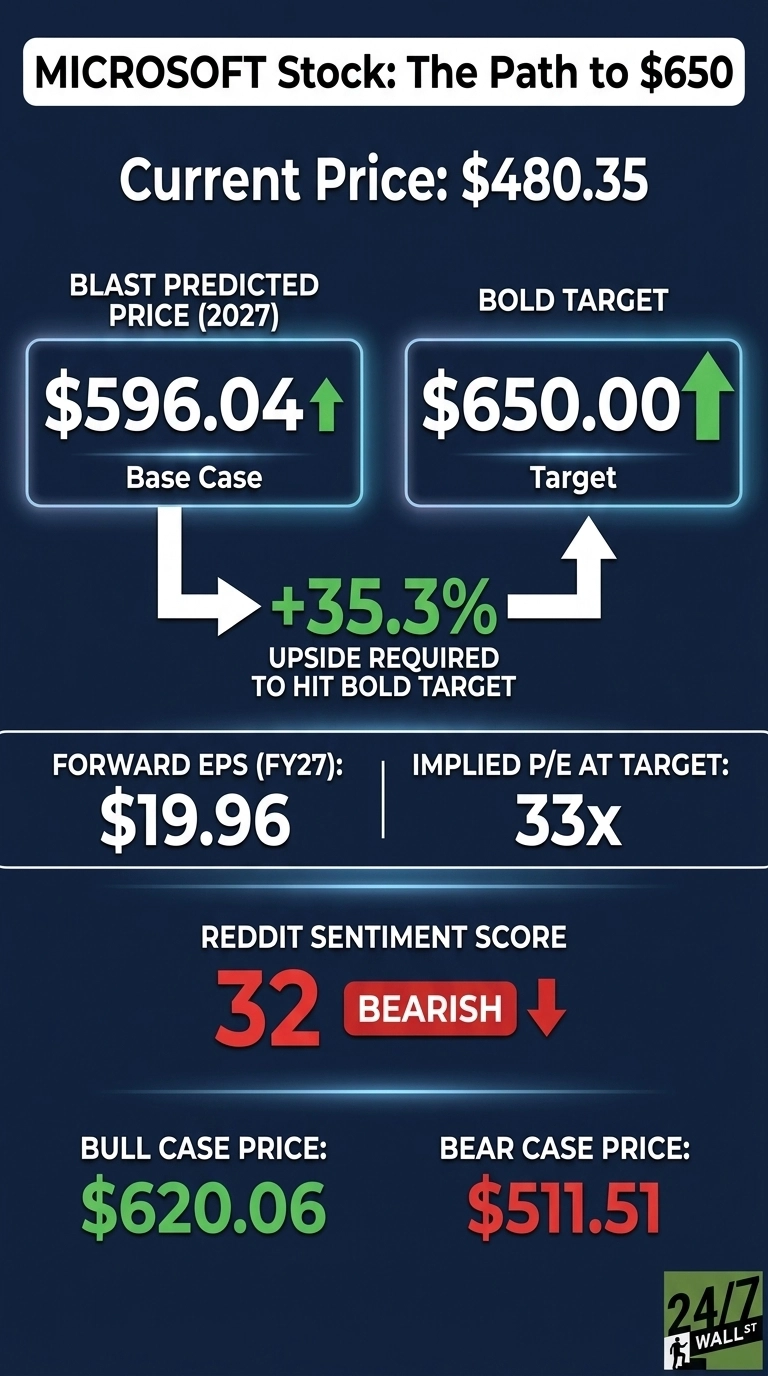
Yet the stock is essentially flat on the year, down 0.23% YTD and 6.91% over the past year. Shares closed at $480.35. Can Microsoft hit $650 by August 2027? Here is the math and where Wall Street is under-modeling the story.

What’s Holding Microsoft Back Right Now
The disconnect is capex fatigue overwhelming otherwise strong fundamentals. Microsoft committed $115.95 billion in FY2026 capital expenditures, up 79.62% year over year, and management guided FY27 capex to roughly $175 billion after a lease-classification change. Free cash flow fell 6.46%.
Traders noticed. Shares are down 5.08% in the past week even after a 21.97% one-month bounce off the July lows. With a beta of 1.099, MSFT is not a hiding place when the AI capex trade wobbles. The Yahoo Finance framing was on the nose: Azure and capex would decide the reaction. Capex won the argument, at least for now.
Wall Street Sees 19% Upside. Our Model Says 24%
Analysts carry an average target of $569.56, with 14 Strong Buys, 40 Buys, 3 Holds, and zero Sells. That is 95% bullish sentiment. Our base case is more aggressive at $596.04, implying 24.08% upside with a 0.9 confidence score (high).
The bull scenario stretches to $620.06. Analysts are anchored on the current capex cycle and underweighting the $678 billion commercial RPO backlog, up 84%. That is contracted revenue on the books. Consensus feels one multiple turn too conservative.

The Path to $650 Per Share
Reaching $650 from $480.35 requires a 35.3% gain. That is above both our base and bull cases, demanding multiple expansion on top of earnings delivery.
With forward EPS of $19.96, a price of $650 implies a forward P/E of 33x. Our base case of $596.04 already implies 28x, meaning the bold target requires roughly 5x additional multiple expansion.
Why that re-rating is plausible: the 247Factor adjustment of 1.154 is driven by a 1.15 technology sector multiplier, 31.7% earnings growth, and 95% bullish analyst tilt. Azure is guided to 45% constant-currency growth in Q1 FY27, with “demand continues to exceed available supply” per CFO Amy Hood.
Satya Nadella framed the flywheel this way: “We are advancing the frontier on the cost-to-outcome curve, ensuring every customer can turn tokens into business results.”
If Copilot ARPU expands under the new per-seat plus consumption billing model, FY27 EPS beats the $19.96 anchor and the multiple math gets easier. The single biggest risk is a demand pause that turns record capex into stranded capacity.

Where Microsoft Trades Today vs Its Earnings Power
At $480.35 against $19.96 forward EPS, MSFT trades at roughly 24x forward earnings. For a business compounding revenue at 17.79% and net income at 31.34%, that is not a demanding multiple.
Shares sit 4% below the 52-week high of $550.24 and well above the $349.20 low. MSFT is up 837.03% over ten years. Cheap on growth, expensive only on absolute price.
Is $650 Realistic? Here’s My Take
$650 requires a 35.3% gain and a re-rate to 33x forward earnings. That is a stretch, but defensible.
Three things need to go right: Azure growth stays north of 40% into FY27, the $678 billion RPO converts to reported revenue on schedule, and Copilot consumption billing lifts monetization above per-seat expectations. Any signal that AI capex is running ahead of enterprise demand derails it (we mapped the power, cooling, and networking suppliers riding the same buildout in a free report here: 7 Stocks Powering the AI Boom). We’ve outlined the blueprint for how Microsoft could reach $650 in 2027.
Contact [email protected] for any questions or corrections.
Vandita Jadeja is a financial publisher with over a decade of experience writing about financial topics, including investment, savings, retirement, insurance and banking. Vandita is a Chartered Accountant who loves to debunk financial concepts for readers.
Her work has appeared on sites that include The Motley Fool, InvestorPlace, and Benzinga. She covers investing and focuses on stock picks and price prediction for 24/7 Wall St.
When not looking for the next stock investment opportunity, she can be found traveling, reading, chasing sunsets and enjoying her iced latte.