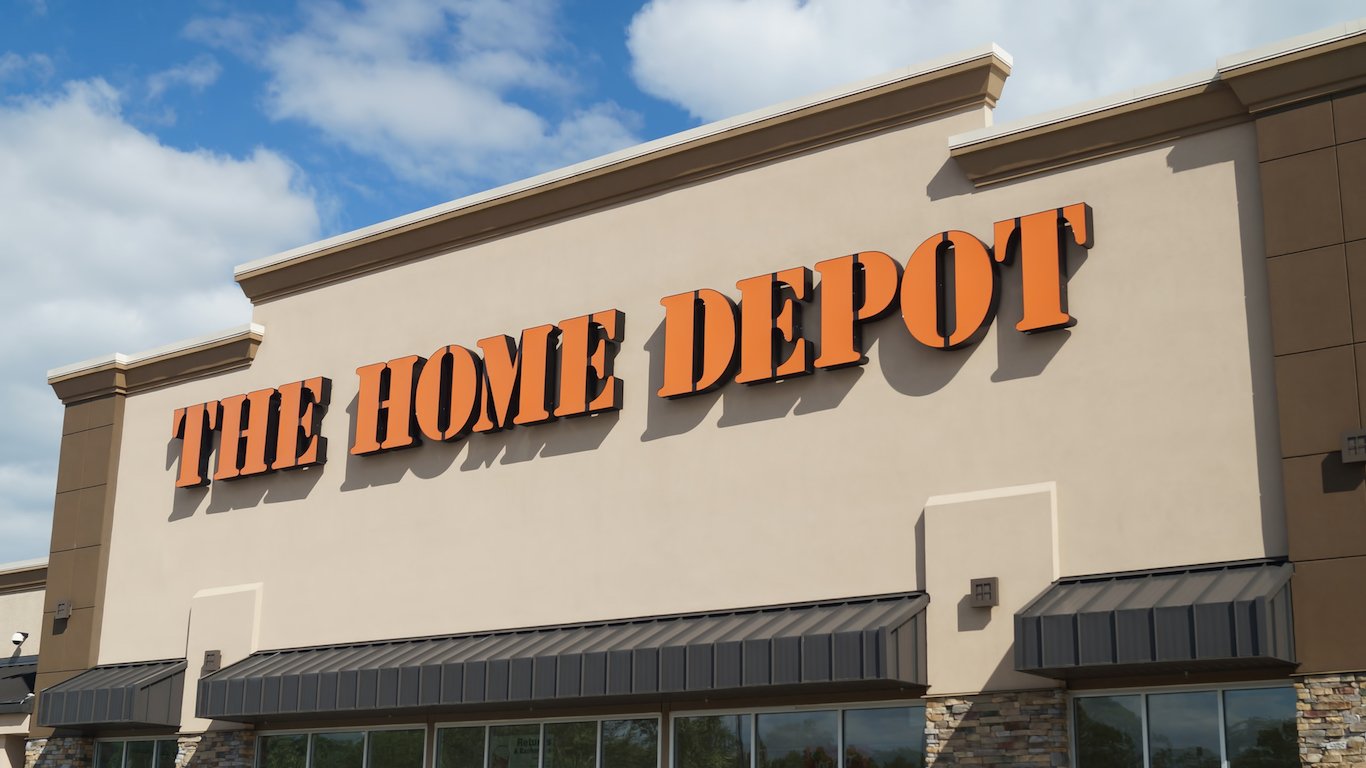
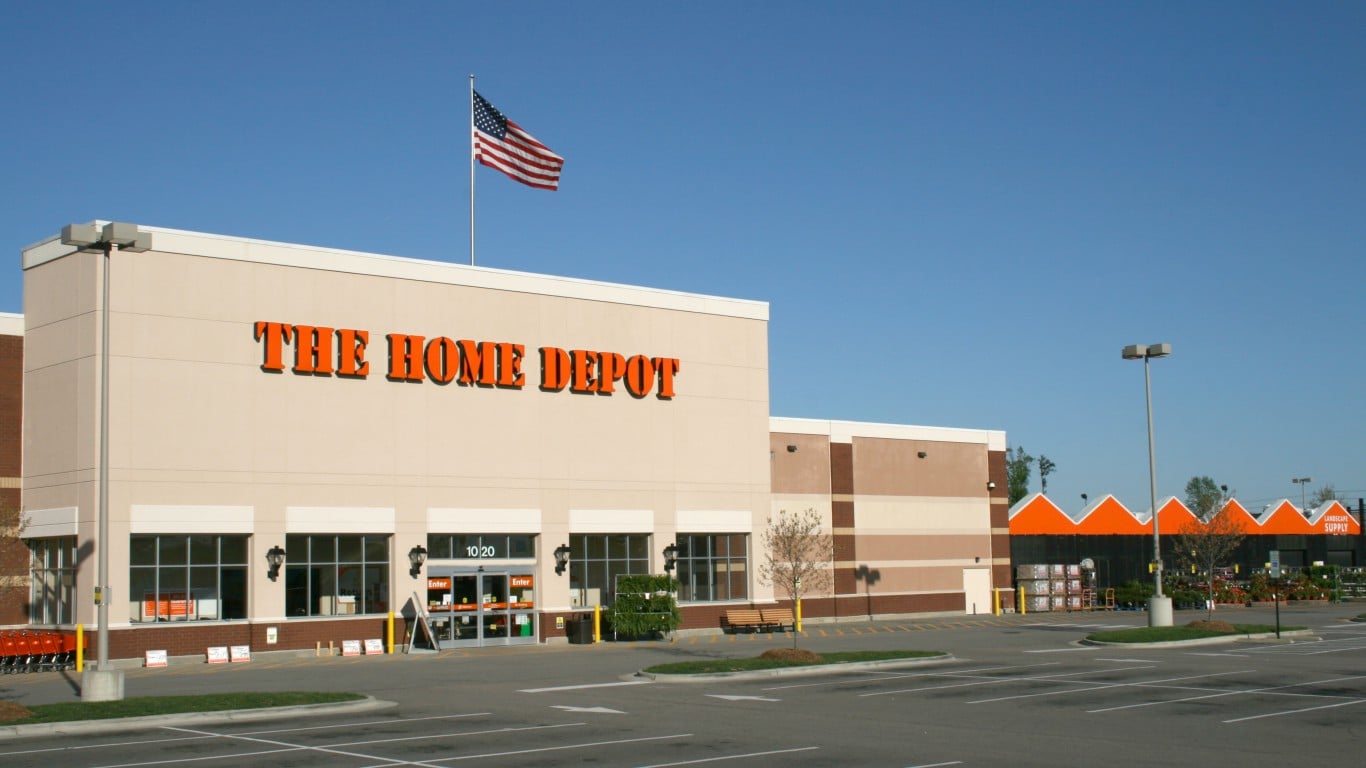
Home Depot Just Delivered a Big Vote of Confidence in Its Business
Home Depot's stock sits well below its 52-week high after a rough stretch, but something in the latest earnings report caught analysts off guard and shifted the outlook in a meaningful way.

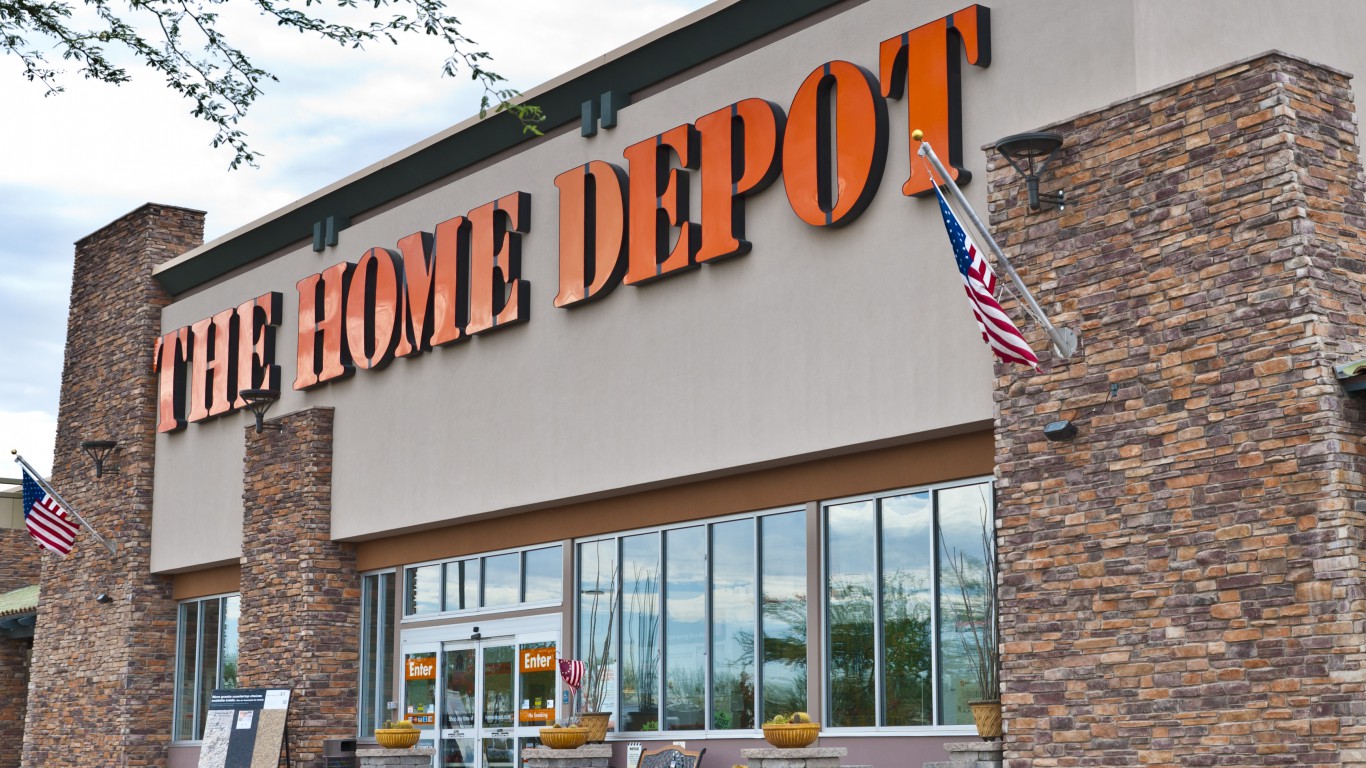
Home Depot (NYSE:HD | HD Price Prediction) delivered a quarter that changes the conversation. After a soft Q1, management reaffirmed full-year guidance, comparable sales turned positive, and the Pro business gained share.
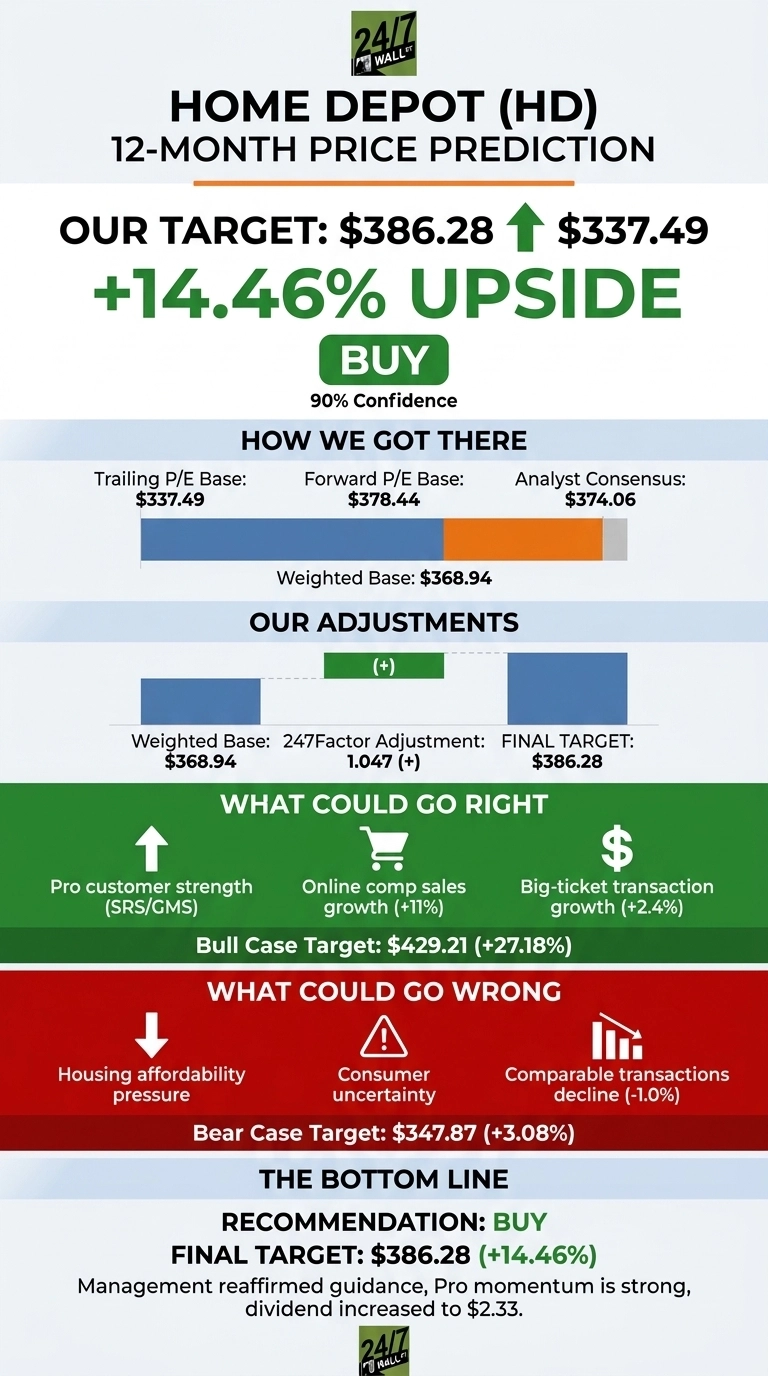
My 24/7 Wall St. price target for Home Depot is $386.28, implying 14.46% upside from the $337.49 close on August 18, 2026. My rating is buy, with high confidence at 90%.
24/7 Wall St. Price Target Summary
| Metric | Value |
|---|---|
| Current Price | $337.49 |
| 24/7 Wall St. Price Target | $386.28 |
| Upside | 14.46% |
| Recommendation | BUY |
| Confidence Level | 90% |

A Quiet Rally Beneath a Noisy Market
HD is down 4.79% over the past week and 12.2% over the past year, sitting 11% below its 52-week high of $418.06.
The Q2 FY26 earnings report told a better story: revenue of $47.9 billion grew 5.7% year over year, adjusted EPS came in at $4.92, and comparable sales rose 1.7%.
CFO Richard McPhail said “our second quarter results exceeded our expectations” and reaffirmed the full-year outlook. Management raised the dividend to $2.33 per quarter, its 156th consecutive cash dividend.
Why Bulls See a Path to $429
The bull case rests on the Pro customer. SRS Distribution anchors a professional ecosystem where 90% of stores close sales through SRS, with $400 million in expected cross-sell this year. Online comps grew 11%, marking the fifth straight double-digit quarter, and big-ticket comps over $1,000 rose 2.4%.
If housing turnover thaws and comps accelerate toward guidance’s high end, the 247Factor bull scenario points to $429.21, a 27.18% return. Analyst consensus of $374.06 leans bullish with 21 buy ratings versus 15 holds.

What Could Go Wrong
Comparable transactions fell 1.0% in Q2, and housing turnover remains near historical lows at roughly 3% of stock. Q1 was a warning shot: operating margin compressed to 11.9% and CEO Ted Decker cited “greater consumer uncertainty and housing affordability pressure.”
Net interest expense is guided to roughly $2.3 billion as SRS and GMS acquisition debt weighs on the balance sheet. The intangible amortization drag of roughly 40 basis points on operating margin is a non-cash headwind, and bulls argue it obscures true earning power. The bear scenario pegs downside at $347.87, still above today’s price.
How Home Depot Compares to Lowe’s and Floor & Decor
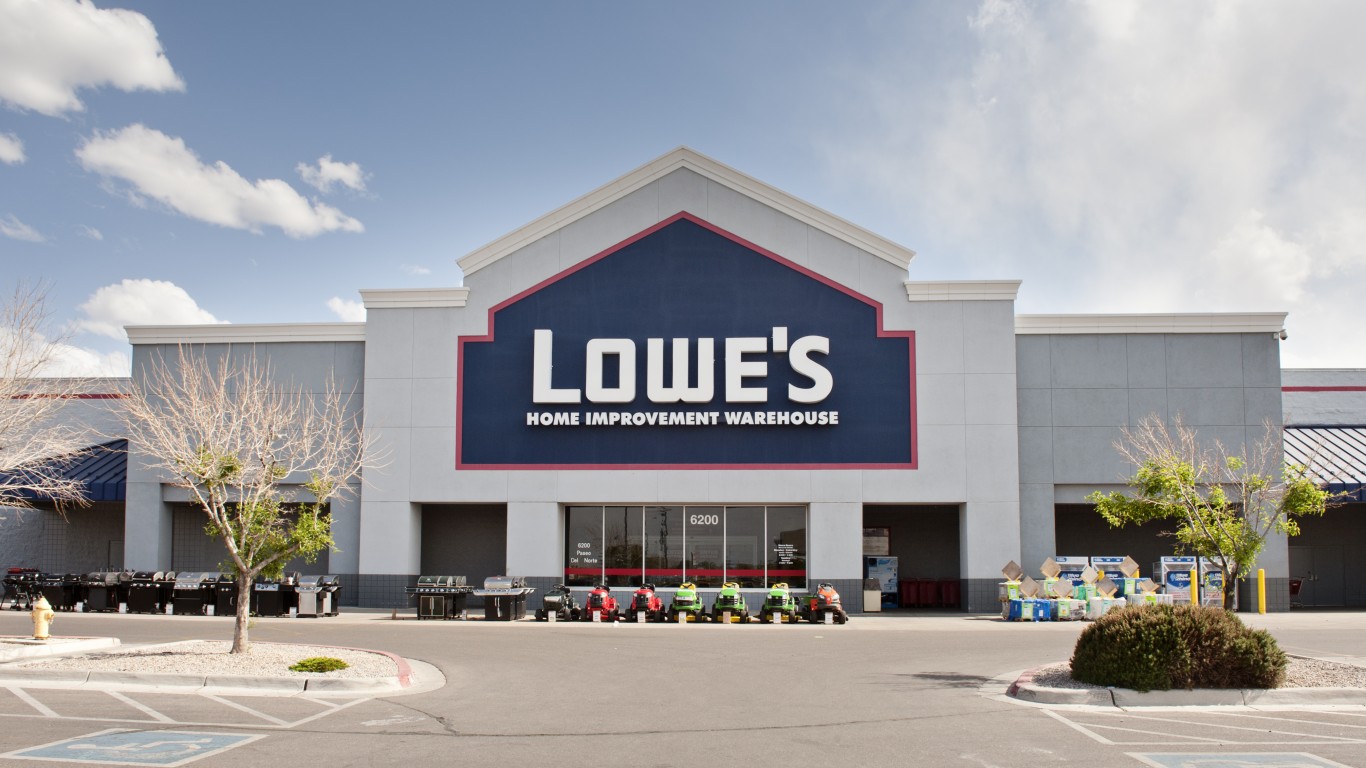
Lowe’s (NYSE:LOW) is the direct big-box rival, trading at a forward P/E of 17 versus Home Depot’s 23. Lowe’s posted quarterly revenue growth of 10.3% YoY, but Home Depot’s Pro moat via SRS justifies a premium multiple.
Floor & Decor (NYSE:FND) is a growth-oriented specialty comp, trading at a forward P/E of 26 with quarterly earnings growth of 53.4% YoY on a lower base. Between a cheaper direct peer and a pricier growth comp, HD’s multiple looks reasonable, and my 24/7 Wall St. price target of $386.28 sits well inside that band.
| Company | Forward P/E | Operating Margin |
|---|---|---|
| Home Depot | 23 | 11.9% |
| Lowe’s | 17 | 11.1% |
| Floor & Decor | 26 | 5.4% |
Home Depot Price Prediction 2026-2030
The 24/7 Wall St. price target of $386.28 with a buy recommendation and 90% confidence rests on a simple thesis: management reaffirmed guidance in a hostile housing environment, Pro momentum is real, and the dividend hike signals the C-suite believes cash generation is durable.
The setup rewards patience if investors can tolerate flat comps for another quarter or two. The thesis weakens if housing turnover deteriorates further and comp transactions extend their decline into negative mid-single-digits.

Extending the 24/7 Wall St. price target model, here is where HD could trade if current growth trajectories and multiples hold.
| Year | 24/7 Wall St. Price Target |
|---|---|
| 2026 | $386 |
| 2027 | $418 |
| 2028 | $452 |
| 2029 | $488 |
| 2030 | $527 |
These projections assume Home Depot continues executing on SRS integration and Pro share gains. Meaningful upside or downside could come from a housing turnover rebound or a prolonged rate-driven slowdown.
Contact [email protected] for any questions or corrections.
Vandita Jadeja is a financial publisher with over a decade of experience writing about financial topics, including investment, savings, retirement, insurance and banking. Vandita is a Chartered Accountant who loves to debunk financial concepts for readers.
Her work has appeared on sites that include The Motley Fool, InvestorPlace, and Benzinga. She covers investing and focuses on stock picks and price prediction for 24/7 Wall St.
When not looking for the next stock investment opportunity, she can be found traveling, reading, chasing sunsets and enjoying her iced latte.