
Home Depot (NYSE:HD | HD Price Prediction) sits at an inflection point. The stock has slid from a September 2025 peak near $422.71 to $302.44, hugging the lower end of its 52-week range as housing affordability and tepid consumer sentiment weigh on big-ticket projects.
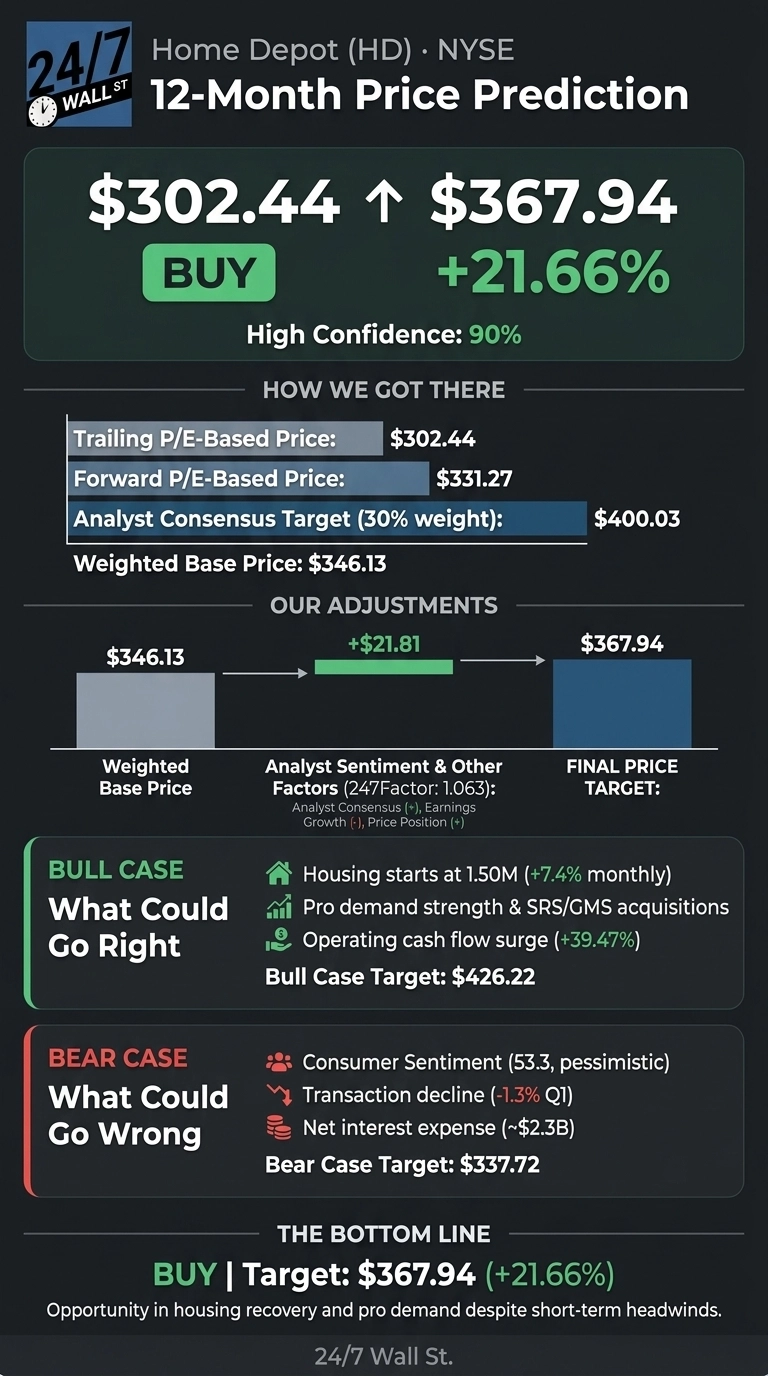
Our 24/7 Wall St. price target for Home Depot is $367.94 over the next 12 months, implying 21.66% upside. Our recommendation is buy, with high confidence at 90%.
24/7 Wall St. Price Target Summary
| Metric | Value |
|---|---|
| Current Price | $302.44 |
| 24/7 Wall St. Price Target | $367.94 |
| Upside | 21.66% |
| Recommendation | BUY |
| Confidence Level | 90% |
A Brutal Reset From Last Summer’s Highs
Home Depot is down 13.44% over the past month, 11.5% year to date, and 18.25% over the trailing year.
The Q1 fiscal 2026 earnings report on May 19, 2026 showed revenue of $41.77 billion, up 4.79% year over year, with comparable sales of +0.6% and adjusted diluted EPS of $3.43. Operating margin compressed to 11.9% from 12.9%, hit in part by $119 million in SRS intangible amortization. CEO Ted Decker pointed to “greater consumer uncertainty and housing affordability pressure” as the prevailing backdrop.
The Case for $426 and Beyond
Bulls have a credible roadmap. Housing starts hit 1.50 million annualized in March 2026, up 7.4% monthly, and the 12-to-18-month lead time on starts supports rising pro demand into 2027. Furnishings spending climbed to $525.1 billion annualized in March 2026.
SRS Distribution’s 1,280+ locations and the GMS acquisition ($900 million in incremental Q3 revenue over eight weeks) extend the pro/specialty trade reach. Operating cash flow surged 39.47% in Q1.
Insider net buying across 58 recent transactions reinforces internal confidence. Our bull-case path lands at $426.22, a 40.93% return, broadly aligned with the analyst consensus target of $400.03 and 22 Buy or Strong Buy ratings.
The Risks Worth Watching
The bear case starts with the consumer. The University of Michigan Consumer Sentiment Index sits at 53.3, in pessimistic territory. Customer transactions fell 1.3% in Q1, free cash flow declined 22.54% in FY2025, and net interest expense of $2.3 billion is a permanent post-acquisition headwind. Tariff uncertainty looms.
Bears would argue the 21x forward multiple leaves little cushion if comps stall. The counterfactual: margin compression largely reflects acquired intangible amortization (40 bps drag), and FY2026 adjusted operating margin guidance of 12.8%-13% shows the underlying business is steady. Our bear-case lands at $337.72.
Home Depot Price Prediction 2026-2030
Our 24/7 Wall St. price target of $367.94 reflects high 90% confidence and a buy recommendation. The scale tips on housing starts strength and a stock that has already absorbed most of the consumer-uncertainty narrative.
I’d be a buyer here if comparable sales hold positive and housing starts stay above 1.4M. I’d stay on the sidelines if comps turn negative or if tariff escalation forces another guidance cut.
Looking further ahead, here is where our model projects Home Depot could trade, assuming current growth trajectories and margin recovery from acquisition integration hold.
| Year | 24/7 Wall St. Price Target |
|---|---|
| 2026 | $332.70 |
| 2027 | $367.94 |
| 2028 | $418.50 |
| 2029 | $478.20 |
| 2030 | $546.53 |
These projections assume Home Depot continues integrating SRS and GMS while housing demand normalizes. Significant upside or downside could result from a sharper housing recovery or sustained tariff pressure on building materials.
Contact [email protected] for any questions or corrections.