ExxonMobil vs. Chevron: We Compared 10 Years of Dividend Growth And Here’s the Winner
Both oil giants raised dividends again in 2026 and posted blockbuster quarters, but a decade of payout history reveals one clear winner on durability and one on yield. Knowing which fits your portfolio could matter more than the latest earnings…

ExxonMobil (NYSE:XOM | XOM Price Prediction) and Chevron (NYSE:CVX) both reported blockbuster quarters this summer, and both raised dividends yet again in 2026. That makes this the right moment to look past a single earnings report and ask a harder question: over a full decade, which oil major has actually treated dividend investors better?
Two Very Different Quarters Under the Hood
Chevron’s Q2 was the louder headline. Revenue hit $67.20B, worldwide production reached a record 4,070 MBOED, and adjusted EPS came in at $6.06, a seventh straight beat. CEO Mike Wirth credited “disciplined investment and strong execution”, and it shows: US refinery throughput ran at 97% utilization, and downstream earnings jumped to $4.87B from $737M a year earlier.

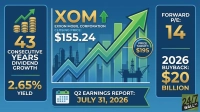
ExxonMobil’s Q2 was quieter on the surface but arguably more impressive. The company posted industry-leading earnings of $14.5 billion and $23.6 billion in operating cash flow despite losing “approximately 10% of our upstream production” to Middle East disruption. Guyana alone contributed roughly 900,000 barrels per day, and Permian output topped 1.8 million oil equivalent barrels per day.

Ten Years of Dividend Checks, Side by Side
Now the payout question. Both companies have been quietly compounding for a decade, but the paths look different.
| Dividend Lens | ExxonMobil | Chevron |
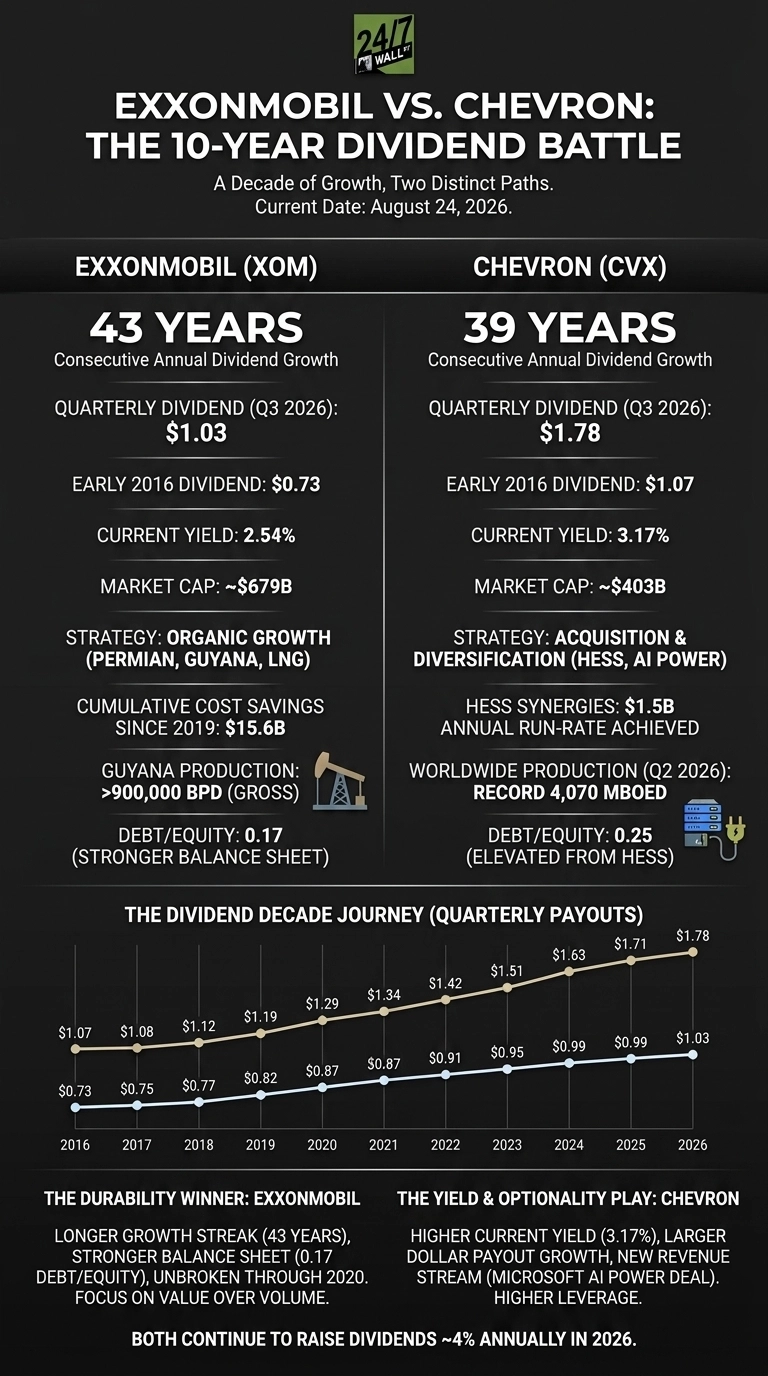
| Quarterly div, early 2016 | $0.73 | $1.07 |
| Quarterly div, 2026 | $1.03 | $1.78 |
| Consecutive annual raises | 43 years | 39 years |
| Current yield | 2.46% | 3.39% |
Chevron grew its per-share payout by a larger dollar amount over the decade, and its yield today is meaningfully higher. But Exxon never blinked through the 2020 crash, when many peers cut, and now sits on 43 consecutive annual increases. On pure streak length and defensiveness, Exxon wins.
Organic Growth Vs. Buy-and-Build
The strategies funding those checks have diverged sharply. Exxon is riding organic firepower: Permian, Guyana, Golden Pass LNG, and $16.3 billion of cumulative structural cost savings since 2019. CFO Neil Hansen described Guyana as “very much an inflection into free cash flow” after full recovery of the $55 billion investment.

Chevron went the acquisition route. Hess synergies hit a $1.5 billion annual run-rate six months ahead of schedule, and Chevron cut more than $8 billion of debt in Q2 alone. Then came Project Kilby, a 20-year take-or-pay deal with Microsoft (NASDAQ:MSFT) for 2.67 gigawatts of behind-the-meter power for AI data centers. That is a genuinely new revenue stream for a Big Oil dividend.

What Decides the Next Ten Years
I will be watching whether Guyana’s cash-flow inflection lets Exxon accelerate its raises past the current roughly 4% annual pace. You should keep an eye on whether Chevron’s Microsoft deal actually clears FID later in 2026, because mid-teens returns on contracted power would change the dividend math.
Why I Give the Decade to Exxon, But Own Chevron for Yield
If someone made me pick a ten-year dividend winner based on durability, I lean Exxon. The 0.17 debt-to-equity balance sheet and unbroken streak through 2020 tell me the check keeps clearing in the ugliest markets (we ranked ten companies with the longest raise streaks by valuation in a free Dividend Kings report).
If I wanted more current income and did not mind Hess integration risk, Chevron’s 3.39% yield and Kilby optionality look more interesting. Both can work. Neither is broken. I just view them as meaningfully different investments.
Contact [email protected] for any questions or corrections.
Vandita Jadeja is a financial publisher with over a decade of experience writing about financial topics, including investment, savings, retirement, insurance and banking. Vandita is a Chartered Accountant who loves to debunk financial concepts for readers.
Her work has appeared on sites that include The Motley Fool, InvestorPlace, and Benzinga. She covers investing and focuses on stock picks and price prediction for 24/7 Wall St.
When not looking for the next stock investment opportunity, she can be found traveling, reading, chasing sunsets and enjoying her iced latte.