Alphabet vs. Meta: One AI Giant Looks More Attractive
Alphabet and Meta both posted blockbuster Q2 2026 revenue, but one company's AI spending quietly destroyed its free cash flow by more than 90% while the other expanded margins to levels rarely seen at this scale. The divergence points to…

Alphabet (NASDAQ:GOOG | GOOG Price Prediction) and Meta Platforms (NASDAQ:META) both reported Q2 2026 results in late July. Alphabet extended its EPS-beat streak to 11 consecutive quarters while Cloud lit up. Meta cleared revenue but snapped a six-quarter EPS beat streak as AI spending and legal charges chewed through margins.
Cloud Momentum Powers Google, Ad Costs Weigh on Meta
Alphabet posted $119.8 billion in revenue, up 24.23% year over year, with Google Cloud revenue growing 82% to $24.8 billion and cloud backlog reaching $514 billion. Sundar Pichai said “Q2 was an amazing quarter”, and the numbers back him up. Search still grew 17% even as AI Overviews cannibalized traditional queries, which is a real tell about durability.

Meta grew revenue 27.96% to $60.80 billion, but EPS came in at $6.18 against a $7.221 estimate. Total expenses jumped 55% year over year, weighed down by $2.40 billion in legal charges and $1.18 billion in severance tied to an 8,000-employee reduction. Ad impressions rose 14% and price per ad rose 12%, so the core engine still hums.

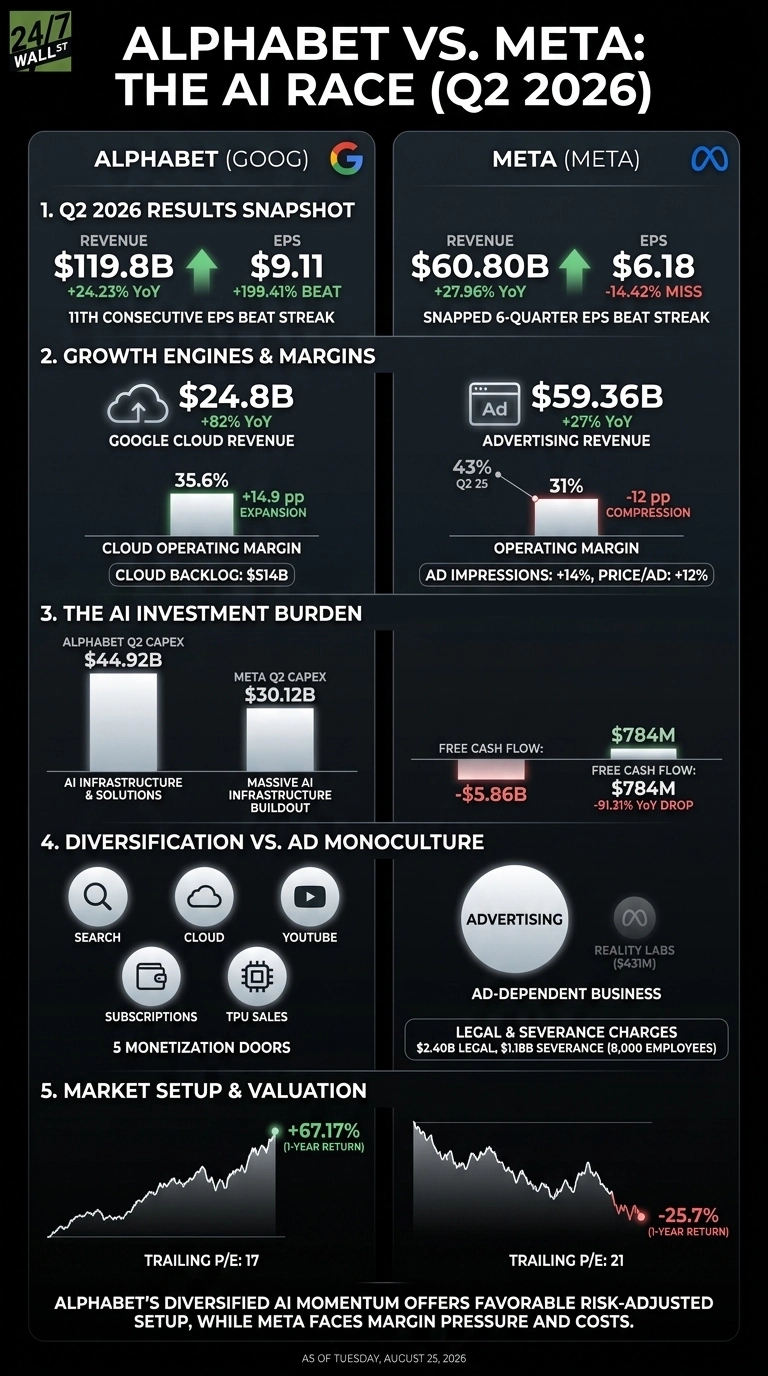
| Business Driver | Alphabet | Meta |
| Main growth engine | Google Cloud + AI infrastructure | AI-optimized ad targeting |
| Operating margin | 34%, expanding | 31%, down from 43% |
| Q2 CapEx | $44.92 billion | $30.12 billion |
Diversified Portfolio vs. Advertising Monoculture
Alphabet is monetizing AI through five distinct doors: Search, YouTube, Cloud, subscriptions, and TPU system sales. Nearly 90% of the Fortune 100 use Gemini Enterprise, and Pichai said Alphabet is “in very early innings” of the shift. Cloud operating margin actually reached 35.6%, versus 20.7% a year ago. That is unusual for a business absorbing this much capacity.

Meta remains overwhelmingly an ads business. Reality Labs contributed only $431 million. Zuckerberg is betting the buildout unlocks personal agents, business agents, and API revenue, saying “we believe that there will continue to be a significantly higher margin on selling intelligence rather than selling compute directly.” Ambitious. Unproven at scale. Free cash flow tells the story: Meta produced just $784 million, down 91.31%.

What Decides the Next Four Quarters
I will be watching whether Alphabet can absorb fiscal 2026 CapEx of $175 billion to $185 billion without cracking Cloud margins, since third-party capacity use will pressure them.
For Meta, the number that matters is full-year 2026 CapEx of $130 to $145 billion paired with $165 to $169 billion in total expenses. Meta needs its ad engine to keep compounding at 27% to fund that arithmetic. All of that CapEx has to be powered, cooled, and networked by somebody, and we pulled together seven of those suppliers in a free AI infrastructure report.
Where the Setup Favors Alphabet After This Quarter
The risk-adjusted setup currently reads more favorably for Alphabet. Cloud is accelerating, Search is proving AI-resilient, and shares are up 67.17% over one year on a 17 trailing P/E.
Meta is down 25.7% over the past year at a 21 P/E, a valuation that turnaround-oriented investors may find worth researching. The variables to watch: whether Meta’s margins stabilize by Q4 and whether the legal overhang clears.
Contact [email protected] for any questions or corrections.
Vandita Jadeja is a financial publisher with over a decade of experience writing about financial topics, including investment, savings, retirement, insurance and banking. Vandita is a Chartered Accountant who loves to debunk financial concepts for readers.
Her work has appeared on sites that include The Motley Fool, InvestorPlace, and Benzinga. She covers investing and focuses on stock picks and price prediction for 24/7 Wall St.
When not looking for the next stock investment opportunity, she can be found traveling, reading, chasing sunsets and enjoying her iced latte.