Amazon Has Zero Sell Ratings. Here’s the Price Target That Follows
Every analyst covering Amazon is bullish, earnings growth is running at triple digits, and AWS just hit its fastest expansion in four and a half years, yet the stock sits 12% off its highs and barely outpacing a savings account.…

This post may contain links from our sponsors and affiliates, and Flywheel Publishing may receive compensation for actions taken through them.

Amazon (NASDAQ:AMZN | AMZN Price Prediction) is up just 9.84% year to date and sits roughly 12% below its 52-week high of $287.20. Amazon just posted its fastest AWS growth in 18 quarters, its advertising business is compounding at 26%, and Wall Street analysts covering the stock have posted zero Sell ratings and zero Strong Sell ratings across 61 total analyst calls.
Yet Amazon is up just 9.84% year to date and sits roughly 12% below its 52-week high of $287.20. So here is the question I want to answer: can shares reach $425 by the end of 2027, and what has to go right to make that number stick?

Why Amazon Shares Are Stuck Despite an AWS Reacceleration
The disconnect is real. AMZN is down 1.92% over the past week and 3.47% over the past month, and the one-year return of 11.13% trails the broader tech sector badly.
The market is fixated on one number: capex. Amazon spent $54.208 billion on capital expenditures in Q2 alone, guided to roughly $200 billion in 2026 capex, and trailing free cash flow has swung to negative $7.6 billion.
With a beta of 1.443, the stock swings hard when investors question AI payback timing. Add the roughly 80 bps FX headwind flagged for Q3 and the noise from Anthropic-related non-operating gains inflating GAAP earnings, and you get a stock the market cannot quite trust.

Wall Street Sees 29% Upside. Our Model Sees More
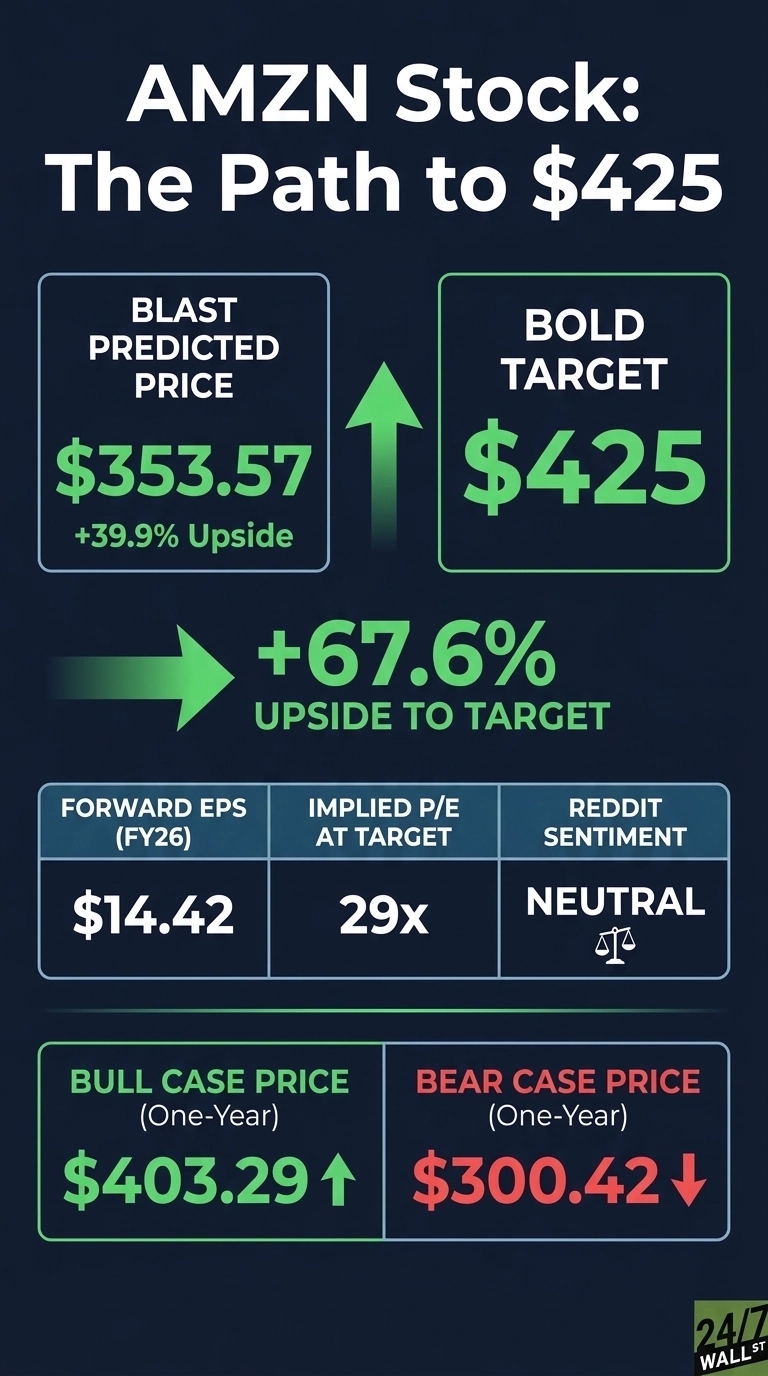
Consensus target price is $328.17, built from 15 Strong Buys, 44 Buys, 2 Holds, 0 Sells, and 0 Strong Sells. Our own base-case forecast is higher at $353.57, or 39.9% upside, with a bull case of $403.29 and a confidence score of 0.9. I think the sell-side is anchoring too heavily on near-term free cash flow rather than the operating income ramp.
Consider that 97% of analyst opinion is bullish and year-over-year earnings growth is running at 242.3%. When 97% agree on direction but the average target still implies less than 30% upside, someone is being too polite (we mapped the power, cooling, and networking suppliers benefiting from the same AWS buildout in a free report you can grab here).

Path to $425 Per Share
Reaching $425 from today’s price of $253.54 would require a gain of 67.6%. With forward EPS of $14.42, a price of $425 implies a forward P/E of 29x.
Our base case of $353.57 already implies roughly 20x, meaning the bold target requires about 9x of additional multiple expansion. That is a stretch, but it is a stretch with a story.
Forward EPS estimates for 2026 have moved from $8.66 ninety days ago to $12.57 today, with 48 upward revisions against 1 downward revision in the trailing 30 days.
CEO Andy Jassy told investors on the Q2 call that “AWS is now a $169 billion annualized revenue run rate business” with a backlog of $496 billion, growing triple digits year over year, and framed AWS as having the potential to become a trillion-dollar revenue business over time. AI and chips are each at $25 billion run rates.
The primary risk is that AI capex payback takes longer than the five- to six-year server life management implies.
Where Amazon Trades Today vs Its Earnings Power
At $253.54 against $14.42 in forward EPS, AMZN trades at roughly 18x forward earnings. That is cheaper than its 35x trailing multiple and, in my view, cheap for a business compounding operating income at 43.24% year over year.
Shares sit between a 52-week low of $196 and a high of $287.20, with a 10-year total return of 551.34% behind them. The valuation is arguably begging for expansion.

$425 Is a Stretch, But Here’s Why It’s Possible
Reaching $425 requires that 67.6% gain, and I will call it what it is: a stretch.
But three things make it plausible. AWS margins holding near 39.4% as capacity monetizes. The chip business scaling past $25 billion with Anthropic and OpenAI on multi-gigawatt Trainium commitments. Advertising continuing to compound in the mid-20s.
A capex spike that spooks investors would derail it fast. Returns at this level shouldn’t be expected every year, but we’ve outlined the blueprint for how Amazon could reach $425 in 2027.
Contact [email protected] for any questions or corrections.
Vandita Jadeja is a financial publisher with over a decade of experience writing about financial topics, including investment, savings, retirement, insurance and banking. Vandita is a Chartered Accountant who loves to debunk financial concepts for readers.
Her work has appeared on sites that include The Motley Fool, InvestorPlace, and Benzinga. She covers investing and focuses on stock picks and price prediction for 24/7 Wall St.
When not looking for the next stock investment opportunity, she can be found traveling, reading, chasing sunsets and enjoying her iced latte.