If You Invest $1,000 in Palantir Each Month Starting Now, This is What You’d Have in 5 Years
Palantir has already made some investors rich, but the next five years come with wildly different outcomes depending on which scenario plays out. Here is how a simple monthly plan stacks up against each one.

This post may contain links from our sponsors and affiliates, and Flywheel Publishing may receive compensation for actions taken through them.

If you put $1,000 a month into Palantir (NASDAQ:PLTR | PLTR Price Prediction) for the next five years, you will have contributed $60,000 of your own money by 2031. What that money could be worth depends on where the stock goes from its current $189.67.
Palantir starts this window with strength. Revenue grew 92.83% year over year in its most recent quarter, and management raised full-year guidance again.

What $1,000 a Month Could Grow Into by 2031
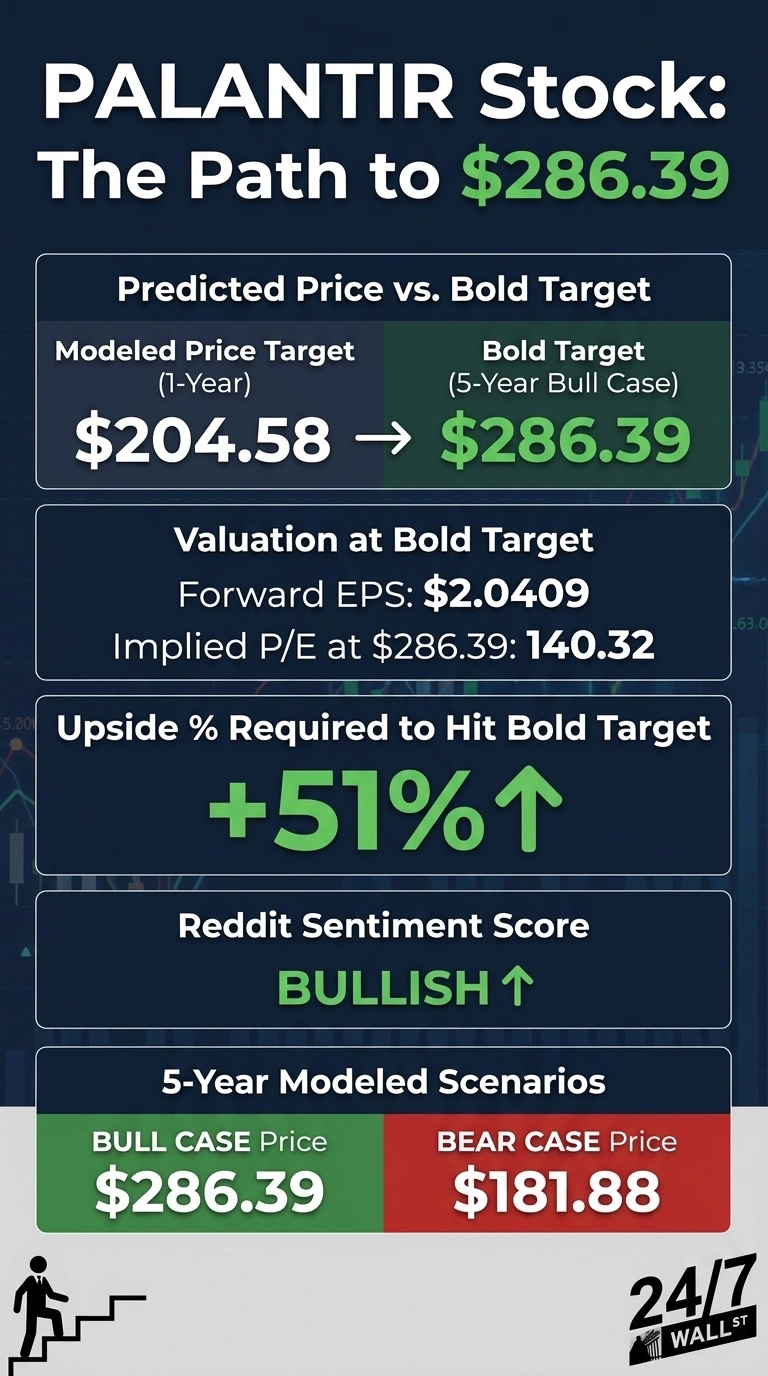
In the model’s five-year base case, shares reach $257.62 by September 26, 2031. That works out to a gain of 35.83% overall, or 6.32% per year. On that path, the first $1,000 you invest today could be worth about $1,358.30 by 2031.
The model only produces lump-sum targets, so any figure for the full monthly plan is illustrative. Here is one version. Invest $3,000 each quarter (the same as $1,000 a month) at the model’s quarterly base-case prices. You would build up roughly 271.9 shares.
At the $257.62 end point, those shares would be worth about $70,048.86, compared with $60,000 contributed. The plan makes a smaller percentage than a lump sum because later deposits have less time to grow.
Bull, Base and Bear Scenarios for Each $1,000
| Scenario | 2031 Target Price | Total Return | Annualized Return | Value of $1,000 |
|---|---|---|---|---|
| Bull | $286.39 | 51% | 8.59% | $1,510 |
| Base | $257.62 | 35.83% | 6.32% | $1,358.30 |
| Bear | $181.88 | -4.11% | -0.84% | $958.90 |
The model gives only end point prices for the bull and bear cases, with no quarterly path. That means the monthly-plan figure above applies only to the central scenario.
Analyst Consensus and Model Confidence
Over the next year, the model’s target is $204.58, which means 7.86% upside. Its one-year range runs from $171.93 at the low end to $220.13 at the high end. The model’s confidence score is 0.9, which it rates as high.
The analyst consensus target is $195.57. Of the analysts covering the stock, 1 rate it a strong buy, 20 recommend buying, 9 say hold, 1 say sell and 1 say strong sell.

Three Growth Drivers That Could Lift Your Returns
U.S. Commercial Hypergrowth
U.S. commercial revenue rose 149% year over year to $764 million. The U.S. commercial customer count climbed to 653, and net dollar retention reached 157%. That retention number means existing customers are spending much more each year.
Guidance Raised Again
Management now projects fiscal 2026 revenue of $8.15 billion to $8.158 billion, which would be 82% growth. It also projects adjusted free cash flow of $4.5 billion to $4.7 billion.
Earnings per share beat estimates in each of the last four quarters, most recently $0.41 against an estimate of $0.28.
AIP and AI Sovereignty
Management describes the core pitch as helping companies keep control of their own AI systems and data, which it calls AI sovereignty. CEO Alex Karp said on the earnings call: “Every single enterprise in this country is going to either look at doing this, find ways of doing it, or at least avoid the alternative of unprotected interaction with frontier models.”
Total remaining deal value reached $13.1 billion, up 83%. Finding a stock like this early is its own skill, and we reverse-engineered what past monster tech winners looked like before the runs in a free playbook here.
Risks That Could Push Your Stake Below Breakeven
Valuation is the biggest risk. The stock trades at a trailing P/E of 162, so even a small execution miss could lead to a sharp drop. Its beta of 1.621 means it tends to swing more than the market. It has done so recently, falling from $187.75 in December 2025 to $133.02 by February 2026.
Stock-based compensation reached $265 million last quarter, which reduces existing shareholders. The U.S. now accounts for over 81% of revenue, and some contracts allow customers to end for convenience.
Management also warned of “a significant ramp in expense in the third quarter.” Long sales cycles, changes in government spending and regulation of AI could all push results toward the low-end scenario of $958.90 per $1,000.
What to Watch Before You Invest Your First $1,000
Keep an eye on the stock around the third-quarter earnings report, where management has forecast to revenue of $2.16 billion to $2.164 billion. Across the model’s scenarios, each $1,000 invested today could be worth between $958.90 and $1,510 by 2031.
The illustrative monthly plan lands near $70,048.86 under the central scenario. These figures are estimates and do not guarantee future results.
Contact [email protected] for any questions or corrections.
Vandita Jadeja is a financial publisher with over a decade of experience writing about financial topics, including investment, savings, retirement, insurance and banking. Vandita is a Chartered Accountant who loves to debunk financial concepts for readers.
Her work has appeared on sites that include The Motley Fool, InvestorPlace, and Benzinga. She covers investing and focuses on stock picks and price prediction for 24/7 Wall St.
When not looking for the next stock investment opportunity, she can be found traveling, reading, chasing sunsets and enjoying her iced latte.