Tesla Beat on Deliveries. Why the Upside Case Is Only 9%
Tesla just posted a delivery beat that sent shares surging, yet the math behind the stock's valuation tells a far more complicated story about how much upside investors can actually expect.

Tesla (NASDAQ:TSLA | TSLA Price Prediction) shares rose today after third-quarter vehicle deliveries came in better than expected.
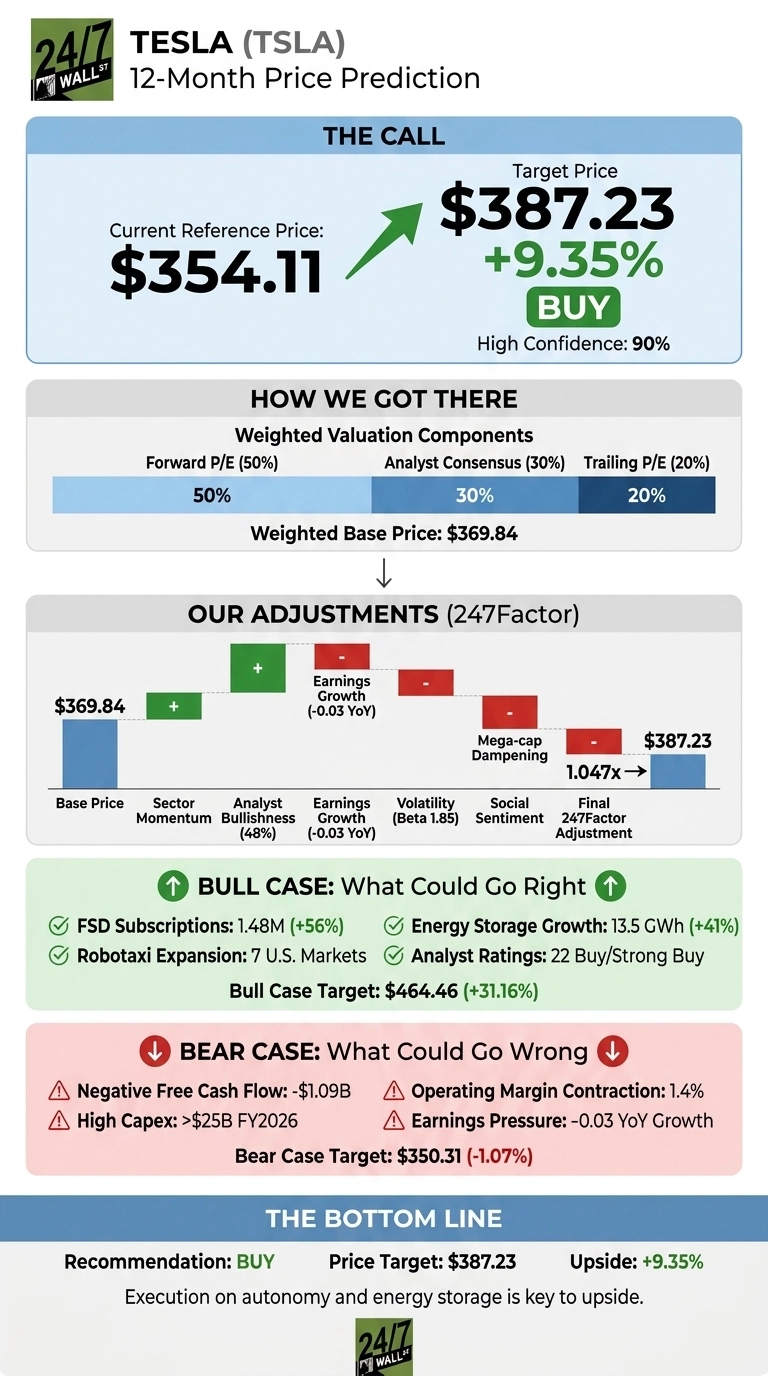
Our own model sets the 24/7 Wall St. price target at $387.23 over the next 12 months. That is 9.35% above the $354.11 reference price the model used. The model rates the stock a buy with high confidence.
| Metric | Value |
|---|---|
| Reference Price | $354.11 |
| 24/7 Wall St. Price Target | $387.23 |
| Upside | 9.35% |
| Model Rating | BUY |
| Confidence Level | 90% |

After today’s rally, shares are at $371.39 intraday, up 4.88% on the session, so the remaining gap to our target shrinks to about 4.3%. Tesla keeps executing on volume.
At 173x forward earnings, though, the stock needs margins to recover before it can earn a higher multiple. My confidence is high because the model’s inputs line up. The upside is small because the valuation already prices in much of the autonomy story.

Delivery Beat Meets Shrinking Margins in 2026
Tesla is down 17.42% year to date and 1.73% over the past week, but up 4.3% over the past month. The 52-week range runs from $297.38 to $498.83.
In the second quarter, revenue of $28.24 billion beat estimates by 7.1%. EPS of $0.33 missed expectations by 38.51%, and operating margin contracted to 1.4%. Also, Barron’s reported that the Roadster event has been delayed.

Why Bulls See $464 Within Reach
Our bull case reaches $464.46, a 31.16% gain. Active FSD subscriptions hit 1.48 million, up 56%. Robotaxi now runs in seven U.S. markets, and Elon Musk said miles driven are growing more than 10% a week.
Energy storage deployments rose 41% to 13.5 GWh, and Tesla ended Q2 with its “largest order backlog since 2023”. Among analysts, 22 rate the stock a Buy or Strong Buy.

Cash Burn Could Pin Tesla Near $350
The bear case places the stock at $350.31. Free cash flow was negative $1.09 billion, and management expects full-year capex of more than $25 billion. Net income also included a $1 billion mark-to-market gain on SpaceX.
On the other side, operating cash flow rose 84.92%, the cash drain reflects factories for Optimus, Cybercab and chips, and Tesla holds $43.52 billion in cash.
How Tesla Compares to GM and Rivian
General Motors (NYSE:GM) is the main traditional competitor in the U.S. market. It trades at 27x trailing earnings and 6.48 times free cash flow, and it raised its adjusted EPS guidance to $12 to $14.
Rivian (NASDAQ:RIVN) is pursuing robotaxis through Uber (NYSE:UBER) but still runs an operating margin of -66.5%.
| Company | Trailing P/E | Price/FCF | Price/Book |
|---|---|---|---|
| Tesla | 369x | 224.85 | 17.03 |
| GM | 27x | 6.48 | 1.17 |
| Rivian | Negative | Negative | 4.67 |
Tesla’s premium is extreme on every measure, so I view our target as reasonable. It assumes the current multiple holds and does not require it to expand.
Tesla Price Prediction 2026-2030
The 24/7 Wall St. price target of $387.23 has a buy rating at 90% confidence. Subscription-driven FSD growth is what tips the scale.
The setup looks stronger to me if Q3 margins improve on this delivery beat. I would grow more cautious if capex keeps free cash flow negative into 2027.
| Year | 24/7 Wall St. Price Target |
|---|---|
| 2026 | $360.97 |
| 2027 | $391.82 |
| 2028 | $409.36 |
| 2029 | $459.08 |
| 2030 | $491.56 |
These projections assume Tesla keeps executing on its current strategy. Robotaxi scaling could drove results well above them, and sliding Optimus timelines could pull them below.
Contact [email protected] for any questions or corrections.
Vandita Jadeja is a financial publisher with over a decade of experience writing about financial topics, including investment, savings, retirement, insurance and banking. Vandita is a Chartered Accountant who loves to debunk financial concepts for readers.
Her work has appeared on sites that include The Motley Fool, InvestorPlace, and Benzinga. She covers investing and focuses on stock picks and price prediction for 24/7 Wall St.
When not looking for the next stock investment opportunity, she can be found traveling, reading, chasing sunsets and enjoying her iced latte.