Home Depot Is Down 15% This Year. Here’s The Price Where I’d Start Buying.
Home Depot has shed a quarter of its value in a year, and the temptation to buy the dip is real. But there is one specific price level, built from dividend math rather than gut instinct, that separates a disciplined…

This post may contain links from our sponsors and affiliates, and Flywheel Publishing may receive compensation for actions taken through them.
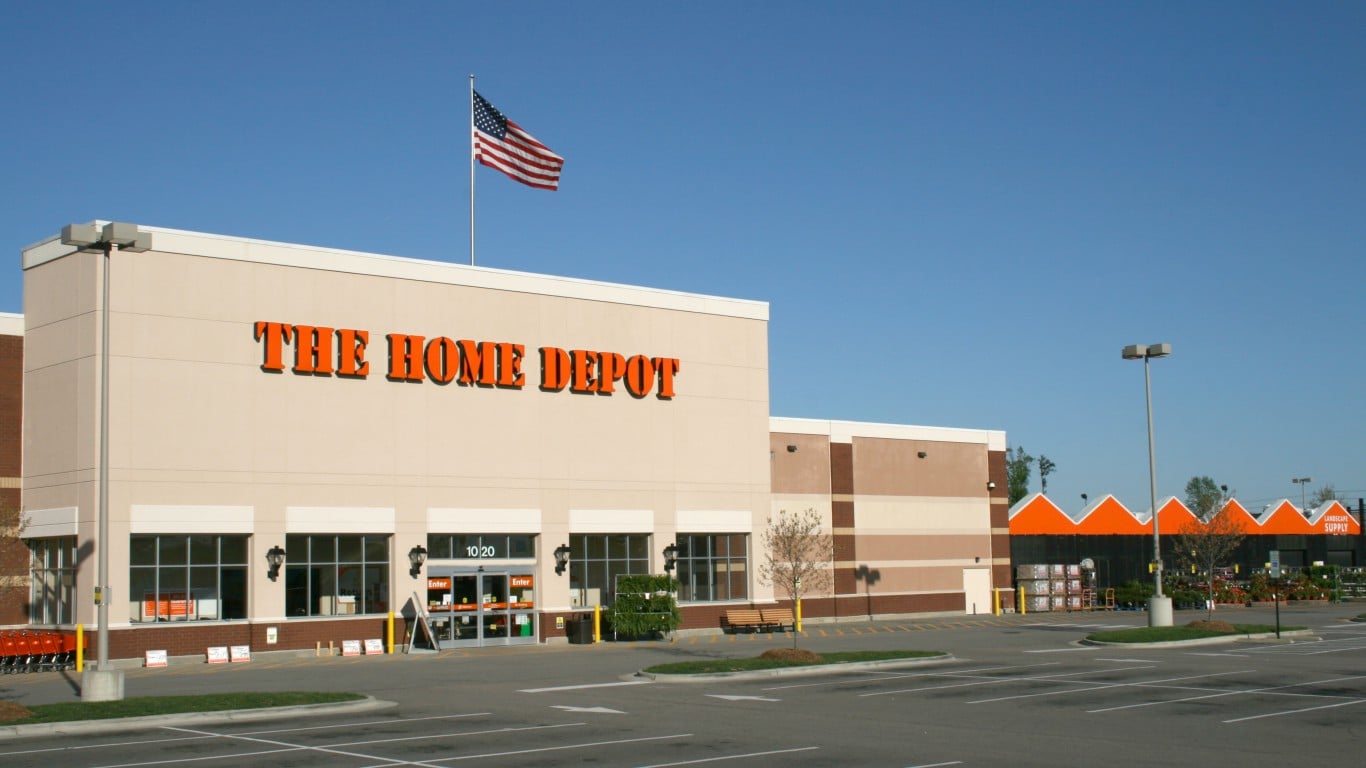
Shares of Home Depot (NYSE:HD | HD Price Prediction) traded at $285.10 as of 10:01 AM ET on October 7, 2026, down 0.55% in Wednesday’s session. The stock has fallen 15.33% year to date and 24.68% over the past twelve months. Most of the damage is recent. Shares are down 11.2% over the past month.
Home Depot is still a large, functioning business. It operates 2,364 retail stores and over 1,340 SRS Distribution locations, and it employs over 470,000 associates. It’s a component of the Dow Jones Industrial Average, with a market capitalization of $284.4 billion and a trailing price to earnings ratio of 20.

A decline this large in a business like this warrants a closer look at valuation.
Why Waiting for the Bear Case Fails
The obvious move is to wait for the bear case. Our price prediction model puts Home Depot’s conservative one-year price at $318.93, base case at $348.72, and bull case at $395.02. Analyst consensus is $377.19.
All estimates exceed today’s price. The model implies 22.75% upside.

The data shows no bearish scenario because the entire range sits above the current price. Even the model’s bear case sits above today’s price.

52-Week Low Sits Too Close to Matter
The 52-week low of $277.15 is a attractive line. The 52-week high is $389.18. Revisiting that low takes a decline of just 2.8% from here.
That margin is too thin. A past low shows only where selling stopped once. I need a threshold based on intrinsic value.
Dividend Yield Anchor Behind My Number
Dividend yield is a reasonable anchor. It pays regardless of multiple compression.
Home Depot’s current dividend yield is 3.2%, implying an annual payout of $9.12 per share at today’s price.
If that payout stays the same, the ladder looks like this:
| Target Yield | Share Price |
|---|---|
| 3.5% | $260.60 |
| 3.75% | $243.23 |
| 4% | $228.03 |
A 3.75% yield corresponds to a share price of $243.23. Getting there takes a 14.7% decline from here.
The 3.5% level is close enough to today that it asks for little patience. A 4% yield on a company of this quality would likely mean something had genuinely gone wrong. The middle tier asks for a real discount without needing a disaster, the same income-ladder logic we laid out in a free guide to building a dividend ladder you never have to sell out of.
I set the yield target first, then calculated price. Reversing that logic kills the method.
Caveats That Could Break the Math
- The $9.12 payout is approximate, derived from a price and yield reading.
- This assumes the dividend holds. A cut voids the level; a raise requires recalculation.
- A lower price reflects market view. The threshold signals when to review before acting.
Discipline Matters More Than the Stock
A written threshold set in calm conditions removes emotion from the next decision. The reassessment level is $243.23, making the next review mechanical.
Contact [email protected] for any questions or corrections.
I've spent more than 15 years inside enterprise software, working alongside the finance, sales operations, and HR leaders who run the revenue engines at some of the largest tech companies in the country.
My day job is helping enterprise executives make smarter decisions about retention, compensation, and growth. These are the same operational levers that show up in every earnings report investors actually read. That perspective shapes my writing for 24/7 Wall St.
The headline numbers are easy. The interesting stuff is underneath: how companies make money, what executives are worried about, and what any of it means for the person checking their 401(k) on a Sunday afternoon. I write about personal finance and business as someone who has spent her career inside the rooms where these decisions get made.