When Dividends Cost More Than Earnings: 6 Stocks in Danger
Some of the most recognizable dividend stocks in the market have been paying shareholders with money they do not actually earn, and the accounting trail reveals exactly how far six of them have pushed that math.

This post may contain links from our sponsors and affiliates, and Flywheel Publishing may receive compensation for actions taken through them.
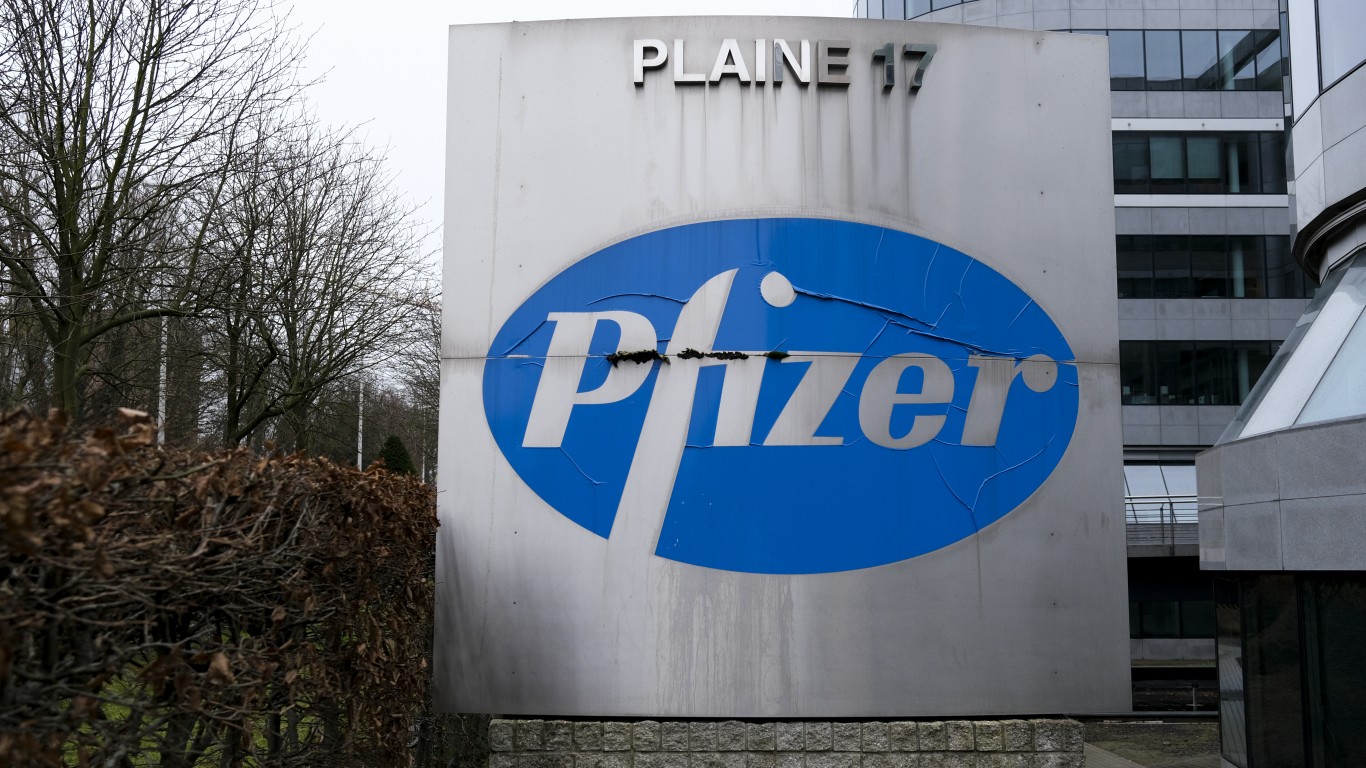
Pfizer (NYSE:PFE | PFE Price Prediction) paid $9.771 billion in dividends in 2025 and earned net income of $7.746 billion. That was the third straight year the payout ran ahead of profit. When this repeats year after year, it is company policy. A high yield lasts only as long as the cash behind it does.
How to Run the Three-Line Check Yourself
Open the cash flow statement and compare three lines: cash from operations, dividends paid, and net borrowing in the financing section. If dividends beat operating cash minus capital spending for several years while debt climbs, the company is borrowing to pay owners. For a REIT, use AFFO (adjusted funds from operations). For a partnership, use distributable cash and net asset value.
Icahn Enterprises (IEP): A 30% Yield Built on Years of Losses
Icahn Enterprises (NASDAQ:IEP) pays $0.50 per unit quarterly. At $6.67, that yields near 30%. Units have fallen 65.56% over five years.
Net income was negative every year from 2021 through 2025, ranging from $604 million in 2021 to $293 million in 2025. In 2025, operating cash flow was -$313 million while distributions totaled $288 million. In Q2 2026, net asset value dropped $765 million to about $2.60 billion. Total liabilities stand at $10.74 billion against equity of $1.01 billion. The quarterly payout has been cut from $2.00 to $1.00 to $0.50.
For the payout to hold, the pending $700 million Pep Boys sale needs to close and the hedge book needs to stop losing money. Hedges cost $243 million in the second quarter.
BCE (BCE): Three Straight Years of Shortfalls Before the Reset
BCE (NYSE:BCE) declared a quarterly dividend of $0.315, yielding about 6.38% at $19.74. The stock is down 44.7% over five years.
BCE failed the check three years running. Operating cash minus capital spending came to C$3.229 billion, C$3.182 billion and C$2.56 billion from 2022 through 2024. Dividends in those years were C$3.448 billion, C$3.668 billion and C$3.8 billion. Net income in 2024 was only C$344 million. Interest expense climbed to C$1.775 billion in 2025 from C$1.516 billion in 2023. In 2025 the payment dropped from 0.718 to 0.319.
After that reset, 2025 operating cash of C$6.993 billion covered capital spending of C$3.7 billion and dividends of C$2.177 billion. Risk comes from new spending: BCE plans $1.7 billion in extra capital for an AI data centre, funded with debt and cash, on top of $42.38 billion in liabilities against $17.37 billion of equity.
Dow (DOW): Half the Dividend, Still Short of the Cash
Dow (NYSE:DOW) pays $0.35 quarterly, about 4.92% at $28.43. The company halved the payout from $0.70.
In 2024, operating cash minus capital spending came to -$151 million before Dow paid $1.966 billion in dividends. In 2025, operating cash of $1.032 billion did not cover $1.49 billion in dividends, and the company lost $2.623 billion. Net interest expense grew to $713 million from $611 million.
Q2 2026 brought relief. Free cash flow was $692 million and adjusted EPS of $1.44 beat the $1.28 estimate, driven by a 30% rise in polyethylene prices. To keep the payout safe, those prices must hold and Dow must deliver more than $1.30 billion in savings from its Transform to Outperform cost program.
Pfizer (PFE): Three Years of Dividends Above Net Income
Pfizer yields 6.25%. Its quarterly dividend rose from $0.39 in 2021 to $0.43, a steady record that attracts income investors.
In 2023, operating cash of $8.7 billion was not enough to cover $9.247 billion in dividends. In 2025, operating cash minus capital spending was $9.076 billion, still short of the payout. In Q2 2026, operating cash of $835 million covered only part of the $2.451 billion paid out, and the quarter ended with a $238 million net loss. Net debt stands at 3.26 times EBITDA and return on invested capital is -1.29%.
Pfizer reaffirmed adjusted EPS guidance of $2.80 to $3.00 and the Vyndamax settlement extends U.S. exclusivity into 2031. Generic and biosimilar competition is expected to cut about $1.5 billion from revenue.
Western Union (WU): A 15% Yield on Thinning Cash
Western Union (NYSE:WU) pays $0.235 quarterly, about 15.38% at $6.11. Shares have slid 54.53% over five years.
Operating cash fell below the dividend in Q2 2024 (-$33.8 million against $81.8 million) and again a year later (-$0.3 million against $76.8 million). In both quarters of 2026, operating cash minus capital spending ($62.2 million and $63.5 million) was not enough to cover dividends of $79.4 million and $73.4 million. Liabilities total $7.05 billion against equity of $914.7 million. Adjusted EPS of $0.31 missed the $0.42 estimate.
Management guided to full-year adjusted EPS of $1.25 to $1.35, assuming the Intermex deal closes on schedule. CEO Devin McGranahan said the company must “accelerate cost reductions more forcefully.”
Omega Healthcare Investors (OHI): Covered on AFFO, With Little Room to Spare
Omega Healthcare Investors (NYSE:OHI) raised its quarterly dividend to $0.68, about 6% at $45.36. Shares are up 126.98% over five years.
Operating cash was not enough to cover dividends in 2022 ($625.7 million against $632.9 million) and 2023 ($626.5 million against $643.9 million). For a REIT, AFFO is the right yardstick. The dividend uses about 84% of AFFO guidance midpoint of $3.22 to $3.26. That margin is thin. Genesis Healthcare, still in Chapter 11, owes Omega $148.5 million and some portfolios cover rent only 0.87x. Operating cash of $878.6 million in 2025 covered dividends of $780.4 million.
Yield Alone Is Never a Thesis
A dividend cut usually drags shares down, so income investors lose both the payout and principal. Before trusting any yield, run the three-line check across several years of statements. If borrowing keeps the payout going, the business is falling short of earning it. (We cataloged seven warning signs that a big yield is about to be cut in a free report here, and most of the names above triggered more than one of them.)
Contact [email protected] for any questions or corrections.
Chris Lange is a financial and geopolitical writer with more than a decade of experience covering a myriad of topics. He has published thousands of articles for 24/7 Wall St., with past coverage focused heavily on stocks, IPOs, healthcare, defense, global affairs, and technology.
His work has been quoted, or referenced by a number of outlets including Business Insider, USA Today, Yahoo Finance, MSN, The Motley Fool, and many other publications. A graduate of Southwestern University, he studied business with a focus on investments and has previous experience in banking and startups.
When not reading or writing the news, he is following his passion for Lacrosse, playing chess, or building solar projects with his dad.