Prediction: AI Could Transform This Magnificent 7 Stock Over the Next 3 Years
Google's AI spending has pushed free cash flow into negative territory, yet Wall Street sits nearly unanimous in its bullishness. Whether that conviction is justified depends on three things going right at once.

It was a strong quarter for Google (NASDAQ:GOOG | GOOG Price Prediction). Revenue hit $119.80B, up 24.2%, and Google Cloud grew 82% to $24.77B.
Sundar Pichai called it “an amazing quarter”. Even so, shares are up just 12.03% year to date at $347.86, almost exactly where they stood after that report ($348.10). Can Google hit $500 by 2029?

What’s Holding Google Back Right Now
The problem is cash. Capex jumped 100% to $44.92B, and free cash flow came in at -$5.86B. The company’s long-term debt rose from $46.5B to $98.2B, and the buyback was suspended in Q2 2026. Net income of $112.11B was also inflated by a $99.03B gain on equity securities, so the market discounts that headline.
That explains why shares sit 13.9% below their 52-week high of $403.96. They are rebounding, up 3.09% in a week and 6.84% in a month. A beta of 1.211 means the moves run a bit wider than the market’s.
Wall Street Sees 20.8% Upside. Our Model Says 26%
The consensus target is $420.36, meaning 20.8% upside. Of 62 analysts, 13 rate it a strong buy, 44 a buy, 5 a hold and 0 a sell. The base case is $438.32, or 26.01% upside, with a range from $371.66 to $455.71. Model confidence is 0.7, which is solid without being certain.

The Street seems too conservative. 92% of analysts are bullish, and earnings growth adds 0.03 to our factor. Cloud backlog reached $514 billion, and just over 50% of it should convert to revenue within 24 months.
Here’s What It Takes for Google to Reach $500
Reaching $500 from today’s price of $347.86 would require a gain of 43.7%.
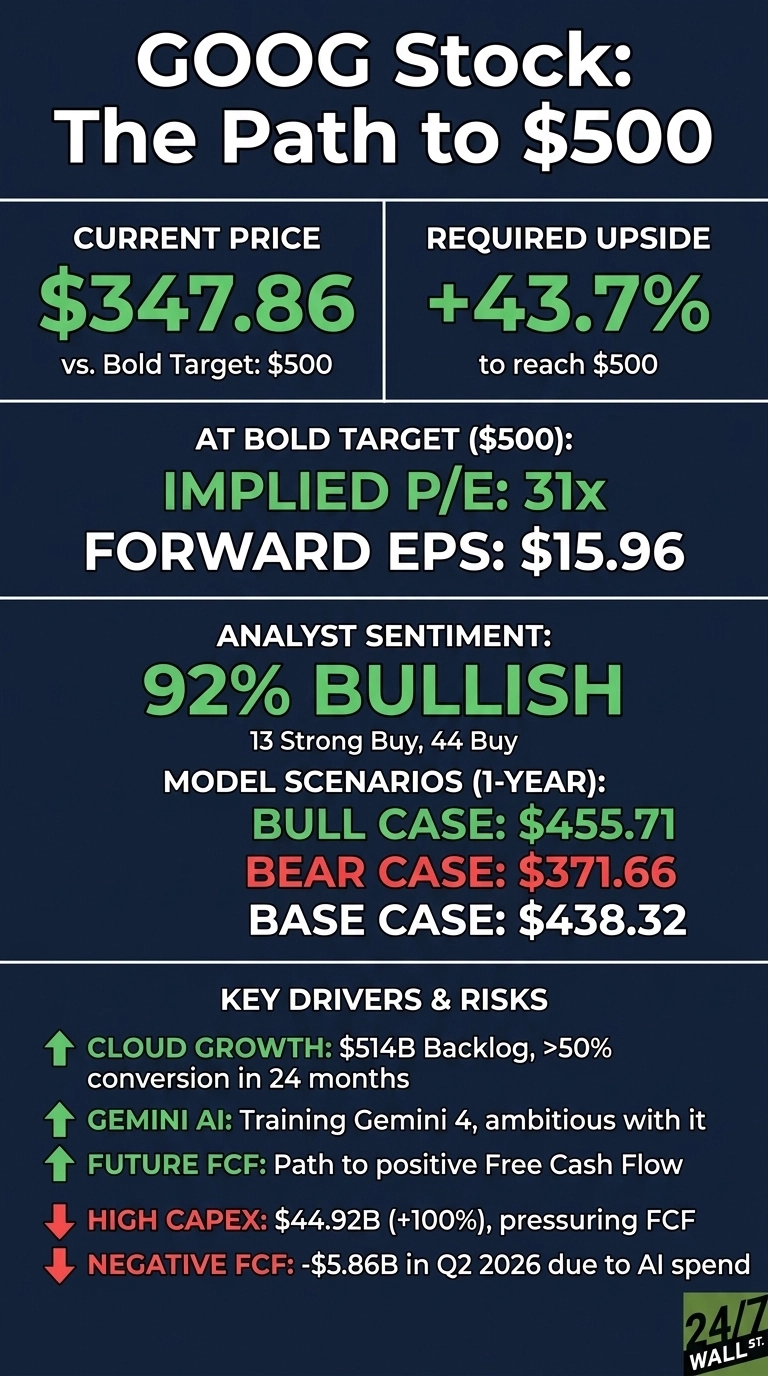
A forward P/E of 22 meaning forward EPS of $15.96. At $500, that works out to a forward P/E of 31x. The base case of $438.32 already meaning 27x, so the bold target needs about 4 more turns of multiple expansion.

That looks achievable. Our adjustment factor of 1.12 is driven by a sector multiplier of 1.08 and a 0.055 analyst-consensus contribution. As TPU system revenue arrives in 2027, forward EPS should rise, and today’s multiple would contract. Barron’s reports that Google Workspace now has AI agents. Pichai also said: “We are now training Gemini 4, and we’ve been very ambitious with it.”
Capex growing faster than revenue would keep free cash flow negative. The flip side is that all that AI spending has to be powered, cooled, and networked by somebody, and we rounded up seven of those non-chipmaker suppliers in a free report.
Where Google Trades Today vs Its Earnings Power
At about 22x forward earnings and a PEG of 1.197, Google looks reasonably priced for a company with 12 straight quarters of double-digit revenue growth.
Shares trade between the 52-week low of $240.12 and the high of $403.96. The stock has gained 804.63% over 10 years. Our five-year path puts the stock at $573.02 in October 2029.
$500 Is a Stretch, But Here’s Why It’s Possible
Hitting $500 calls for a 43.7% gain. That’s ambitious, but within reach.
Three things need to happen. Cloud backlog has to convert on schedule, Gemini 4 has to keep Google at the frontier, and free cash flow has to turn positive again. A extended capex bout without matching revenue would wreck it. We wouldn’t expect returns like this every year, but we’ve outlined the path for how Google could reach $500 in 2029.
Contact [email protected] for any questions or corrections.
Vandita Jadeja is a financial publisher with over a decade of experience writing about financial topics, including investment, savings, retirement, insurance and banking. Vandita is a Chartered Accountant who loves to debunk financial concepts for readers.
Her work has appeared on sites that include The Motley Fool, InvestorPlace, and Benzinga. She covers investing and focuses on stock picks and price prediction for 24/7 Wall St.
When not looking for the next stock investment opportunity, she can be found traveling, reading, chasing sunsets and enjoying her iced latte.