Chip Stocks Just Fell 8 Days in a Row, Their Longest Losing Streak Since 2008
Semiconductor stocks just logged their longest losing streak in nearly two decades, and the cause this time has nothing to do with a credit crisis. What is actually driving the selloff puts every link in the chip supply chain at…


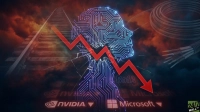
The Philadelphia semiconductor index fell 3.8% on October 16, 2026, its eighth straight losing session and its longest run since 2008. The Nasdaq 100 fell 2.5% on the same date, and tech stocks lost more than a trillion dollars in value.
The iShares Semiconductor ETF (NASDAQ:SOXX) tracks a similar index. It fell 4.14% to $493.39. It closed at $589.45 on October 6, so it is now down about 16% since then and sits about 25% below its 52-week high of $655.95. The fund is still up 64.12% for 2026, so the selloff likely reflects investors repricing the AI spending cycle and unwinding popular positions.
Equipment Makers Fell With Chip Designers
Advanced Micro Devices (NASDAQ:AMD | AMD Price Prediction) fell 5.95%. Intel lost 5.79%, Micron Technology (NASDAQ:MU) 5.63%, Marvell Technology 5.56% and Broadcom (NASDAQ:AVGO) 4.52%. Three chip equipment makers also fell. KLA (NASDAQ:KLAC) dropped 5.00%, Lam Research (NASDAQ:LRCX) 4.87% and Applied Materials (NASDAQ:AMAT) 4.82%.
Nvidia (NASDAQ:NVDA) slid only 1.43%. Chip designers, memory makers and equipment makers all fell on the same day, which suggests investors doubt the spending cycle that pays all of them.
Why This Streak Looks Little Like 2008
The 2008 run happened during a credit crisis. This one was driven by oil, interest rates, and doubts about whether AI spending will pay off, and different causes tend to bring different rebounds.
West Texas crude reached $101.91 a barrel on October 14, and the 10-year Treasury yield was 5.10% on October 15. Expensive oil pushes up inflation. That raises the odds of another Federal Reserve rate increase, which hurts high-priced growth stocks.
The VIX, which measures how much volatility traders expect, was at 16.46 on October 15. It sits below the 20 level that signals high fear. The selling looks orderly, driven by investors following the trend, and a losing run by itself says little about the companies’ businesses.
Capital Spending Math Hits Equipment Makers First
Bank of America analyst Sebastian Raedler said consensus forecasts for capital spending by hyperscalers (the largest cloud operators) have tripled, from $330 billion in early 2025 to $1 trillion. He warned that “most major capital cycles of the past have ended in disappointment, even though the underlying technology often lived up to expectations.”
Equipment makers are the most exposed part of the chain because chipmakers can quickly delay building new factories when their own customers slow orders. After forecasts have tripled, any slowdown reaches every supplier at once (we analyzed seven of the AI-boom suppliers outside the chipmakers, from power to cooling to networking, in a free report you can grab here).
Nvidia CEO Jensen Huang said, “All of this is going to pass.” His company has the most revenue tied to that spending, so he has a stake in that view.
Why AMD Fell Harder Than Nvidia
AMD fell 18.58% from its October 6 close to its October 16 close of $528.75. The stock trades at 199 times trailing earnings and carries a $863.17 billion market value, so investors have little patience for delays.
AMD guided to about $13 billion in third-quarter revenue. Anthropic plans to deploy up to 2 gigawatts of AMD’s MI450-series GPUs, with the first gigawatt starting in the first half of 2027. Those commitments play out over years, yet the stock is still up 146.89% for 2026.

How SOXX Compares With Owning AMD Outright
SOXX offers broader exposure. It spreads risk across chip designers, equipment makers, and memory producers for a 0.33% expense ratio (its annual fee). AMD puts that risk on a single product: Helios, its AI server rack, which was scheduled to begin shipping in the third quarter.
Stock prices already reflect a spending slowdown that the largest buyers have yet to confirm in their earnings reports, and that gap favors the diversified fund. AMD carries bigger price moves, because its upside depends on Helios shipping on time.
Check the next round of hyperscaler earnings reports. If their capital spending plans hold and SOXX closes back above $589.45, this call is right. If they cut those plans, it is wrong.
Contact [email protected] for any questions or corrections.
Omor Ibne Ehsan is a writer at 24/7 Wall St. He is a self-taught investor with a focus on growth, cyclical, and dividend equities that have strong fundamentals, value, and long-term potential. He also has an interest in high-risk, high-reward investments such as penny stocks.