‘The Major Ones All End Badly’: Pulitzer-Winning Crash Historian on US Stocks at 250% of GDP
A Pulitzer Prize-winning historian of financial crashes sees a familiar pattern forming in today's AI boom, and he says the same mechanism that buried railroads in 1873 and dot-coms in 2000 is already flashing in Treasury data right now.


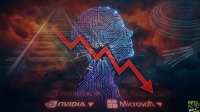
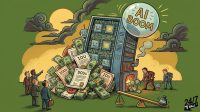
The AI boom has pushed American stocks to valuations few living investors have seen. Meanwhile, one of Wall Street’s most respected financial historians argues that the money pouring in is itself the warning sign. Liaquat Ahamed, Pulitzer Prize-winning author of Lords of Finance, reportedly says “a trillion dollars has come into the US equity market from foreigners” over the past 12 months and that “the US equity market is 250% of GDP,” a figure that includes private equity. But the size of that number concerns him less than what tends to follow it. In his account, booms die when the rush of capital drives interest rates higher, and “the major ones all end badly.”
A Rate Signal Already Flashing in Treasury Data
Ahamed traces the pattern throughout historic market cycles: the 1870s, 1880s, 1920s, 1999-2000, and 2008. In each case, a boom drew in capital until demand for money raised its price, and higher borrowing costs then sank projects that only worked with cheap financing. He says “real interest rates have gone up by 150 basis points in the last 12 months” and calls the move “a global phenomenon” as governments borrow heavily.
Treasury data supports his reading. The 10-year Treasury yield reached 5.19% on October 14, 2026, up 1.16 points year over year. That same day, the 10-year TIPS real yield stood at 2.84%, compared with 1.73% a year ago. Yields have eased a little since then, with the 10-year at 5.09% and the real yield at 2.74% on October 16. Long-term money is still expensive, with the 30-year real yield at 3.16%.
Railroads of 1873 Mirror Today’s Data Center Buildout
For his historical comparison, Ahamed points to the railroad mania of the 1800s. In the US, 5% of GDP went into railroad construction, which he puts at “one and a half trillion dollars” in today’s terms, roughly what is now being spent on AI infrastructure. About 80% of that construction was financed with bonds, and “by 1872, only one in five railroads was paying a dividend,” he noted. Then a geopolitical shock shut capital markets in 1873, and the boom collapsed.
The modern version is larger and moving faster. On NVIDIA’s (NASDAQ:NVDA | NVDA Price Prediction) August earnings call, CFO Colette Kress said capital spending by the top five hyperscalers “is expected to reach nearly 800 billion in 2026 and 1.3 trillion in 2027.” She cautioned that the leading AI labs “are growing faster than what their balance sheets and credit profiles can support.” NVIDIA has invested “nearly 50 billion in the Frontier AI Labs,” and Kress addressed the criticism directly: “We know some will call this circular financing. We see it differently.” Ahamed describes that kind of arrangement as “a hidden form of borrowing” that is “great on the way up and it’s terrible on the way down.”

NVIDIA’s $5.17 Trillion Sits at the Center of the Risk
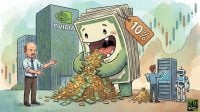
No single company better represents the 250% figure than Nvidia, boasting a market cap of $5.2 trillion. Fiscal second-quarter revenue rose to $96.22 billion, up 105.8% year over year, and Data Center revenue reached $89.02 billion. The most telling figure is in the quarterly filing: supply obligations climbed to $279.00 billion, mostly for memory used in Vera Rubin production. Commitments that large assume demand stays strong even if borrowing costs keep rising.

Valuation focuses the rate argument. At about 43 times earnings and 53 times free cash flow, NVIDIA’s valuation works out to an earnings yield of 2.32%. A 10-year Treasury pays 5.09% with no business risk at all. That gap is the pressure Ahamed describes: as safe yields rise, investors need more conviction to own stocks priced well above their current earnings.
The stock has started to wobble. Shares fell 4.84% over the past week to $218.19, though they remain up 17.27% year to date. Ahamed admits that timing is “the giant challenge,” and he notes that earlier infrastructure booms lasted “two to four years.” Skeptics can be early for a long time before they are proven right, and that is why we wrote a free handbook on riding a mania while planning the exit.

Calm Volatility Can Change Quickly
For now, fear is silent. The VIX, which measures expected volatility in the benchmark S&P 500, stands at 17.65, inside its normal range. That gauge was at 31.05 on March 27, 2026, a reminder of how fast sentiment can flip.
Jim Cramer has been preparing viewers for that kind of shift. On his July 20 broadcast, the CNBC commentator asked whether a “sudden AI stock sell off” was “just a blip or something you should seriously worry about.” He has told investors that only cash and diversification protect portfolios as AI data-center stocks sell off.
Ahamed’s warning gives investors something specific to track. I’m watching the 10-year yield and the TIPS real yield more closely than any AI headline, because history suggests rates are what end booms. His own advice is direct: “Don’t get caught up in the heat of the moment. Think for yourself.” Readers who have followed our earlier coverage of the Buffett Indicator will recognize the setup.
Contact [email protected] for any questions or corrections.
Gerelyn Terzo is the author of dividend investing handbook "Dividend Investing Strategies: How to Have Your Cake & Eat It Too." A veteran financial journalist, she covers agri-finance for outlets like Global AgInvesting and the broader stock market and personal finance for 24/7 Wall Street. She began at CNBC and later helped launch Fox Business in New York. Gerelyn currently resides in Woodland Park, Colorado and dabbles in nature photography as a hobby.