Amazon Just Delivered a Record-Breaking Quarter. But There’s One Number Investors Shouldn’t Ignore.
Amazon just posted its highest operating margin ever, yet the stock tanked in premarket trading. The reason comes down to one number buried in the cash flow statement that has investors questioning whether the growth story holds up.

This post may contain links from our sponsors and affiliates, and Flywheel Publishing may receive compensation for actions taken through them.
Fresh results from Amazon (NASDAQ:AMZN | AMZN Price Prediction) show an operating margin of 13.9%, the highest in its history. Even so, the stock was down 6.72% in Friday premarket trading at $227.40.
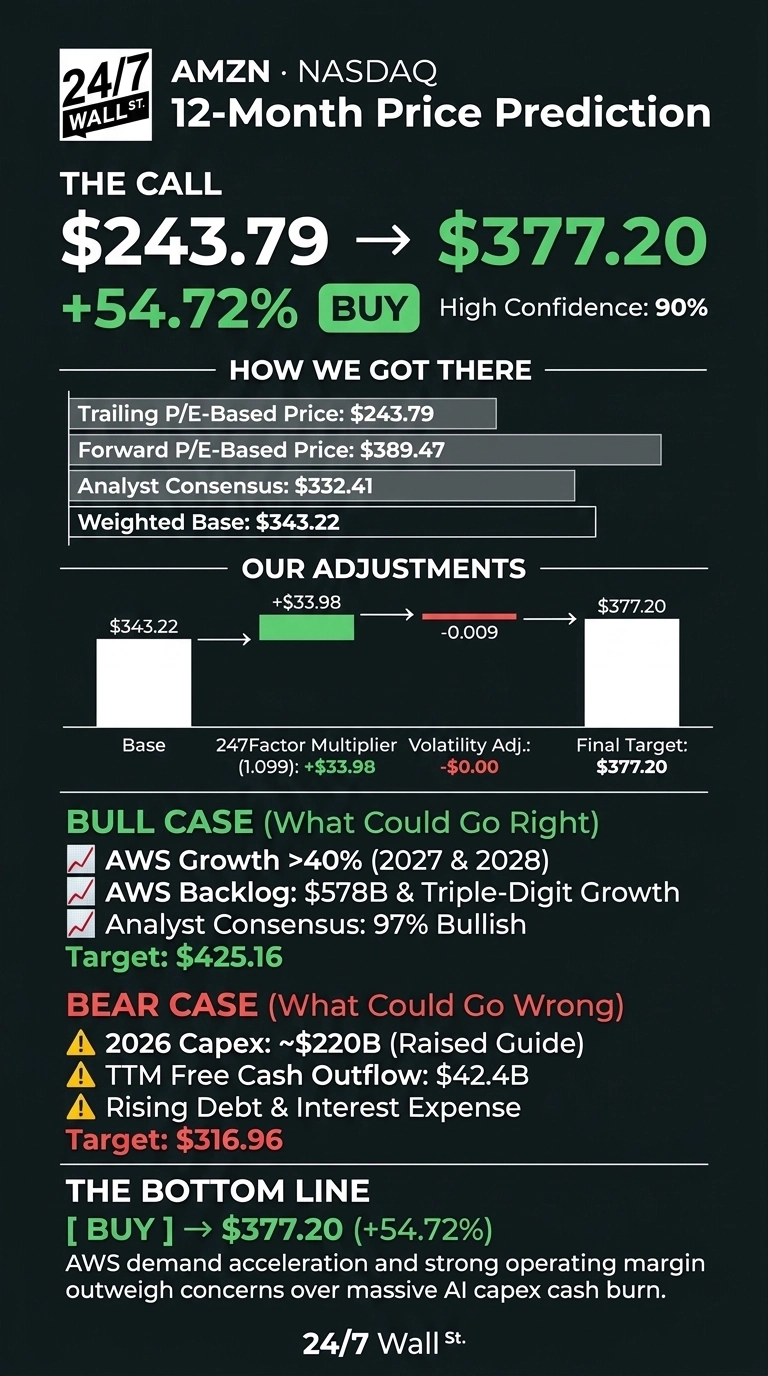
The number investors keep coming back to is a trailing 12-month free cash outflow of $42.4 billion, driven by AI infrastructure spending. Amazon’s 24/7 Wall St. price target sits at $377.20. That means 54.72% upside from Thursday’s close and 65.9% from the premarket level.

24/7 Wall St. Price Target Summary
| Metric | Value |
|---|---|
| Current Price (Oct. 29 Close) | $243.79 |
| Price Target from 24/7 Wall St. | $377.20 |
| Upside/Downside | 54.72% |
| Recommendation | BUY |
| Confidence Level | 90% |
That is a high-conviction rating. The selloff reflects concerns about cash flow, while AWS demand looks as strong as it has in years.
AWS Speeds Up as Shares Slide
Amazon shares are down 9.18% over the past week and 7.81% over the past month, and they are 1.48% lower year to date. The 52-week range runs from $196 to $287.20. CNBC reported that the stock fell in premarket trading as pressure mounted after earnings.
Third-quarter revenue came in at $201.94 billion, up 12.1% and slightly short of the $202.20 billion estimate. GAAP EPS of $1.89 missed consensus of $1.9579. Operating income, however, rose 61.2% to $28.08 billion.
AWS revenue grew 39% to $45.98 billion, its fastest pace in nearly five years. Capex reached $77.26 billion in the quarter, and full-year 2026 guidance went up to about $220 billion from $200 billion.
Why Bulls See $425 Within Reach
The upside scenario reaches $425.16. The AWS backlog stands at $578 billion and is growing triple digits, while Bedrock token volume is up nearly 17 times. Management expects AWS to grow more than 40% in both 2027 and 2028. Q4 operating income guidance of $28.5 billion to $33.5 billion compares with $25 billion a year ago.
Wall Street agrees. Analysts count 16 Strong Buys, 43 Buys and zero Sells, with a consensus target of $332.41. CEO Andy Jassy said, “There has never been a trillion dollar revenue business, and we may have two of them in the next 5-10 years.”

Cash Burn Is the Risk Worth Watching
The downside scenario lands at $316.96. Management plans to spend “meaningfully more in 2027,” and debt and interest expense are both rising. CFO Brian Olsavsky also said, “We are not guiding at all on our margin for AWS.”
Fuel and line-haul inflation will be higher in Q4. The capex has to be powered, cooled, and connected by somebody, and we rounded up seven suppliers riding that expansion in a free AI infrastructure report.
Operating cash flow also rose 19.4% to $42.42 billion, and management says AWS payback periods keep getting shorter. That suggests the outflow is investment spending, with the core business still generating cash.
How Amazon Compares to Microsoft and Alphabet
AWS’s closest cloud rival is Microsoft (NASDAQ:MSFT). With Azure up 48%, Microsoft trades at a lower trailing multiple with a far higher operating margin.
Also spending heavily on AI is Alphabet (NASDAQ:GOOGL), which posted free cash flow of -$9.065 billion. Its low P/E reflects earnings inflated by equity gains, including a $99 billion gain in Q2.
| Company | Trailing P/E | Operating Margin | Cloud Growth |
|---|---|---|---|
| Amazon | 34x | 11.16% | 39% |
| Microsoft | 29x | 46.78% | 48% |
| Alphabet | 13x | 32.06% | 103% |
Our target is based on a forward P/E of 24. Measured against these peers, it looks reasonable.

AWS Acceleration Tips the Scale
The 24/7 Wall St. price target is $377.20, with a buy rating and 90% confidence.
The bull case strengthens if AWS keeps growing faster than 40% and the backlog turns into revenue. The bear case gains weight if 2027 capex rises while AWS margins slip. On balance, AWS demand outweighs the cash burn.
These are the model’s base-case estimates, assuming Amazon’s current growth path holds.
| Year | Price Target from 24/7 Wall St. |
|---|---|
| 2026 | $258.08 |
| 2027 | $377.20 |
| 2028 | $518.19 |
| 2029 | $628.11 |
| 2030 | $736.52 |
These estimates depend on Amazon continuing to execute. A sustained AI capex return could push the stock higher, and extended negative free cash flow could pull it lower.
Contact [email protected] for any questions or corrections.
Vandita Jadeja is a financial publisher with over a decade of experience writing about financial topics, including investment, savings, retirement, insurance and banking. Vandita is a Chartered Accountant who loves to debunk financial concepts for readers.
Her work has appeared on sites that include The Motley Fool, InvestorPlace, and Benzinga. She covers investing and focuses on stock picks and price prediction for 24/7 Wall St.
When not looking for the next stock investment opportunity, she can be found traveling, reading, chasing sunsets and enjoying her iced latte.