Congress Just Flipped. Here’s What Warren Buffett Does After Every Election.
A 66-year-old retiree lost about $11,300 in the week after the midterm election. The last six midterms show what stocks and dividends did over the next 12 months, and why Warren Buffett does not trade on election results.

This post may contain links from our sponsors and affiliates, and Flywheel Publishing may receive compensation for actions taken through them.
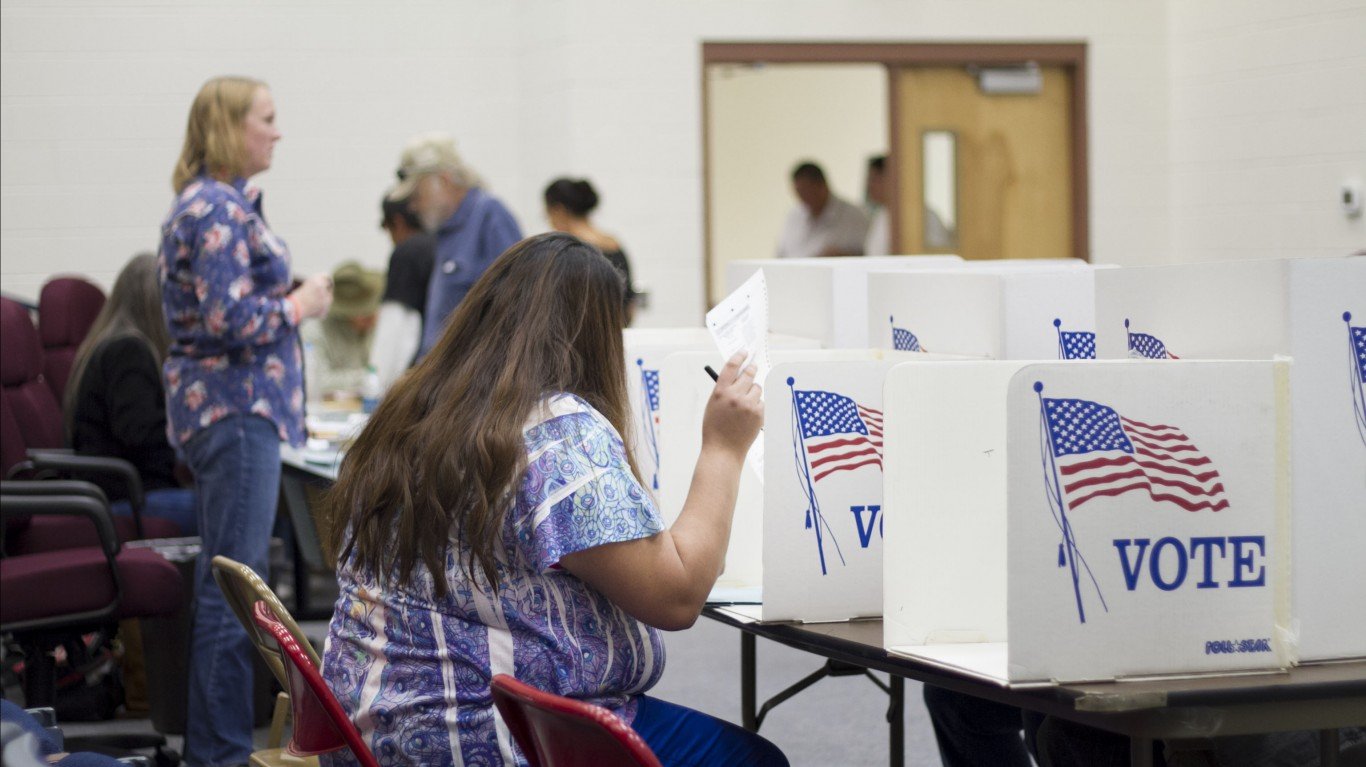
Control of Congress changed hands on Tuesday, and Wall Street had its roughest two days after a midterm election in at least 24 years. The S&P 500 rose 1.7% on Wednesday, then fell 4.4% on Thursday in a selloff led by artificial intelligence stocks. It rose 0.3% on Friday and ended the week 2.5% below where it finished on Election Day.
If you are 66, retired, and have $750,000 in retirement savings with $450,000 of it in an S&P 500 index fund, the week cost you about $11,300. You still collect $2,600 a month from Social Security, and the question in front of you is whether a new Congress is a reason to sell.
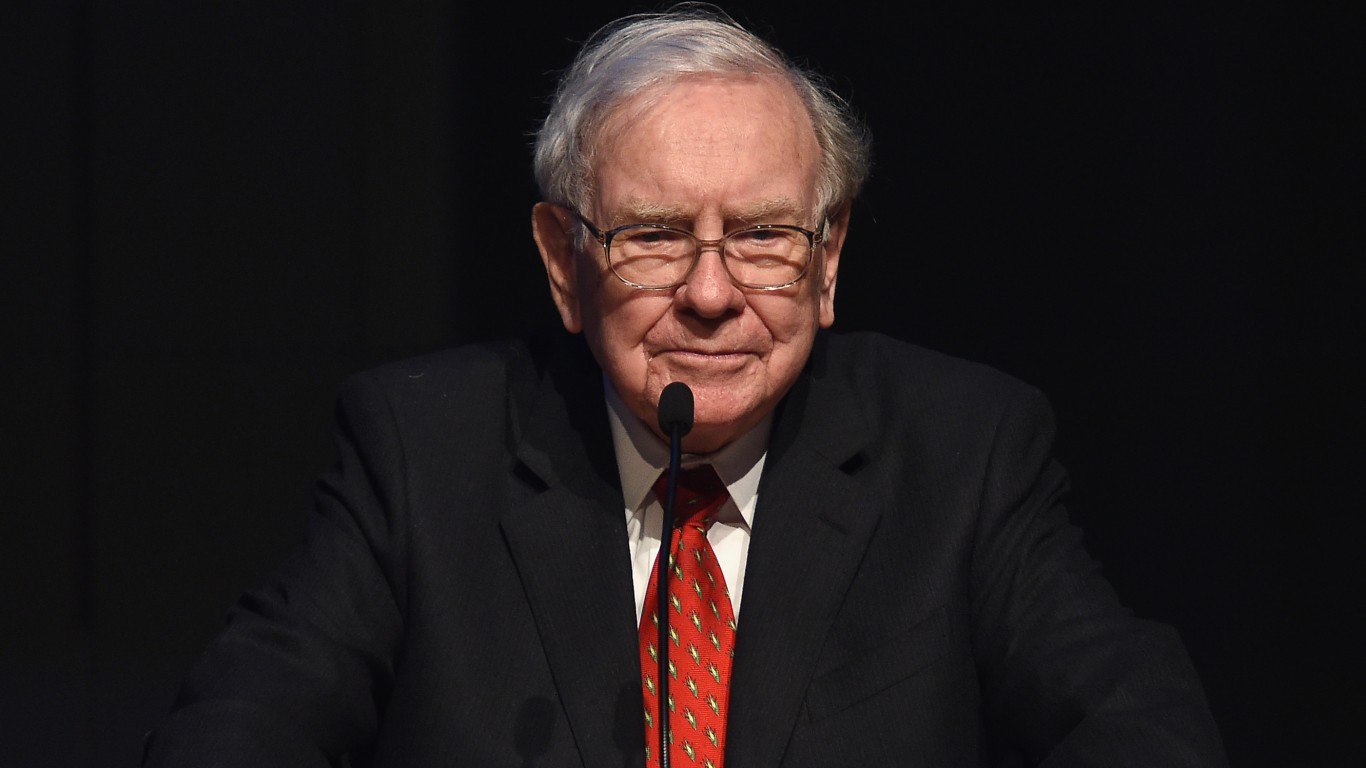
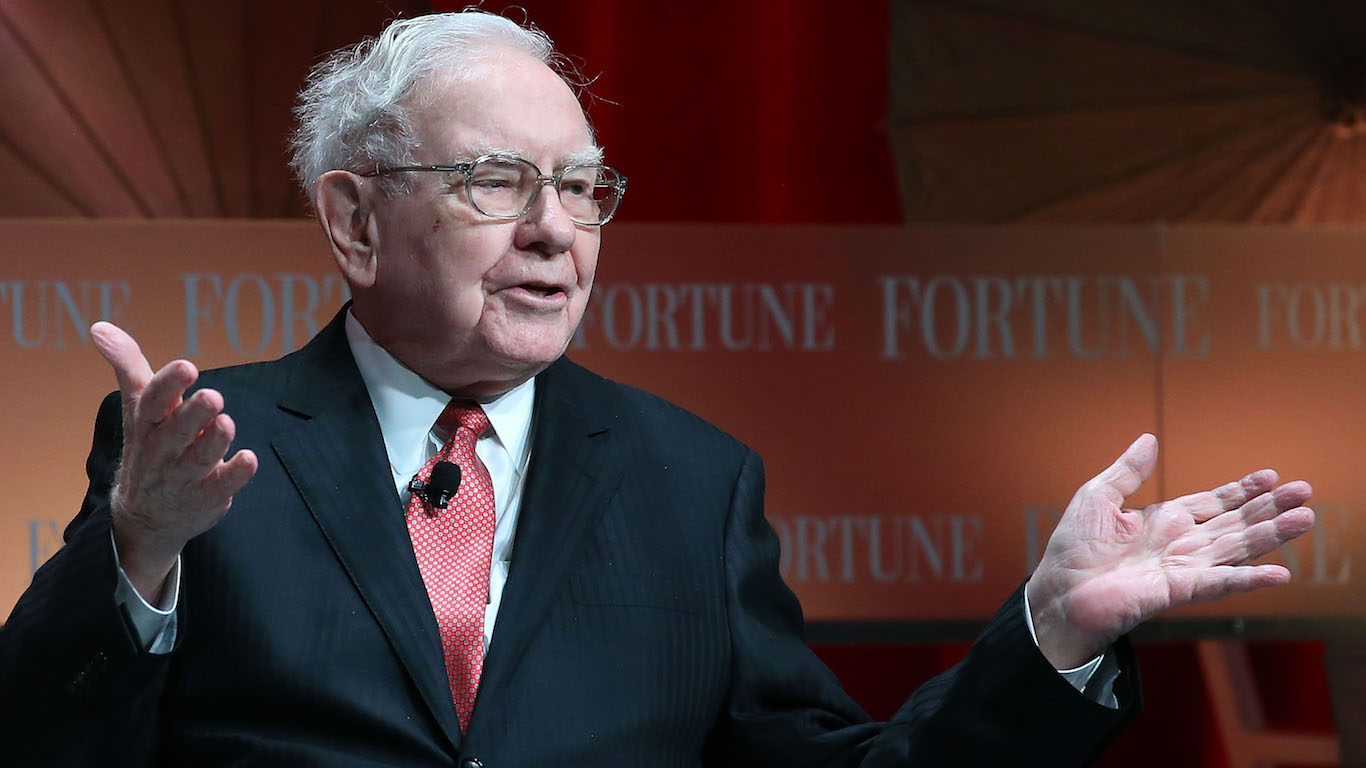
Warren Buffett has an answer he has given for years: he has never sold a stock because of who holds the White House. The record of the last six midterm elections shows what that habit was worth to a retiree.
The largest S&P 500 index fund has daily closing prices going back to 1999, which covers six midterm elections: 2002, 2006, 2010, 2014, 2018 and 2022. In every one of them, control of at least one chamber of Congress changed hands. Here is what the market and its dividends did in the 12 months after each.
The market was higher a year later after all six
Measured from the Election Day close to the close one year (252 trading sessions) later, prices only:
- 2002: up 15.2%
- 2006: up 6.2%
- 2010: up 2.1%
- 2014: up 4.6%
- 2018: up 12.0%
- 2022: up 13.6%
The middle of that range is about 9%. That record is good, and it is also ordinary. Across every 12-month stretch since late 1999, the same fund finished higher about 75% of the time, with a median gain of about 11%. The six midterm years landed in the normal range for any year. By this record, the year after a midterm has been an ordinary year for stocks.
The first two days after this election were weaker than the first two days after any of the other six. The worst of those was 2002, down 1.2%. Four of the six were up. A slow start has not decided how the year went.
The dips came anyway
The path to those gains was bumpy. In 2018, the index fund fell 14.8% below its Election Day close by Christmas Eve. In 2002, it was down 12.3% by March 2003. Both recovered to their Election Day level within about two months of the low: April 23, 2003, and Feb. 15, 2019.
Here is what those years would do to your $450,000 in stocks, starting from Election Day:
- The 2018 dip: about $383,300 at the low, a paper loss of $66,700
- The 2002 dip: about $394,500 at the low, a paper loss of $55,500
- The slowest year, 2010: about $459,500 a year later, a gain of $9,500
- The middle result: about $490,900, a gain of $40,900
- The best year, 2002: about $518,500, a gain of $68,500
The same year, 2002, appears twice on that list. It brought one of the two deepest slides and the strongest finish. A retiree who sold during the March low would have locked in the loss and missed the gain.
Your dividends kept rising
The index fund pays dividends every quarter, and they matter more to a retiree than a two-day price move. In each of the six years after a midterm, the fund paid more per share than it had in the 12 months before the election. The increases ranged from 5.4% after 2022 to 16.9% after 2006, with a middle of about 10%.
Over the past 12 months the fund paid about $7.58 a share, a yield of roughly 1.03% at Friday’s close. On your stocks, now worth about $438,700, that is about $4,500 a year. If the next 12 months match the smallest increase on record here, that rises to about $4,770. At the middle increase, it is about $4,990. Those payments arrive whether or not the share price has recovered.
What the safe money is doing
The other $300,000 sits in bonds and cash, and it carries the plan. If you take 4% of $750,000 each year, that is $30,000, or $2,500 a month. With Social Security, your income is $5,100 a month. That $300,000 alone covers 10 years of those withdrawals without selling a single share.
Rates help that money right now. The 10-year Treasury yielded 4.95% on Election Day, higher than on any of the six earlier midterm Election Days. The closest was 4.66% in 2006. Every $100,000 placed in 10-year Treasuries at this week’s 4.90% pays about $4,900 a year in interest.
What Buffett does with election results
Buffett has also told CNBC that he has spent about half his adult life under a president he did not vote for, and that he does not trade on election results. His view is that a business earns its money in the economy, and the economy outlasts any single Congress.
That habit fits the six years above. In each of them, an investor who held the fund through the dip ended the year with a higher balance and a bigger dividend check.
Where the plan is weak
Six elections are a small sample. None of the earlier years began with a two-day drop this sharp, and none began with the 10-year Treasury this high. A deeper or longer selloff is possible, and history cannot rule it out.
The plan also depends on the safe money being safe. If your $300,000 is mostly in long-term bond funds, their prices fall when rates rise. Check what you own. Money you will spend in the next two to three years belongs in cash, a money market fund or short-term Treasuries.
If 60% in stocks felt like too much on Thursday, pick a target mix first and then move to it on a set date. Moving to 50% stocks would mean selling about $69,300 at Friday’s prices.
The bottom line
Since 1999, the S&P 500 index fund was higher one year after all six midterm elections, from 2.1% to 15.2%, and its dividend grew after every one. Two of those years also brought drops of 12% to 15% before the gains arrived. For a 66-year-old with $750,000, $2,600 a month from Social Security and 10 years of withdrawals held outside stocks, a change in Congress gives no reason to sell. A decline that keeps you awake at night is a reason to revisit the mix, on your own schedule.
Contact [email protected] for any questions or corrections.
I've been writing about stocks and personal finance for 20+ years. I believe all great companies are tech companies in the long run, and I invest accordingly.