Apple Vs. Alphabet: Who’s The Better Flight-to-Quality Anchor Now?

This post may contain links from our sponsors and affiliates, and Flywheel Publishing may receive compensation for actions taken through them.
Apple (NASDAQ:AAPL | AAPL Price Prediction) and Alphabet (NASDAQ:GOOGL) reported within a week of each other, and cash separated the two results. Apple posted a record September quarter on November 2 and kept returning capital to shareholders. Alphabet grew faster on October 28 but burned cash on AI infrastructure. For investors researching defensive mega-caps, that gap matters more than headline growth.
iPhone Duo Carries Apple While Cloud Growth Costs Alphabet Cash
Apple earned $2.10 per share, beating the $1.98 consensus. Tariff refunds added $0.05 of that, so part of the beat came from a one-time boost. iPhone revenue rose 17% to $57.6 billion even with supply constraints, which points to real upgrade demand. Services set a record at $31.6 billion with a 76% gross margin. Those sales come from an installed base of more than 2.5 billion active devices. CEO John Ternus called it “our best fiscal year ever.”
Alphabet’s Google Cloud grew 103%, and its operating income jumped to $11.12 billion from $3.59 billion. Cloud is growing quickly despite its size. Sundar Pichai noted “strong demand for our TPU systems across a wide range of customers.” EPS still came in at $2.12, missing the $2.97 estimate. An $8.7 billion loss on equity securities explains most of the shortfall.
Apple Pays for Itself While Alphabet Raises Outside Money
Apple’s full-year capex fell 28.9% to $9.04 billion, while operating cash flow reached $145.10 billion. In other words, Apple’s suppliers carry the factory costs. Apple returned $28 billion in the quarter and has $137 billion in cash against $80 billion of debt. It also dropped its net-cash-neutral target to give itself more room to spend.
Alphabet’s quarterly capex hit $51.36 billion, which drove free cash flow to negative $9.07 billion. To fill the gap it sold $28.7 billion of notes and issued new shares, which dilutes existing holders. Its debt-to-equity ratio of 0.14 is still lower than Apple’s 0.71. Alphabet carries less leverage.
| Lens | Apple | Alphabet |
|---|---|---|
| Capex | $9.04B (fiscal year) | $51.36B (one quarter) |
| Funding | Self-funded buybacks | Notes plus share sales |
| Key vulnerability | Memory costs | AI capex payback |
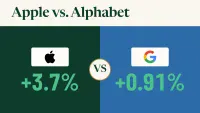
| YTD stock move | 31.17% | -6.06% |
Memory Prices and Siri AI Will Test Apple’s December Quarter
Apple expects December gross margin of 45% to 46%, below the 47.9% it just reported. Ternus called memory pricing “unprecedented.” I will be watching whether the price increases hold up and whether supply of the foldable iPhone Duo catches up with demand. For Alphabet, the question is whether Cloud profits can cover 2026 capex guidance of $175 billion to $185 billion (that spend has to land somewhere, and we profiled seven of the power, cooling and networking suppliers absorbing it in a free AI infrastructure report).
Why Apple Looks Like the Steadier Anchor
Apple trades at a premium. Its forward P/E is about 37, compared with around 19 for Alphabet. To me, a flight-to-quality stock should fund itself, and Apple does that today. Bloomberg noted that the best-performing mega-caps are the ones “throwing off cash”. Apple fits that profile. Alphabet looks like the better growth story, and I would rethink my view if its free cash flow turns positive. Until then, Apple’s self-funded model gives it the steadier cash profile.
Contact [email protected] for any questions or corrections.
Alex Sirois is a financial writer with experience spanning both retail and institutional investing. He has written for InvestorPlace and held roles at BNY Mellon and Bernstein, giving him a perspective that bridges Main Street portfolios and Wall Street analysis.
Alex holds an MBA from George Washington University and has built his career across multiple industries, including e-commerce, education, and translation — a breadth of experience that informs how he breaks down complex financial topics for everyday investors. His writing is conversational, actionable, and grounded in long-term, buy-and-hold investing principles.
At 247 Wall St., Alex focuses on delivering analysis that is both accessible and useful, with a clear emphasis on helping readers make more informed decisions with their money.