Two More Days Above 5% and Treasury Yields Tie 2007’s Run

This post may contain links from our sponsors and affiliates, and Flywheel Publishing may receive compensation for actions taken through them.
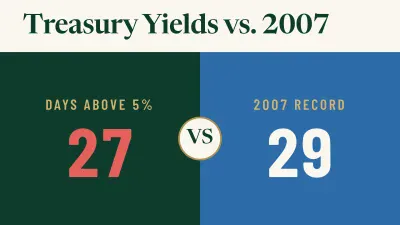
The 10-year Treasury closed at 5.10% on Tuesday, November 17, 2026. That was its fourth straight session above the 5.00% line. By Treasury’s data, 2026 now has 27 days with a close strictly above that level, compared with 29 in 2007.
The run in the title is a count of days in a calendar year, and the days do not have to be consecutive. All of 2007’s days fell between June 7 and July 19, 2007. Two more closes above the line, which could come as early as November 18 and November 19, would tie 2007. A third would give 2026 the most such days since 2006, which had 66, and 2000 through 2002 also had more.
Long bonds held steady. The iShares 20+ Year Treasury Bond ETF (NASDAQ:TLT) rose 0.21% to $79.55 on November 17. It is still down 5.15% for the year and 35.01% over five years. Long bonds now pay close to their highest yields since 2002, but the forces pushing yields up are still in place.
How 2026 Reached 27 Days in Bursts
The current run closed at 5.10% on November 12, 5.15% on November 13, 5.12% on November 16, and 5.10% on November 17. Treasury posted no reading for Veterans Day on November 11.
Earlier in the year, the 10-year closed above the line on September 16 and September 18. It then stayed above it for 20 sessions from September 23 to October 21 and added one more close on October 28. Its 2026 high of 5.31% on October 5 beat 2007’s peak of 5.26%. It was also the highest close since 5.32% on May 14, 2002.
In 2007, the 10-year held the level without a break. Considering the exact 5.00% close on July 2, it stayed at or above the line for 30 straight sessions. From 2008 through 2025, it never closed above the line, and its 2023 peak stopped at 4.98%.
Hike Pricing Is Driving Yields Higher
Hot October inflation data and hawkish comments from Fed officials caused the latest rise. Traders price a more than 95% chance of a quarter-point hike in December and four more hikes by next September. The fed funds upper bound is already at 4.00%[1]. St. Louis Fed President Alberto Musalem said the economy will likely need several more rate increases before spring 2027.
When AI stocks sold off, investors did not move into Treasuries for safety, so stock-and-bond portfolios got no buffer from bonds. Households feel these yields directly: the 30-year fixed mortgage averaged 7.48%.
Why TLT Moves More Than the 10-Year
TLT holds Treasuries that mature in 20 years or more. Its price moves opposite to long-term yields, and it moves more than the 10-year does. On November 17, the 20-year closed at 5.50% and the 30-year at 5.46%. Both were below their October 7 peaks of 5.71% and 5.67%. TLT fell 1.64% over the week.
Overnight readings ahead of November 18 showed the 10-year near 5.09%, and 10-year yield futures were at 5.082. Those are overnight readings and are not considered closes.
November 18 Auction Tests Demand
Treasury sells $16 billion of new 20-year bonds, with bids due at 1 p.m. ET. The October sale cleared at 5.469%. The $25 billion 30-year auction on November 12 cleared at 5.441%, with a bid-to-cover ratio (dollars bid per dollar sold) of 2.36. If the new sale clears at a higher yield than October’s, or gets a weaker bid-to-cover, buyers are asking for more pay.
Treasury also releases September data on foreign holdings of U.S. securities, and the Fed publishes its October minutes at 2 p.m. ET. Softer minutes, lower inflation data, or a rush into safe assets could end the run. Stronger hike pricing would extend it.
What Could Change the Outlook for TLT
TLT’s price likely depends on whether long-term yields fall, and the Fed is indicating more hikes. If those hikes lift long yields, TLT’s price drop could easily outweigh the income it pays, and the five-year loss shows how expensive rising yields have been for the fund.
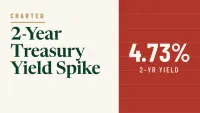
Short-term Treasuries carry less rate risk. The 2-year paid 4.80% with much less price risk.
If the 10-year closes above 5.00% on November 18 and November 19, 2026 ties 2007, and pressure on long bonds would likely continue. If the 10-year closes back below 5.00% after soft minutes, that would likely ease pressure on long bonds.
Contact [email protected] for any questions or corrections.
Omor Ibne Ehsan is a writer at 24/7 Wall St. He is a self-taught investor with a focus on growth, cyclical, and dividend equities that have strong fundamentals, value, and long-term potential. He also has an interest in high-risk, high-reward investments such as penny stocks.