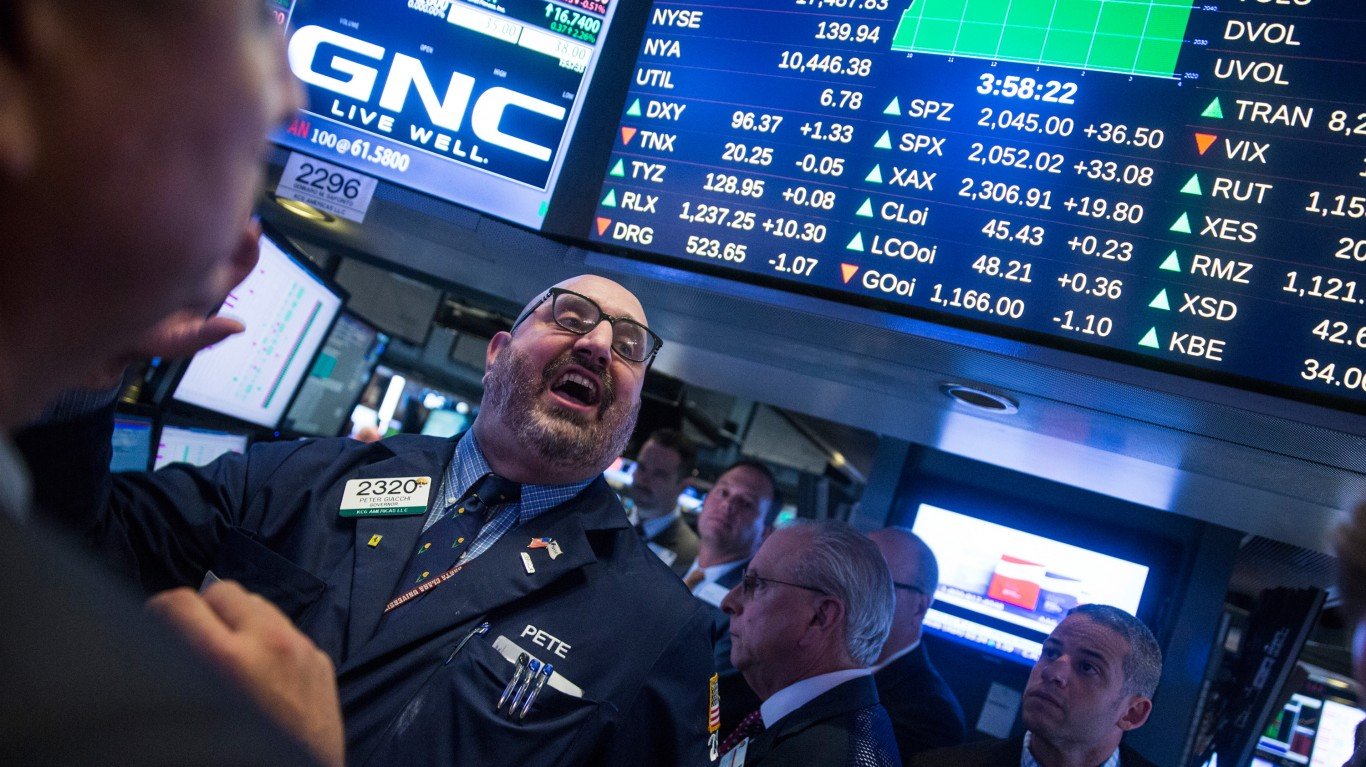
Wall Street’s Fear Gauge Went From 16.61 to 28.18 in a Single Day in November. Why It Keeps Snapping Back

This post may contain links from our sponsors and affiliates, and Flywheel Publishing may receive compensation for actions taken through them.

On Nov. 4[1], the CBOE Volatility Index (VIX), better known as Wall Street’s fear gauge, closed at a quiet 16.61[1]. One trading day later it closed at 28.18[1]. CNBC’s Nov. 5 headline called it the gauge’s biggest surge since April. If you live off your portfolio, a jump like that can feel like a fire alarm.
A Month of Whiplash for Wall Street’s Fear Gauge
The jump didn’t last. By the close on Nov. 11[1], the VIX had eased back to 17.49[1], close to where it started. Then it rose again. It closed at 25.46[1] on Nov. 17 and at 24.56[1] as of Wednesday’s close. That leaves the gauge up 40.4%[1] for the week and 33.2% for the month. CNBC’s Nov. 17 headline said the gauge was “surging again and this time it’s not just about AI jitters.” The causes of each swing haven’t been confirmed.
Stocks felt the swings, but only slightly. The SPDR S&P 500 ETF Trust (NYSEARCA:SPY) fell 4.77% from Nov. 4 through Nov. 18, yet it remains up 6.88% for the year. Bond yields moved too. The 10-year Treasury yield rose from 4.84% on Nov. 5[2] to 5.15% on Nov. 13[2].
What the Fear Gauge Actually Measures
The VIX shows how much movement options traders expect in the S&P 500 Index over the next month. It measures the expected size of swings in either direction. A high reading means traders are paying more for protection against big moves, but it says nothing about which way those moves will go.
Here is a rough guide to the readings. Below 15[1] signals calm, sometimes complacency. Between 15[1] and 20 is the normal range. From 20[1] to 30 means higher uncertainty. Above 30[1] is high fear, often during selloffs, and above 40 is rare panic. Wednesday’s 24.56[1] sits right in the higher band.
Over the past year, the VIX averaged 18.125[1]. Its high was 31.05 on March 27, 2026[1], and its low was 13.47 on Dec. 24, 2025. The latest close is higher than 92.2%[1] of the past year’s daily readings. That’s unusual territory, though still below the March peak.
Why Spikes Keep Fading
The VIX is mean-reverting: extreme readings tend to settle back toward normal over time. It also moves on an uneven schedule. Fear comes fast and leaves slowly, so the gauge tends to spike in a day or two and then drift lower over weeks. That pattern explains how the Nov. 5 surge faded within days, as the Nov. 11 reading showed. The climb since then shows the other side: calm can break just as quickly as it returns. This is how the gauge typically acts, and it says nothing certain about the next move.
What Retirees Should Do With a Jumpy VIX
If you’re retired, a volatile VIX is a good reminder to check your plan. Is your cash cushion big enough to cover upcoming withdrawals without selling stocks at a bad moment? Does your mix of stocks and bonds still match your timeline and the income you need? If the answer to both is yes, the gauge’s swings are mostly noise for your plan.
Selling into a spike carries its own risk. Investors who dump stocks when the VIX jumps often lock in losses right before calm returns, then face the harder decision of when to get back in. The March peak of 31.05[1] came and went, and so did the Nov. 5 surge. A plan built around your timeline should be able to weather weeks like this one (an early-retirement drawdown does far more damage than the same drop fifteen years in, which is the whole basis of our free guide on the first five years of retirement).
Contact [email protected] for any questions or corrections.
AJ spent 10 years writing about financial markets at The Motley Fool. His coverage centers on technology stocks and the broader macroeconomic trends, from interest rates to geopolitics, that shape where markets are headed next. AJ is drawn to the stories where big-picture economics and individual companies collide.