Bitcoin Dipped Toward $76,000 and Bounced Back Above $78,000 Within Hours. Is the Bottom In?
Bitcoin plunged to its lowest price since September before staging a dramatic same-day recovery, but the trading data behind the bounce raises serious questions about whether buyers or forced liquidations deserve the credit.

This post may contain links from our sponsors and affiliates, and Flywheel Publishing may receive compensation for actions taken through them.
Bitcoin (CRYPTO: BTC) quickly recovered, bouncing back above $78,000 after dipping below $76,000 earlier that morning. It fell to a low of $75,601 at 03:00 UTC, its lowest price since September 16, and slipped below the October 30 low of $76,141. By 07:00 UTC, Bitcoin had risen back above $78,000 and continued to climb.
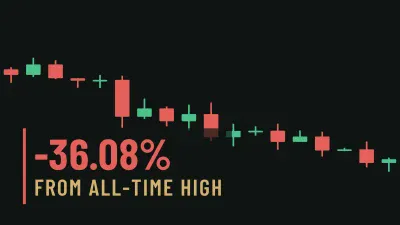
Bitcoin is trading at $80,360, up 3.7% over the past 24 hours. However, it remains around 36% below its all-time high of $126,080 reached on October 6, 2025. So, is this rapid rebound signaling the bottom for Bitcoin, or is it just another bounce in an ongoing decline that began in early October?
What Caused Bitcoin to Drop Below $76,000 and What Fueled Its Recovery?

The reasons behind both the drop and the recovery aren’t tied to any specific headline, so traders have turned to trading data for answers. Weak demand from Wall Street preceded the event, with U.S. spot Bitcoin ETFs—funds that hold Bitcoin for investors who buy through a brokerage account—experiencing net outflows of $115.6 million on November 3, leaving them with $99.2 billion in total assets.
During low overnight trading periods, selling pressure can intensify, leading to sharper price drops. Bitcoin fell through the 02:00 UTC hour and hit its low in the subsequent hour, when trading volume reached its highest level until mid-afternoon.
The initial recovery was modest, with Bitcoin’s hourly close rebounding to $78,019 at 07:00 UTC on only about a sixth of the volume traded in the low hour. A rise on light trading volume generally indicates that sellers have stepped back while buyers remain cautious.
The second part of the recovery was more pronounced, as Bitcoin surged to $81,131 during the 14:00 and 15:00 UTC hours, coinciding with the day’s highest trading volume at 15:00 UTC.
Such rapid price increases often stem from liquidations. Traders who short Bitcoin—borrowing the asset to sell in hopes of repurchasing it at a lower price—can face automatic buybacks by exchanges if prices rise enough. This forced buying contributes to upward momentum and can trigger additional buying pressure from other short-sellers.
Exchanges have not yet reported a confirmed total for liquidations during this session. If much of the price increase is driven by forced buying, Bitcoin will need new buyers, particularly through ETFs, to maintain its upward movement.
Bitcoin Reclaims Its 20-Day Average, but Ethereum Bounces Harder

At $80,360, Bitcoin has reclaimed its 20-day moving average of $80,317, a key short-term trend indicator. However, it still falls below its 50-day average of $81,909, where selling pressures have previously increased, and the day’s high of $81,131 remained just under that level.
The longer-term trend is mixed. Bitcoin is above its 200-day average of $73,163 and has gained 25.4% over the past 90 days. However, it has dipped 6% over the last 30 days and 8% this year. While the recent bounce erased some losses, most of October’s decline remains.
All major cryptocurrencies bounced simultaneously, suggesting the recovery may not be Bitcoin-specific. Ethereum (CRYPTO: ETH) rose by 6% to reach $2,433 and is now above its 20-day average of $2,351. As a smaller, more speculative market than Bitcoin, Ethereum typically sees larger price swings during market moves. It has also declined 10.1% over the past 30 days, leaving more ground to regain.
Solana (CRYPTO:SOL) lagged the other two, rising 3.3% to $97, but it remains down 19.7% over the past 30 days and trades below both its 20-day average of $101 and its 50-day average of $109.
Bitcoin’s Last Three Rebounds Show Why One Bounce Isn’t Enough

The November 4 low was lower than the October 30 low, a trend characteristic of a downtrend. Nevertheless, Bitcoin has remained above the September 15 low of $74,888, keeping the September support intact.
On September 26, podcast host Anthony Pompliano questioned whether Bitcoin was in “a consolidation before a dump back down into the 70s,” as it traded between $83,000 and $87,000. Bitcoin has spent much of the past week in the $70,000 range, indicating that the anticipated drop has already occurred.
The rebounds in August and September lasted about a month, but sellers erased the gains from the October 30 rebound.
| Low Date | Intraday Low | Close One Week Later | Close One Month Later |
|---|---|---|---|
| August 14 | $62,468 | $78,326 (August 21) | $78,175 (September 14) |
| September 15 | $74,888 | $86,198 (September 22) | $82,131 (October 15) |
| October 30 | $76,141 | Low broken on November 4 | Not yet available |
Buyers would be pleased to see a repeat of September, when Bitcoin rose from $74,888 on September 15 to close at $80,875 on September 18 during a high-volume trading day, followed by further gains. Meanwhile, the October bounce reversed direction, closing at $78,231 on November 1 before sellers drove the price back down.
Is the Bitcoin Bottom In? Two Daily Closes Could Determine That
As of now, we cannot confirm that the Bitcoin bottom is in. ETF flows have yet to show a positive trend, and market fear has not peaked. According to a popular crypto Fear and Greed Index, which measures the market’s emotional state from 0 (extreme fear) to 100 (extreme greed), the sentiment remains cautious at 46.
Contact [email protected] for any questions or corrections.
Sam Daodu is a crypto analyst and the editor of 24/7 Wall St.'s Crypto Desk, where he covers Bitcoin, XRP, Ethereum, Solana and the altcoins investors search for most. His work focuses on price levels, spot ETF flows, on-chain data and the regulatory decisions that move crypto markets, written so a first-time buyer and a seasoned trader can both use it.
Sam has written about crypto professionally since 2019 and has published more than 2,000 articles. Before joining 24/7 Wall St., he wrote for crypto media outlets and Web3 companies and ghostwrote for crypto founders and token launches. His analysis is syndicated on Yahoo Finance, MSN and AOL and has been cited by other crypto news sites. He also founded MacLabs Marketing, a content and personal branding agency for crypto founders and executives.
When he isn't reading charts, Sam is usually at the gym or watching One Piece, a series he maintains has better tokenomics than most altcoins.