XRP Fell to $1.07, Its Lowest Since August. Will the $1 Support Hold This Time?
Buyers saved the $1 line twice this year, once in June and again after a White House summit in August. With ETF inflows frozen and Congress stalled, XRP has no obvious rescue this time, and the daily closes may decide…

This post may contain links from our sponsors and affiliates, and Flywheel Publishing may receive compensation for actions taken through them.
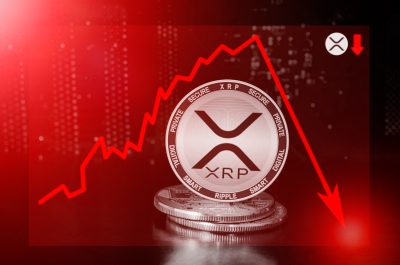
XRP (CRYPTO: XRP) dipped to $1.07, its lowest price since August, leaving the XRP $1 support 9.9% away. XRP trades at $1.11 as of November 9, down 4.4% in the last 24 hours, 11.5% over the past week, and 20.7% over the last month. That leaves the coin 69.6% below its all-time high of $3.65.
XRP closed at $1.11 on November 8, also a 30-day low. Two outside forecasts name $1 as a key support level, and buyers successfully defended it in June and reclaimed it in August. The question now is whether the $1 support will hold for a third time.
XRP’s Buyers Disappeared Before the Slide to $1.07
The recent price drop comes from a decline in demand that started to surface in early November. Spot XRP ETFs, funds that hold XRP and trade on stock exchanges, reported zero net flows on November 3, 4, 5, and 6. That lack of institutional buying left sellers with less resistance. XRP fell to $1.10 late on November 8 as selling increased, and the selling continued until buyers stepped in at $1.07.
Congress hasn’t provided any relief either. The CLARITY Act, a bill that would place digital commodities like XRP under the Commodity Futures Trading Commission, failed a Senate procedural vote 49 to 50 on September 15, short of the required 60 votes. The bill could lapse on January 3, 2027, because the Senate hadn’t scheduled a new vote as of November 7.
Meanwhile, Ripple, the company behind XRP, is growing in areas that don’t depend on XRP. Token Terminal posted on X on November 9 that Ripple’s stablecoin market cap rose by $229 million over the past month. At the same time, tokenized credit funds on the XRP Ledger fell by $207 million. Ripple’s stablecoin is backed by dollars, so Ripple can expand its business while XRP buying stays thin.
XRP Trades Below Every Moving Average and Trails Bitcoin, Ethereum and Solana
XRP is trading below all its major moving averages, including the 20-day average of $1.27, the 50-day average of $1.37, and the 200-day average of $1.27. That shows sellers control both the short-term and long-term trends. To reach the 20-day moving average, XRP would need to rise 14.4%, and to reach the 50-day average, it would need a 23.4% increase.
Dip buyers did emerge when XRP hit its low, pushing the price back up to $1.09 on increased trading activity. However, XRP closed lower each day from November 5 to November 8.
XRP’s peers have held up far better. While XRP lost 11.5% over the past week, Bitcoin (CRYPTO: BTC) dropped only 3%, Ethereum (CRYPTO: ETH) fell 6%, and Solana (CRYPTO: SOL) declined 6.8%. Over the past 24 hours, Ethereum saw the largest decline at 4.6%, while Bitcoin dropped 1.2% and Solana 2.8%.
XRP’s struggles appear to be specific to the coin, as ETF demand and the CLARITY Act stalled at the same time. Despite its own ETF outflows, Solana hasn’t fallen as hard as XRP, even as both hit 30-day lows.
XRP Held Above $1 in June and Broke It Briefly in August
XRP’s current slide followed its break below the $1.35 to $1.38 support zone in mid-October. In June, XRP tested the $1 support by dropping to $1.01 on June 25 and 26, then bounced without breaking the line, as an analysis of a $1 break tracked at the time.
However, August was more turbulent. XRP fell as low as $0.99 between August 14 and August 18 and closed at $0.99 on August 16, before rebounding after the White House crypto policy summit on August 19 to close at $1.27 the next day.
XRP now appears oversold, a condition that has often preceded price recoveries. The relative strength index (RSI) measures the speed and size of recent price moves, and low readings point to heavy selling. Bitrue Research Institute counted 18 daily RSI readings below 35 on XRP since January 2023, and XRP traded higher three months later in 12 of the 17 cases with a full three-month window.
The median gain after those readings was 9.1%, against 3% for all days. Bitrue named a daily close above $1.18 as its recovery signal.
| Level | What It Marks |
|---|---|
| $1.37 (+23.4%) | 50-day moving average |
| $1.27 (+14.4%) | 20-day and 200-day moving averages |
| $1.18 (+6.3%) | Bitrue’s daily-close recovery signal |
| $1.07 (-3.6%) | November 9 low |
| $1 (-9.9%) | Support tested in June and August |
| $0.99 (-10.8%) | August 16 closing low |
| $0.90 (-18.9%) | Next support level |
| $0.80 (-27.9%) | Following round-number support |
Will the XRP $1 Support Hold This Time?
The $1 support may still hold, as buyers defended it successfully in June and August, and XRP’s oversold readings might favor a rebound. However, the August recovery needed a White House summit, and XRP has no comparable catalyst now, with ETF flows flat and the CLARITY Act stuck. Any recovery depends on fresh ETF buying that hasn’t returned, as a year-end rebound laid out.
The daily closes could settle it. A close above $1.18 would match Bitrue’s signal and suggest the $1 support held. A close below $1 could send XRP toward its $0.99 August low and then $0.90.
Contact [email protected] for any questions or corrections.
Sam Daodu is a crypto analyst and the editor of 24/7 Wall St.'s Crypto Desk, where he covers Bitcoin, XRP, Ethereum, Solana and the altcoins investors search for most. His work focuses on price levels, spot ETF flows, on-chain data and the regulatory decisions that move crypto markets, written so a first-time buyer and a seasoned trader can both use it.
Sam has written about crypto professionally since 2019 and has published more than 2,000 articles. Before joining 24/7 Wall St., he wrote for crypto media outlets and Web3 companies and ghostwrote for crypto founders and token launches. His analysis is syndicated on Yahoo Finance, MSN and AOL and has been cited by other crypto news sites. He also founded MacLabs Marketing, a content and personal branding agency for crypto founders and executives.
When he isn't reading charts, Sam is usually at the gym or watching One Piece, a series he maintains has better tokenomics than most altcoins.