What Bitcoin Did Every Time It Fell 50% From Its All-Time High

This post may contain links from our sponsors and affiliates, and Flywheel Publishing may receive compensation for actions taken through them.

Bitcoin (CRYPTO: BTC) again dropped more than 50% from its peak in November 2026. The price fell as low as $62,438, down 50.6% from its all-time high of $126,296 reached in October 2025. Despite this decline, Bitcoin remains up approximately 8,300% over the last decade.
Investors in the Grayscale Bitcoin Mini Trust (NYSEARCA: BTC), which the SEC registered as a spot Bitcoin ETF, are experiencing similar downturns. However, Bitcoin has crossed the 50% threshold in previous cycles. So, what has Bitcoin done each time it fell 50% from its all-time high?
Bitcoin Fell Below Half Its All-Time High Again in November
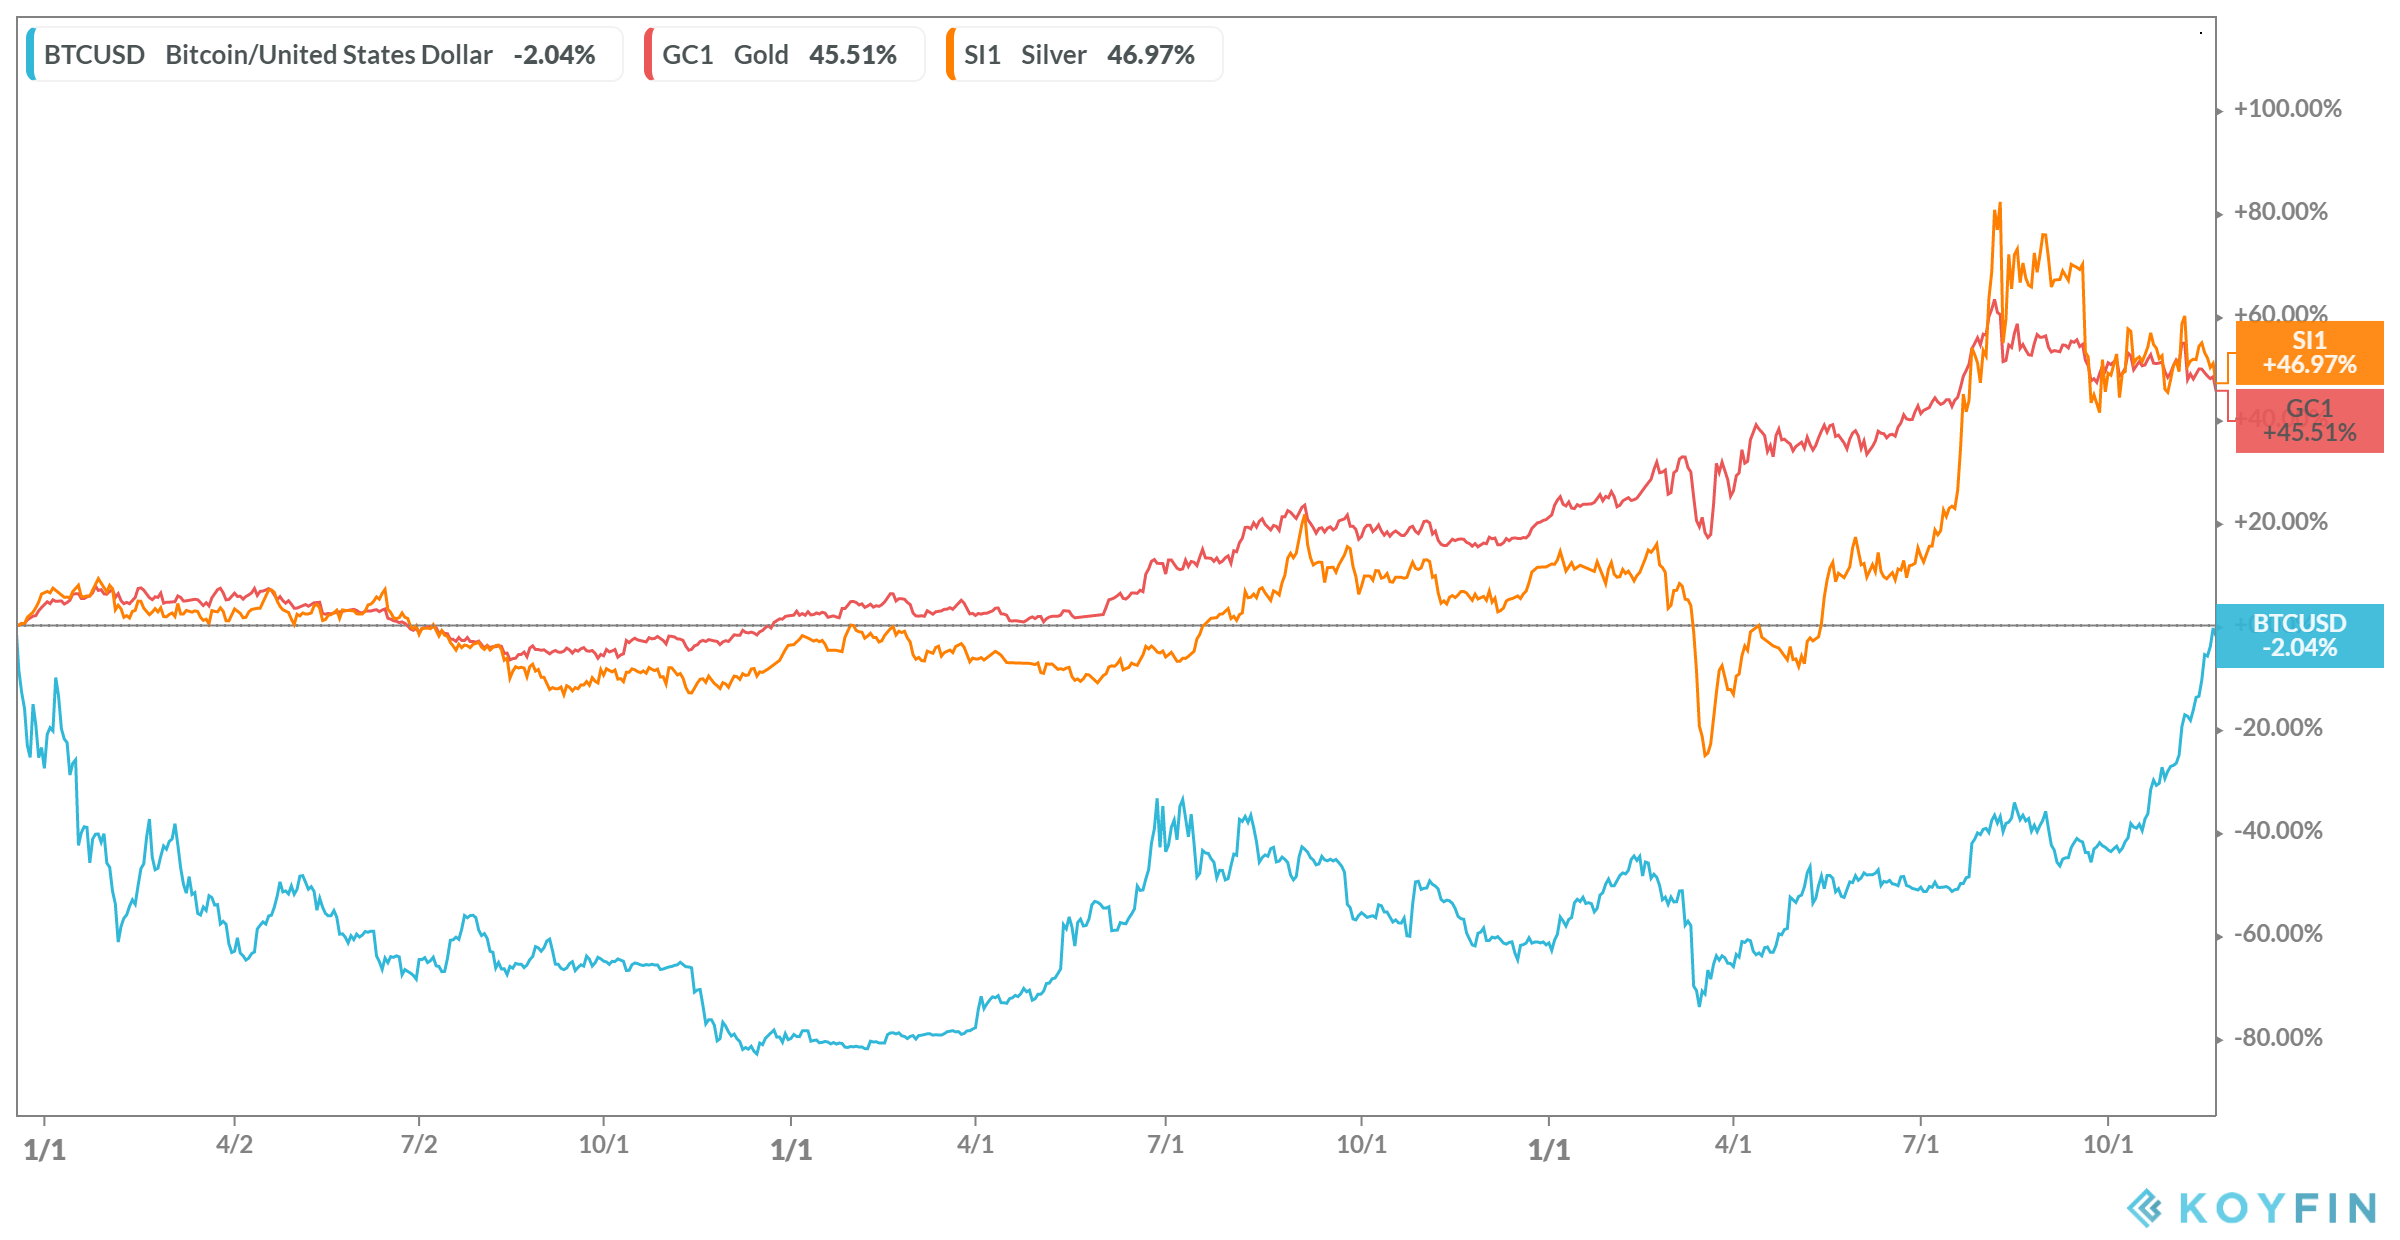
Since hitting its low, Bitcoin has rebounded to $64,664, 48.8% below its all-time high and 2.4% above the halfway mark of $63,148. The low was the deepest since August, coinciding with a 14.9% weekly loss and a 20.8% loss over the past 30 days, as detailed in “Why Bitcoin Is Declining.”
According to Bianco Research, Bitcoin peaked for this move on September 21 and has since fallen over 25%. Binance Research noted that the 15.6% drop over the 11 days to November 14 was Bitcoin’s sharpest sell-off over a stretch that long.
Data from Glassnode indicates that the largest cluster of holder costs, or the price at which most coins last changed hands, lies between $60,000 and $63,000. This means a significant number of holders are around this breakeven point, which we explored in what happens if Bitcoin drops below $65,000.
Michael Saylor, chairman of Strategy, hinted at potential buying on November 15, posting, “This dip could use a little orange” on X.
Every Earlier 50% Fall Ended in a New All-Time High

In every previous cycle, Bitcoin kept falling after crossing the 50% mark, sometimes for more than a year.
| Cycle | All-Time High | 50% Crossed | Bottom Price | Fall at Bottom | Months to Bottom |
|---|---|---|---|---|---|
| 2011 | $29.60 (June 2011) | August 2011 | $2.05 (November 2011) | 93.1% | 3 |
| 2013 to 2015 | $1,156 (November 2013) | December 2013 | $172 (January 2015) | 85.2% | 13 |
| 2017 to 2018 | $19,927 (December 2017) | January 2018 | $3,189 (December 2018) | 84.0% | 11 |
| 2021 | $64,816 (April 2021) | May 2021 | $28,900 (June 2021) | 55.4% | 1 |
| 2021 to 2022 | $68,770 (November 2021) | January 2022 | $15,598 (November 2022) | 77.3% | 10 |
| 2025 to 2026 | $126,296 (October 2025) | February 2026 | $57,718 (July 2026) | 54.3% | 5 |
The drop in 2021 was the quickest recovery, with Bitcoin reaching a new all-time high in October 2021, five months after crossing the 50% mark. However, after hitting that high, it closed November 2021 at $57,030, and by May 2022, it had fallen to $31,853 as the next bear market began.
Full bear markets have historically taken longer to recover. Bitcoin fell after crossing the 50% mark in January 2018, hitting a low of $5,830 by June 2018. After crossing in January 2022, it closed at $23,314 in July 2022 and $23,153 in January 2023, even briefly rebounding to $48,130 in March 2022 before falling below the line again.
Even so, every complete cycle ended with a new all-time high. Bitcoin surpassed its 2011 peak by April 2013, its 2013 peak by March 2017, its 2017 peak by December 2020, and its 2021 peak by March 2024.
The 2026 Fall Is Shallower So Far, and Spot ETFs Are New

Bitcoin already crossed the 50% threshold once this cycle, dropping to $60,001 in February, bottoming at $57,718 in July, and closing August at $78,563, six months after the first crossing. The November decline marks a second drop for the current cycle, similar to 2022 when Bitcoin rebounded above the threshold in March before falling again.
So far, this decline is shallower. The deepest 2026 drop, 54.3%, is closer to the 55.4% drop of 2021 than the deeper declines of 77.3% to 93.1% seen in full bear markets. Additionally, this is the first cycle with spot Bitcoin ETFs in brokerage accounts, which began trading in January 2024.
A guest on the Unchained podcast argued on October 30 that the buyers who drove Bitcoin’s price from $58,000 to $80,000 in August were “longer-term people with longer-term views on Bitcoin” who are less likely to sell during short-term market turbulence. The guest added that “everything historically looks like Bitcoin’s bottom is in,” while conceding the call could be wrong.
The November drop now seriously tests that belief. It also highlights a fundamental question in any market bubble: who gets to keep the gains. Our free Bubble Survivor’s Handbook covers strategies for riding out manias and planning an exit.
Bitcoin Recovered From Every 50% Fall After First Falling Further
Every time Bitcoin fell 50% below its all-time high, it kept declining for 1 to 13 months before setting a new all-time high. The challenge remains waiting for recovery. Over the last five years, Bitcoin has risen only 3.4%, showing how long a full recovery can take.
So far in 2026, the decline looks more like the shallow dip in 2021 than the severe bear markets. If the holder cost cluster between $60,000 and $63,000 holds, Bitcoin could repeat the 2021 rebound. However, if that level breaks, Bitcoin could revisit the July low of $57,718, 10.7% below the current price.
Contact [email protected] for any questions or corrections.
Sam Daodu is a crypto analyst and the editor of 24/7 Wall St.'s Crypto Desk, where he covers Bitcoin, XRP, Ethereum, Solana and the altcoins investors search for most. His work focuses on price levels, spot ETF flows, on-chain data and the regulatory decisions that move crypto markets, written so a first-time buyer and a seasoned trader can both use it.
Sam has written about crypto professionally since 2019 and has published more than 2,000 articles. Before joining 24/7 Wall St., he wrote for crypto media outlets and Web3 companies and ghostwrote for crypto founders and token launches. His analysis is syndicated on Yahoo Finance, MSN and AOL and has been cited by other crypto news sites. He also founded MacLabs Marketing, a content and personal branding agency for crypto founders and executives.
When he isn't reading charts, Sam is usually at the gym or watching One Piece, a series he maintains has better tokenomics than most altcoins.