TQQQ: What a $10,000 Bet on This 3X Nasdaq ETF Would Actually Be Worth Today
The AI boom turned TQQQ into one of the market's most talked-about leveraged ETFs, but the same structure that creates explosive gains can just as easily destroy wealth. Here is what actually happened to investors who bought in at a…

This post may contain links from our sponsors and affiliates, and Flywheel Publishing may receive compensation for actions taken through them.
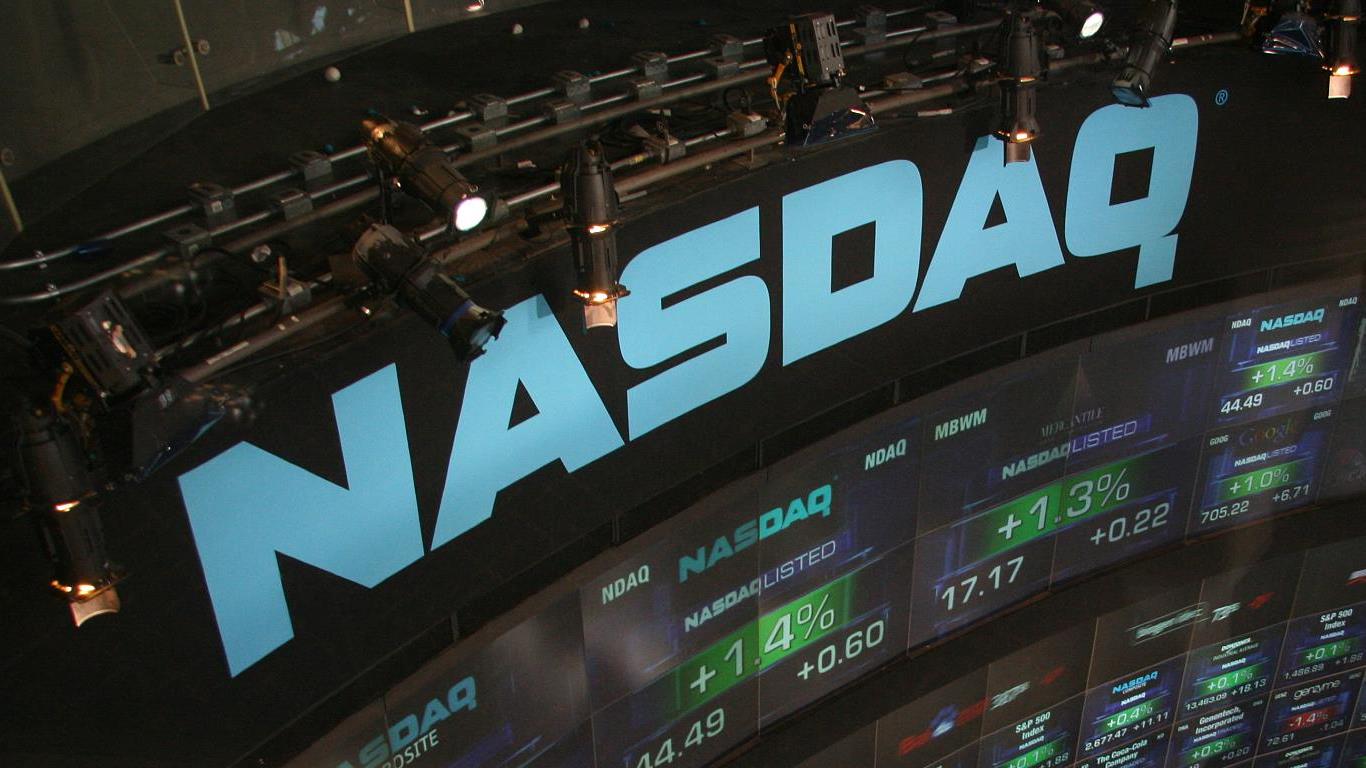
The ProShares UltraPro QQQ (NASDAQ:TQQQ) has been one of the stock market’s biggest winners during the artificial intelligence boom. By seeking three times the daily performance of the tech-heavy Nasdaq-100 Index, the fund has generated returns that few traditional ETFs have been able to match.
That performance naturally raises an intriguing question: What would a $10,000 investment in TQQQ actually be worth today? The answer demonstrates the extraordinary wealth the fund has created during one of the strongest bull markets in recent history, while also illustrating why leveraged ETFs can produce dramatically different outcomes when compared to conventional index funds.
However, before looking at the numbers, it is important to understand both the powerful catalysts that have driven technology stocks higher and the unique structure that allows TQQQ to amplify those gains.
Catalysts Driving Tech Higher
AI has remained one of the most powerful investment themes in today’s market environment, fueling strong earnings growth and record Capex across the technology sector.
While aggressive spending has been a recent cause for concern, companies have continued investing heavily in AI infrastructure, semiconductors, cloud computing, and data centers. Google’s recent earnings highlight this spending trend, with Alphabet now expecting capital investments of $195 billion to $205 billion for the year.
While demand for AI-powered software has expanded across the broader economy, resilient corporate profits and investor optimism have helped push the Nasdaq-100 higher. As a result, funds tracking the index (especially leveraged ETFs like TQQQ) have been among the biggest winners in the current technology-led bull market.
How Leverage Amplifies Returns
The numbers help explain why TQQQ has attracted so much attention during the current AI-driven bull market.
A $10,000 investment in TQQQ made on November 30, 2022 — the day ChatGPT was publicly released — would today be worth approximately $60,000, dramatically outperforming a comparable investment in the Nasdaq-100 over the same period. This remarkable gain reflects the compounding nature of TQQQ’s daily 3x target of the Nasdaq-100.
When technology stocks trend steadily higher, the fund’s daily leverage can compound into extraordinary long-term returns. The same structure, however, also magnifies losses during market drawdowns (maximum historical drawdown for TQQQ = -81.66%), making the fund most appropriate for investors who understand both its return potential and its elevated risk.
Additionally, it is important to note that leveraged ETFs are specifically designed for short-term tactical trading rather than long-term exposure. Since leverage is reset daily, returns can deviate significantly from the 3x target. In volatile and/or sideways markets, the fund could underperform due to a phenomenon commonly known as volatility drag.
Key Fund Statistics
While its daily leverage reset can produce exceptional gains during sustained bull markets, it also increases volatility and risk compared to traditional index funds. The table below highlights the fund’s key characteristics and recent performance metrics investors must consider.
| Metric | TQQQ |
| Benchmark | Nasdaq-100 |
| Inception Date | February 9, 2010 |
| Investment Objective | 3× Daily Return of the Nasdaq-100 |
| Net Assets | $31.74B |
| Expense Ratio | 0.82% |
| 1-year Total Return | 44.76% |
| 3-year Cumulative Return | 198.65% |
| 5-year Cumulative Return | 86.68% |
| 3-month Average Daily Volume | ~$5.28 billion |
| Max Drawdown | -81.66% |
Final Takeaway
TQQQ has rewarded investors with extraordinary gains during one of the strongest technology bull market runs in history, turning a relatively small investment into a substantial sum in just a few years. However, those returns have come with significantly higher volatility, making the fund best suited for investors who understand how leveraged ETFs work and can tolerate sharp swings in performance. For those willing to accept that risk, TQQQ remains one of the most powerful ways to amplify exposure to the Nasdaq-100.
Contact [email protected] for any questions or corrections.
Ryne Mauck is an investment writer covering exchange-traded funds, retirement planning, and portfolio strategy. Through his work at 24/7 Wall St. and other investment platforms, including Seeking Alpha, he aims to provide clear, research-driven insights that help investors make more informed decisions while maintaining a long-term approach to investing.
Ryne holds a B.Sc. in Finance and an M.A. in Political Science. He is a formerly registered Municipal Advisor Representative and has passed the Series 50, Series 63, and Series 65 exams. His articles are not intended to be, nor should they be interpreted as, financial advice.