Forget BND: This $16.4B BlackRock Fund Pays 5.9% vs. BND’s 4.1% Yield
BND has been the default core bond holding for millions of American investors, but a growing number of income-focused portfolios are quietly rotating into a competing fund that charges ten times more and holds riskier debt, yet keeps outperforming on…

This post may contain links from our sponsors and affiliates, and Flywheel Publishing may receive compensation for actions taken through them.

If you own the Vanguard Total Bond Market ETF (NASDAQ:BND), you own the default core bond holding in American portfolios. BND tracks the Bloomberg U.S. Aggregate Float Adjusted Index, holds Treasuries, agency mortgages, and investment-grade credit, and charges an industry-low 0.04% expense ratio. Investors buy it for one reason: cheap, diversified, low-volatility exposure to the U.S. bond market. That is a defensible reason. But over the last year, a fund from BlackRock has quietly delivered a materially better outcome for income-focused holders.
Why BND Feels Broken Right Now
Two numbers explain the frustration. BND’s trailing 12-month distributions total $2.93 per share, which works out to roughly a 4.1% distribution yield at the current price of $71.15. And the fund’s total return over the trailing 12 months is essentially flat, at -0.72%. Over five years, adjusted for distributions, BND is still down 2.94%.
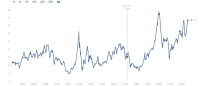
The mechanism is straightforward. BND owns duration. With the 10-year Treasury yield at 4.95%, sitting in the 99.6th percentile of the past year’s range, price gains on high-quality intermediate bonds have been consistently swamped by rate moves. You are getting the coupon, and not much else.
Meet BINC: BlackRock’s Active Answer
The alternative worth examining is the iShares Flexible Income Active ETF (NYSEARCA:BINC), run by BlackRock CIO of Global Fixed Income Rick Rieder. BINC is actively managed with a multi-sector mandate: it can rotate across agency mortgages, investment-grade credit, high-yield bonds, emerging-market debt, and securitized products. Its December 31, 2025 fact sheet shows the mix in action, with two UMBS 30-year TBA positions totaling 11.4% of assets, sovereign exposure to Spain, Ireland, and Brazil, and layered investment-grade and high-yield iShares ETF sleeves.
The fund is not small. BINC now holds roughly $16.4 billion in assets, based on 320.85 million shares outstanding at a price of $51.20. Trailing 12-month distributions total $3.04 per share, a distribution yield of approximately 5.9%. iShares’ own website reports a 30-day SEC yield of 5.38%, so the payout reflects real coupon income the underlying portfolio is actually generating, not a return-of-capital artifact.
Dollar Difference in Practice
Compared to BND’s 4.1% distribution yield, BINC’s ~5.9% yield is a gap of roughly 180 basis points. On a $100,000 position, that is around $1,800 more income per year, paid monthly. Total return has followed the same direction: BINC returned 1.86% over the trailing year while BND lost ground, a spread of roughly 2.6 percentage points in a single year.
The reason is structural. An active multi-sector manager can shorten duration when rates are climbing, own more securitized and high-yield paper when spreads compensate for it, and avoid specific drags on return. BND, by design, cannot do any of that.
What You Give Up
Nothing is free. BINC charges 0.40% versus BND’s 0.04%, a 36-basis-point fee premium. You are paying for the active management. December distributions can also be lumpy: BINC paid $0.428 on December 19, 2025, on top of the regular monthly payment, likely a capital-gains distribution, which matters in taxable accounts. Credit exposure is genuinely higher than BND. In a serious recession, BINC’s high-yield and EM sleeves will draw down more than that of BND.
How to Approach the Swap
In a tax-advantaged account (IRA, 401(k) rollover), the switch is mechanical: sell BND, buy BINC, no tax friction. In a taxable account, check your cost basis first. If BND is at a loss, harvesting it may fund the transition cleanly. If BND sits on a gain from a purchase years ago, a partial swap—funneling new contributions into BINC while leaving BND in place—avoids a tax event you did not need. (For readers sizing up how much monthly income a mid-six-figure balance can realistically throw off, we walked through the math in a free report here.)
Contact [email protected] for any questions or corrections.
Ryne Mauck is an investment writer covering exchange-traded funds, retirement planning, and portfolio strategy. Through his work at 24/7 Wall St. and other investment platforms, including Seeking Alpha, he aims to provide clear, research-driven insights that help investors make more informed decisions while maintaining a long-term approach to investing.
Ryne holds a B.Sc. in Finance and an M.A. in Political Science. He is a formerly registered Municipal Advisor Representative and has passed the Series 50, Series 63, and Series 65 exams. His articles are not intended to be, nor should they be interpreted as, financial advice.