SCHD’s Price May Be Soaring, but Its Dividend Isn’t Keeping Up
SCHD has rewarded investors with soaring returns, but the income side of the story tells a very different tale. Find out why the fund's top holdings may be quietly working against the very retirees who depend on it most.

This post may contain links from our sponsors and affiliates, and Flywheel Publishing may receive compensation for actions taken through them.
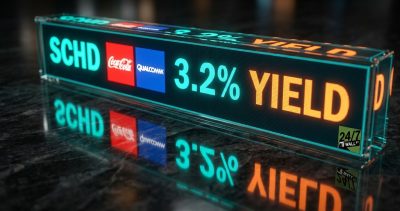
Schwab US Dividend Equity ETF (NYSEARCA:SCHD) has returned 33% over the past year on a dividend-adjusted basis. The fund has returned 30% so far this year. Income grew much more slowly.
Distributions over the trailing 12 months total $1.05 per share, up about 2% from $1.03 in the prior 12 months.
With shares trading around $35, that works out to a trailing yield of 3.2%. While the payout is safe, the open question is whether the fund’s largest holdings can grow it fast enough to justify the higher price.
Where Each Quarterly Check Comes From
This fund follows the Dow Jones U.S. Dividend 100 Index. The index screens for long dividend records, cash flow against debt, return on equity, yield, and five-year dividend growth. All the income comes from the ordinary dividends that its holdings pay, and it is distributed four times a year.
Recent quarters show slow growth with one dip. The September payout of $0.27 came in about 2% above the year-earlier quarter. The June payout of $0.25 fell about 3% short of the $0.26 paid a year before.
Older payments of $0.61 to $0.82 in 2024 were paid before the fund’s 3-for-1 split in October 2024. That later drop in the per-share amount reflects the split.
The portfolio is concentrated. In the fund’s May 31, 2026, filing, the top 10 positions made up about 44% of $94.9 billion in net assets. Those filings come out on a lag, so holdings may have shifted since. The index rebuilds its lineup once a year, and this year’s reconstitution moved technology names into the top spots.
Four Largest Holdings and Where Coverage Thins
The largest position belongs to Qualcomm (NASDAQ:QCOM | QCOM Price Prediction), accounting for 7% and yielding 2.0%. Its $3.59 annual dividend uses about 41% of trailing earnings. That is solid coverage, though quarterly earnings fell 23% year over year.
The closest call is Texas Instruments (NASDAQ:TXN), which holds 6% in assets and has a yield of 2.0%. Its $5.62 dividend takes about 86% of trailing EPS of $6.57. The payout remains covered because profits are recovering: quarterly earnings grew 52% year over year. Still, that leaves little room for big raises until the earnings rebound continues.
At a 5% weight, UnitedHealth (NYSE:UNH) yields just 0.5%. Its dividend uses only about 14% of trailing EPS of $15.55. It has the safest coverage of the four, but it adds little income.
Coca-Cola (NYSE:KO) makes up 4% of the portfolio and carries a yield of 2.2%. It pays out about 62% of earnings, a normal level for a steady beverage business.
All four of the largest holdings yield less than the fund itself. When the heaviest weights pay the lowest yields, income per dollar invested shrinks even though no company cuts its dividend.
Strong Returns, Slower Paychecks
Over longer periods, the fund’s dividend-adjusted price is up 60% over five years and 253% over ten. Investors have noticed. Net assets rose from $71.6 billion at the end of 2025 to $94.9 billion by the end of May.
As mentioned, the Schwab fund’s distribution is safe. Every top holding covers its dividend from earnings, and trailing income is still growing. What has changed is the price of that income. When the share price rises faster than the payout, the yield falls, so each new dollar buys less income than it did a year ago.
Long-time holders received a large price gain and still collect a growing, if slower, income stream, while new buyers seeking retirement income are paying more for each dollar of dividends. The fund offers less to investors who need more than a 3% yield now or who want fast dividend growth.
Contact [email protected] for any questions or corrections.
Trey has been an editor and author at 24/7 Wall St. for more than a decade, where he has published thousands of articles analyzing corporate earnings, dividend stocks, short interest, insider buying, private equity, and market trends. His comprehensive coverage spans the full spectrum of financial markets, from blue-chip stalwarts to emerging growth companies.
Beyond 24/7 Wall St., Trey has created and edited financial content for Benzinga and AOL's BloggingStocks, contributing additional hundreds of articles to the investment community.
Trey's editorial expertise extends across multiple publishing environments. He served as production editor at Dearborn Financial Publishing and development editor at Kaplan, where he helped shape financial education materials. Earlier in his career, he worked as a writer-producer at SVE. His freelance editing portfolio includes work for prestigious clients such as Sage Publications, Rand McNally, the Institute for Supply Management, the American Library Association, Eggplant Literary Productions, and Spiegel.
Outside of financial journalism, Trey writes fiction and has been an active member of the writing community for years, moderating workshop sessions at regional conventions.