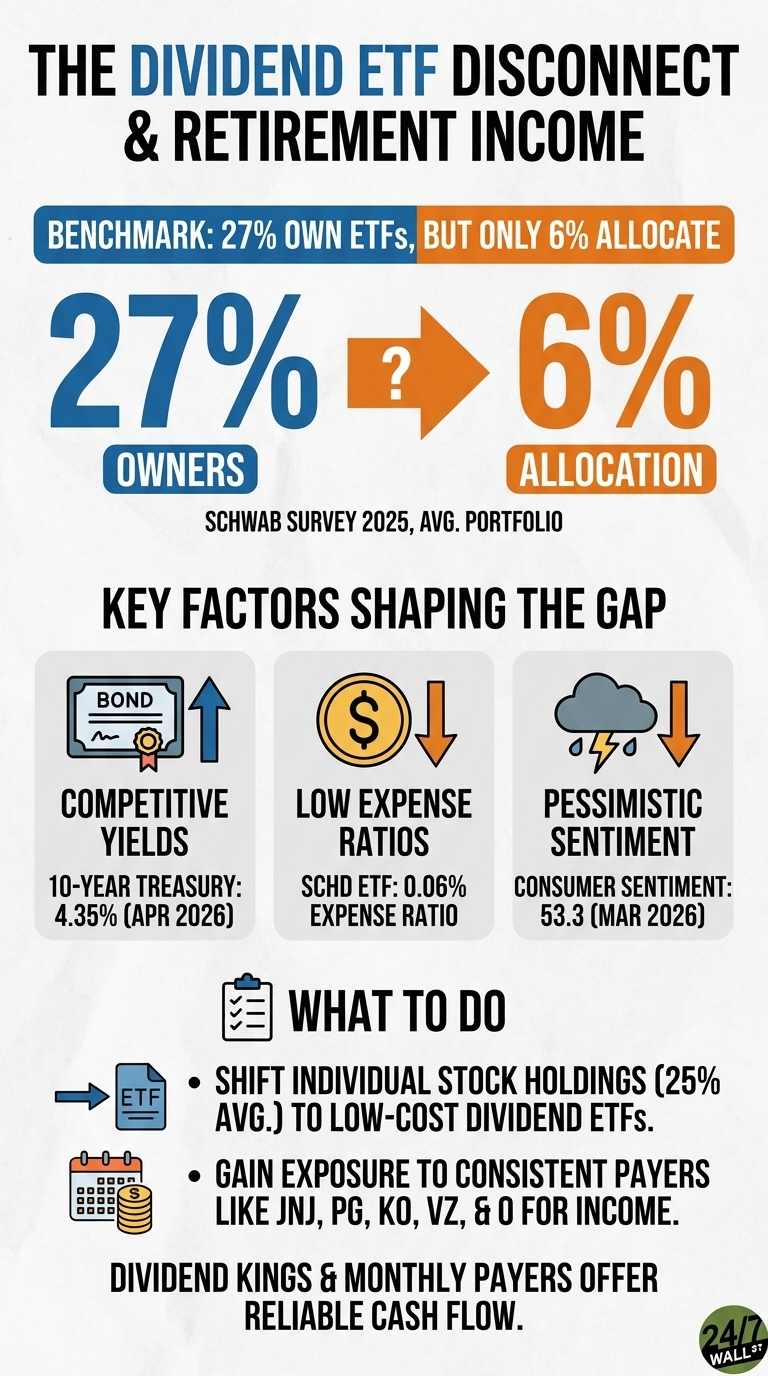
The Charles Schwab Modern Wealth Survey 2025 found that 27% of American investors own ETFs, yet those funds account for only 6% of the average portfolio. Individual stocks: 25%; mutual funds: 13%; cryptocurrency: 10%. The mismatch matters most for pre-retirees, because dividend-focused ETFs package the income-producing equity asset class into a single low-cost holding that can carry retirement cash flow once paychecks stop.
The 27% Own, 6% Allocate Disconnect
Owning an ETF and weighting an ETF are different decisions; there shouldn’t be any question. The Schwab survey covered 2,400 adults from April 24 to May 23, 2025, and the allocation data suggest ETFs are treated as small satellite positions rather than core holdings. The 10-year Treasury yields 4.35% as of April 27, 2026, setting a benchmark interest rate that portfolios must meet. Diversified dividend equity baskets have historically cleared it while also growing the payout over time, an option fixed-coupon Treasuries cannot match.
What a Dividend ETF Actually Holds
The Schwab U.S. Dividend Equity ETF (NYSEARCA:SCHD) illustrates the structure as the fund manages $71.6 billion in net assets at a 0.06% expense ratio, with top holdings spread across healthcare, energy, telecom, defense, and consumer staples. Verizon sits at 4.03% of the fund and Coca-Cola at 3.97%, alongside big names like Bristol-Myers, Merck, ConocoPhillips, Lockheed Martin, Chevron, AbbVie, Cisco, and Altria. The fund has a low expense ratio: a 0.04% net expense ratio, below that of most actively managed mutual funds in the same survey allocation bucket.
The Schwab fund has returned 26.13% over the past year and 228.15% over the past ten years on a price basis, with quarterly distributions added. The mechanical rebalancing tilts the fund toward companies with sustained dividend track records, removing the single-stock judgment call of picking individual names.
The Individual Names Inside the Asset Class
Johnson & Johnson (NYSE:JNJ | JNJ Price Prediction) lifted its quarterly payout to $1.34 per share, declared April 14, 2026, extending a streak of consecutive annual increases that runs more than six decades. Procter & Gamble (NYSE:PG) has paid dividends since 1890 and raised its quarterly distribution to $1.0885 in April 2026, up from $1.0568.
Coca-Cola (NYSE:KO) yields 2.66% with a quarterly dividend of $0.53, raised in Q1 2026 from $0.51, and shares are up 12.36% over the past year. Verizon Communications (NYSE:VZ) pays a quarterly dividend of $0.7075 and has a one-year price return of 19.01%.
Realty Income (NYSE:O) pays monthly rather than quarterly and yields 5.08%, with an annualized payout of $3.219 per share. The REIT has raised its dividend across more than 100 consecutive quarters and currently distributes $0.2705 per share each month. Shares are up 17.27% over the past year.
What an Income-Heavier Sleeve Looks Like
Closing the 6% allocation gap involves redistributing within the existing equity sleeve. A pre-retiree holding the survey-average 25% in individual stocks and 6% in ETFs could shift part of the stock sleeve into a dividend-equity ETF, gaining exposure to 100-plus dividend-paying stocks in a single position. Consumer sentiment sits at 53.3 in March 2026, in pessimistic territory, which historically pushes investors toward cash rather than yield-producing equities even when long-horizon income math runs the other way.
Portfolio Composition Considerations
For investors evaluating the gap between ETF ownership and allocation weight, brokerage statements show ETF holdings as a share of total portfolio value. A reading near 6% matches the survey average. Expense ratios are another reference point: SCHD’s 0.06% and VYM’s 0.04% sit well below those of most actively managed mutual funds. Distribution cadence also varies across asset classes as Realty Income pays monthly, while JNJ, PG, KO, and Verizon pay quarterly, a mix that has historically smoothed income across every month of the year.
Contact [email protected] for any questions or corrections.