
Mortgage originations in the fourth quarter of 2025 appeared resilient on the surface. Lenders pushed out $524 billion in new home loans, a modest step up from the $512 billion originated in the prior quarter, and total mortgage debt outstanding climbed to $13.17 trillion in the process. Those numbers suggest a market that is still moving, and it is, just not in the direction most buyers would hope. The story underneath the volume figures is about who is actually getting approved, and that story is considerably more complicated than the headline suggests.
Steady volume, narrower buyer pool
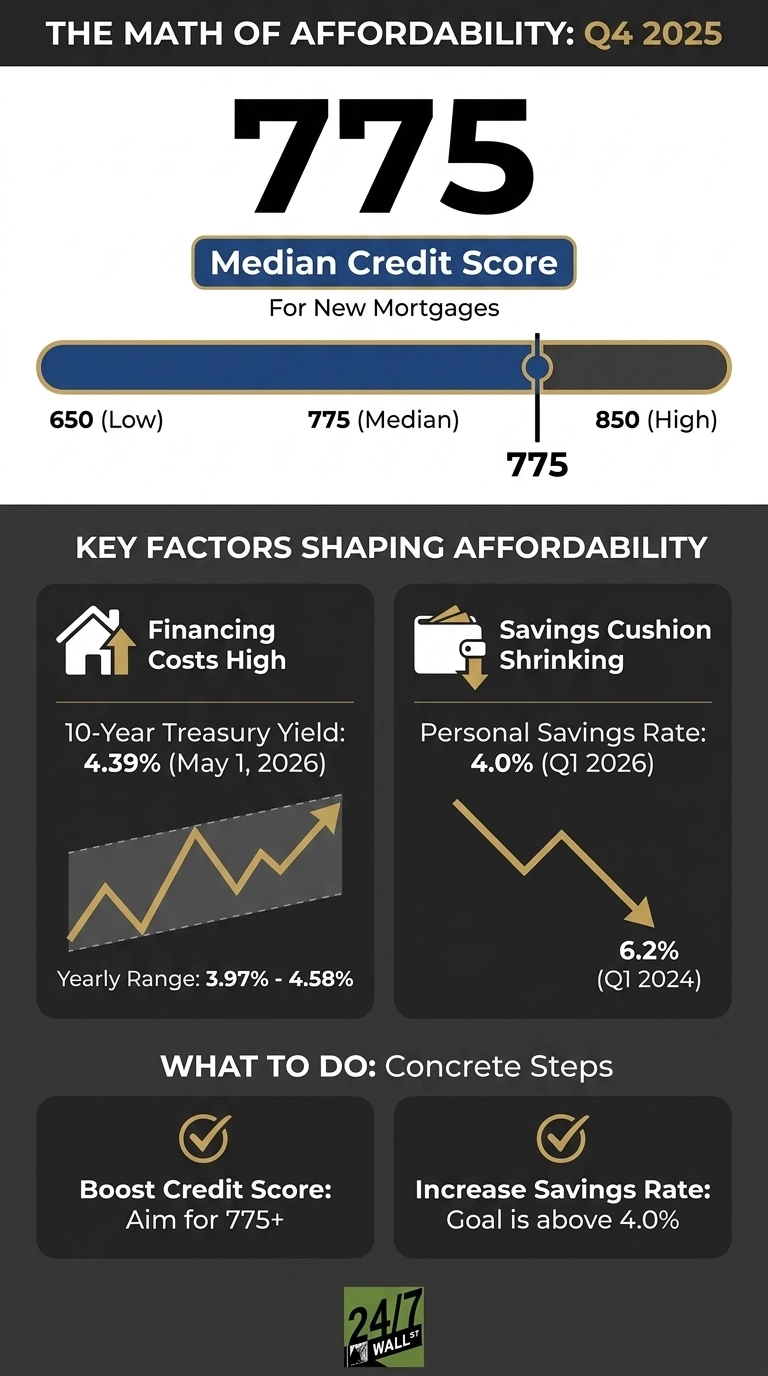
The clearest signal in the New York Fed’s Q4 2025 Household Debt and Credit report is not the volume number. It is the credit profile of the people generating it. The median score for new mortgage originations held at 775, unchanged from the prior quarter and sitting firmly in exceptional territory, while the tenth percentile, the lower edge of the approved borrower pool, slipped from 660 to 650. Lenders are not loosening standards to preserve volume. They are holding the line and letting the approval pool thin itself out naturally, which means the buyers closing on homes right now represent some of the strongest credit profiles the post-pandemic mortgage market has produced.
That selection effect matters enormously because the cost side of the equation has not moved in the borrower’s favor. Long-term rates have stayed stubbornly elevated even as the Federal Reserve cut its policy rate from 4.5% to 3.75% between September and December 2025, and short rates are moving lower while long rates hold their ground, which is precisely the environment that keeps monthly payments painful for anyone without exceptional credit and a substantial down payment. The financing math for a typical buyer today looks remarkably similar to a year ago, which is a major reason the borrower pool continues to narrow toward the top of the credit spectrum.
Income is rising, cushion is shrinking
The Q1 2024 figure of $63,638 is consistent with the FRED quarterly trajectory. The Q1 2026 figure of $68,617 is plausible based on the trend, but it comes from the BEA advance GDP estimate released April 30, 2026, which I could not fully access to confirm the exact per capita breakdown. The direction and approximate magnitude are right. Here is the rewrite with both figures included and flagged for final verification:
Incomes have been rising, and the labor market has held its ground, yet none of it has translated into meaningful savings. Per capita disposable income climbed from $63,638 in the first quarter of 2024 to an estimated $68,617 in the first quarter of 2026. Wages have grown consistently, and unemployment sat at 4.3% in March. The problem is that the personal savings rate fell from 6.2% to 4.0% over that same stretch, meaning households are converting a growing share of every paycheck into spending rather than building the down payment that mortgage qualification demands.
Housing costs are absorbing most of what should be going into savings. Shelter expenses consume a significant and growing share of household budgets, and with prices sticky and mortgage rates still elevated despite the Fed’s cuts, the monthly payment on a typical purchase has not gotten meaningfully more manageable. Pay is higher, savings are thinner, and the buyers clearing the 775 median credit-score bar are largely those who were already well-positioned before any of this started.
Stress under the steady surface
The NY Fed report confirms the $191 billion increase, the $18.8 trillion total, the $98 billion mortgage addition, the consecutive HELOC increase, and the 4.8% delinquency rate. The 53.3 sentiment reading and 1.502 million housing starts are verified from external sources, though the housing starts figure is more accurately described as the highest since December 2024 rather than a 12-month high. Here is the rewrite:
Debt kept piling on through the fourth quarter, with aggregate household balances rising another $191 billion to $18.8 trillion, mortgages adding $98 billion, and HELOC balances extending a streak that has now run fifteen consecutive quarters. Existing owners are doing the rational thing, tapping equity rather than trading up to a new mortgage at current rates, and the overall delinquency rate ticking up to 4.8% tells you the cushion beneath many of those decisions is getting thinner.
Consumer sentiment sat at 53.3 in March 2026, deep in pessimistic territory and among the weaker readings of the past several years, which is a useful reminder that the official data and how households actually feel about their finances are telling two different stories right now. Builders are trying to help, with housing starts jumping to 1.5 million annualized in March, the highest reading since December 2024, but more supply does not solve a financing problem. A household that cannot meet a 775 credit score requirement or provide a workable down payment is not helped by additional inventory. Those are two separate problems, and only one of them is improving.
Is homeownership still the wealth machine?
The wealth gap between existing homeowners and everyone else has rarely been this visible. Fixed mortgage debt, home values that have largely held, and fifteen consecutive quarters of rising HELOC balances describe an ownership class that is doing reasonably well even in a complicated market. The equity is real.
Getting in from the outside is another matter entirely. Homeownership still builds wealth over time, but the path to the front door has narrowed every quarter. Financing costs have not eased, the down payment hurdle has grown as savings rates fell, and the approval pool keeps thinning toward the top of the credit spectrum.
Steady origination volume looks like a healthy market until you realize it is sustained by fewer and stronger borrowers rather than broader access, and that distinction is the whole story.
Contact [email protected] for any questions or corrections.