‘It’s Redneck Envy’: Dave Ramsey Defends Billionaires’ Yachts With Ratio Logic
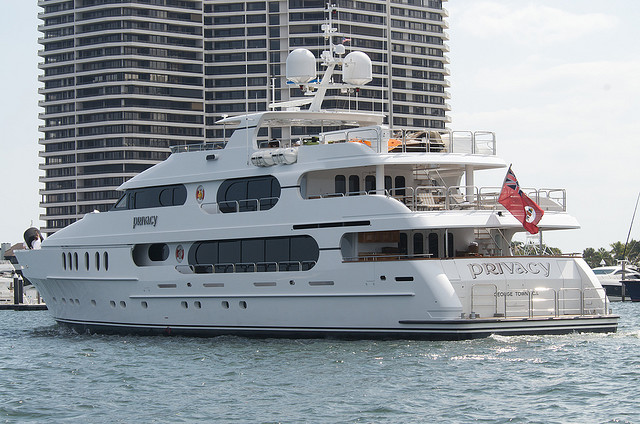
On a recent episode of Ramsey Everyday Millionaires, a caller asked whether a boat costing more than his annual income was too expensive. The host pivoted to defend Mark Zuckerberg's 387-foot superyacht, the Feadship-built Launchpad valued at roughly $300 million,…

This post may contain links from our sponsors and affiliates, and Flywheel Publishing may receive compensation for actions taken through them.

On a recent episode of Ramsey Everyday Millionaires, a caller asked whether a boat costing more than his annual income was too expensive. The host pivoted to defend Mark Zuckerberg’s 387-foot superyacht, a Feadship-built vessel called Launchpad valued at roughly $300 million, against the billionaire’s hundreds of billions in wealth, then turned his attention to his own audience. “No one should ever have a car that nice. There’s starving children somewhere. Like your car caused children to starve. Would you shut up?” He labeled the impulse “redneck envy” and mocked “oversaved people that think they’re Jesus” who believe “the only car you can drive and still be holy is a ’93 Camry.”
The stakes for any reader are concrete. Judge purchases by price tag rather than by ratio and two predictable mistakes follow. You either deny yourself purchases you can easily afford and die with a portfolio you never used, or you copy what wealthy people buy without copying the balance sheet underneath it and end up house-poor, boat-poor, or truck-poor.
The ratio is right, the threshold is what’s missing
Ramsey’s framing is mathematically sound. A purchase’s pain is a function of what percentage of your wealth and income it consumes. Run the Zuckerberg math: a $300 million yacht against a net worth of roughly $238 billion works out to about 0.13% of his wealth. The proportional equivalent for someone with a $500,000 net worth is a $650 jet ski. For someone with a $100,000 net worth, it is a $130 kayak. Worth noting: Launchpad’s annual running costs alone are estimated at $30 million, a figure that, at that same 0.13% ratio, translates to roughly $39,000 a year for a person with a $300,000 net worth.
That is the lens. Now apply it to the toys most readers actually consider. A $90,000 pickup truck purchased by someone with a $250,000 net worth represents 36% of everything they own, and it loses value every month. The same $90,000 truck purchased by someone with a $4 million net worth represents about 2%. Identical sticker price, wildly different financial event.
Ramsey’s own long-standing rule makes the threshold explicit: the total value of all motorized things you own (cars, boats, motorcycles, RVs) should not exceed half your annual gross income. On a $120,000 household income, that caps your combined toy fleet at $60,000. On a $60,000 income, the cap is $30,000. The reason is depreciation. Anything with a motor loses value, so the more of your income tied up in depreciating assets, the more of your wages are quietly evaporating each year. Ramsey pairs this with a second threshold: he advises against buying a brand-new car unless your net worth has reached at least $1 million.
The variable: liquid net worth, not paper net worth
The factor that changes the answer for almost every reader is which net worth number you plug into the ratio. Total net worth includes your primary residence, which you cannot spend without selling and moving. Investable net worth excludes the house and counts only retirement accounts, brokerage balances, cash, and other liquid assets.
Two readers with identical $800,000 net worths can be in completely different positions. Reader A has a $650,000 paid-off house and $150,000 in a 401(k). Reader B has a $200,000 house with a small mortgage and $600,000 invested. A $40,000 bass boat is 27% of Reader A’s investable assets and a serious bite. That same boat is roughly 7% of Reader B’s investable pile. Same boat, same buyer demographics, opposite financial reality.
Meta Platforms (NASDAQ:META | META Price Prediction) CEO Zuckerberg can write a check for a superyacht because his underlying wealth is concentrated liquid equity in a public company. The Bloomberg Billionaires Index placed his net worth at approximately $238 billion as of September 15, 2026, up from the roughly $222 billion Forbes cited on its 2026 Billionaires list earlier in the year. At either figure, a $300 million vessel represents a fraction of a percent of his balance sheet. Most middle-class buyers face the opposite situation: their net worth figures are dominated by a house they live in, which makes any toy ratio against spendable assets far worse than the headline number suggests. Meta reported full-year 2025 revenue of $200.97 billion, up 22% year over year, and then posted Q2 2026 revenue of $60.8 billion, up 28% from the same period a year earlier. That sustained top-line growth is the engine behind Zuckerberg’s wealth, even as rising AI infrastructure costs weighed on Q2 2026 earnings.
One maritime footnote is worth clarifying. In late 2025, Zuckerberg sold the original 220-foot Wingman support vessel to Walmart heiress Nancy Walton Laurie, who renamed it Kalm. Rather than simplify his fleet, he replaced Wingman with a larger 262-foot support yacht, formerly known as U-81, and transferred the Wingman name to the new acquisition. The Launchpad itself drew fresh attention in late May 2026, when it docked on Lake Union in Seattle just as Meta announced a round of layoffs affecting roughly 1,400 employees across the Seattle region. The yacht then made its way north to Alaska’s Auke Bay in July 2026, and by September 2026 had crossed the Pacific and arrived in Yokohama, Japan. Billionaires do reassess their assets, but in Zuckerberg’s case each reassessment has produced a bigger footprint, not a smaller one.
How to run the calculation on yourself
- Add up your investable net worth: retirement accounts, taxable brokerage, cash, and any business equity you could actually sell. Exclude your primary residence and personal vehicles.
- Take the price of the toy you are considering and divide it by that investable figure. If a depreciating purchase exceeds 5% of investable net worth, expect to feel it.
- Separately, add the price of the new toy to the resale value of every motorized thing you already own. If that sum is more than half your gross annual income, the math is telling you no.
- Compare against Ramsey’s positioning of wealth-building as the prerequisite for both enjoyment and generosity: “You live like no one else. Later you can live and give to the starving children like no one else.”
Judge the purchase by what it costs you as a fraction of what you have. That is the entire mechanic.
Editor’s note: This pass updated Zuckerberg’s net worth to approximately $238 billion per the Bloomberg Billionaires Index as of September 15, 2026, added Launchpad’s estimated $30 million annual running cost, replaced Q1 2026 Meta financials with the Q2 2026 results (revenue of $60.8 billion, up 28% year over year, reported July 29, 2026), and added context on the yacht’s May 2026 Seattle docking during Meta’s layoff announcements, its subsequent Alaska visit in July 2026, and its September 2026 arrival in Yokohama, Japan.
Contact [email protected] for any questions or corrections.
Joel South covers large-cap stocks, dividend investing, and major market trends, with a focus on earnings analysis, valuation, and turning complex data into actionable insights for investors.
He brings more than 15 years of experience as an investor and financial journalist, including 12 years at The Motley Fool, where he served as an investment analyst, Bureau Chief, and later led the Fool.com investing news desk. He has also co-hosted an investing podcast and appeared across TV and radio discussing market trends.