A retiree who wants $34,000 a year in pipeline income without filing a single K-1 schedule can get there with roughly $450,000 in master limited partnership ETFs. That implied yield, near 7.5%, sits comfortably within the range these funds currently throw off. The catch most retirees worry about, the K-1 tax form that direct MLP ownership generates, disappears inside the ETF wrapper.
Why the ETF Wrapper Changes the Math
Direct ownership of Energy Transfer (NYSE:ET | ET Price Prediction), Enterprise Products Partners (NYSE:EPD), or MPLX means a Schedule K-1 every spring, often delayed past the April deadline, and unrelated business taxable income headaches if held in an IRA. MLP ETFs issue a standard 1099-DIV instead. The Alerian MLP ETF (NYSEARCA:AMLP) is structured as a C-corporation, which creates a small tax drag at the fund level but eliminates every K-1 headache for the holder.
AMLP runs $11.8 billion in net assets with a 0.84% expense ratio. Energy Transfer, Enterprise, and MPLX together account for 38% of the portfolio. The Global X MLP ETF is a cheaper alternative at 0.77%, with the same three names making up 40.8% of holdings.
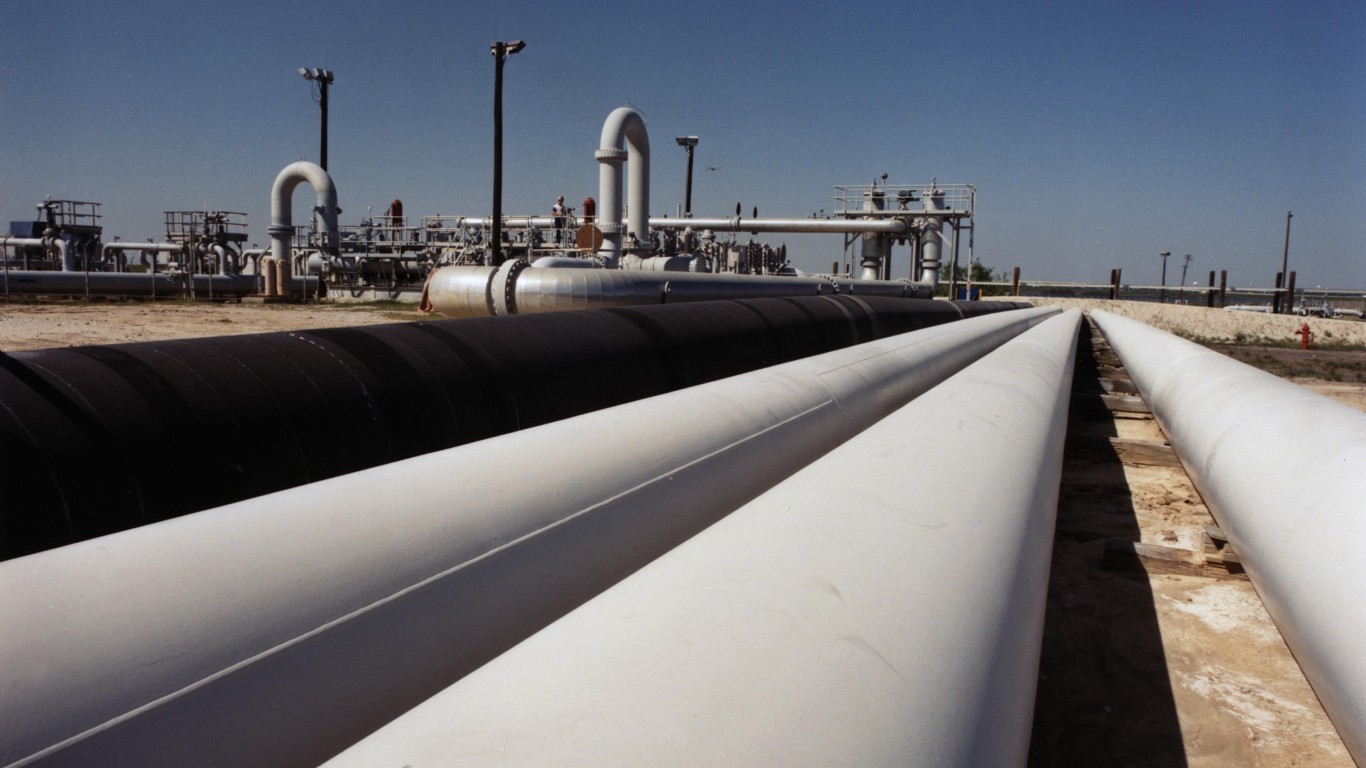
The Underlying Cash Flows Are Real
Enterprise Products Partners remains one of the sector’s most established income vehicles, recently extending its streak of annual distribution increases to 27 consecutive years with a $0.55 per-unit payout in the first quarter of 2026. MPLX continues to grow even faster, raising its quarterly distribution to $1.0765 per unit after two consecutive years of double-digit distribution growth and currently yielding about 7.5%. Energy Transfer increased its quarterly distribution to $0.3375 per unit for the May 2026 payment and yields roughly 6.9%, supported in part by expanding natural gas infrastructure tied to growing data-center demand.
Three Yield Tiers for a $34,000 Target
Same income, three different capital requirements. The lever is what you accept in exchange for a higher current payout.
- Conservative, 3.5% yield, about $971,000 of capital. Broad dividend growth ETFs or large-cap dividend equity funds sit here. The portfolio diversifies away from energy, distributions usually compound, and the principal is most likely to appreciate. The price is more than double the capital of the aggressive option.
- Moderate, 6% yield, about $567,000 of capital. The Global X MLP & Energy Infrastructure ETF lives near this tier, blending U.S. MLPs with C-corp pipelines such as Williams (9.4%), TC Energy (8.9%), Enbridge (8.3%), and Kinder Morgan (8.2%). Yields are lower than pure-MLP funds, but the larger-cap mix tends to absorb sector shocks more gracefully.
- Aggressive, 7.5% yield, $450,000 of capital. AMLP sits here. Concentration risk is real, sector-correlated, and the C-corp tax drag clips long-run total return. Distributions can fluctuate with midstream cash flow cycles.
Current Income vs. Future Income
The tradeoff in income investing is rarely yield alone. A portfolio yielding 7.5% generates more cash flow today, but a lower-yield investment with faster distribution growth can eventually catch up and surpass it. A 3.5% yield growing at 8% annually roughly doubles its income stream in nine years. On a $450,000 starting balance, the lower-yield, faster-growing portfolio may begin with a smaller payout but can generate more cumulative income over a long retirement horizon. The choice ultimately comes down to current income needs versus future income growth.
Recent performance has helped support the sector. Energy Transfer has gained roughly 21% year to date, Enterprise Products Partners about 20%, and MPLX approximately 7%, benefiting from continued growth in U.S. natural gas demand and infrastructure investment. Strong price appreciation can enhance total returns, but it also tends to reduce the yield available to new investors.
What to Do With This
- Cap MLP ETF exposure at 10% to 15% of the total portfolio. Pipeline cash flows are stable, but they all move together when energy sentiment turns.
- Compare AMLP’s distribution history against a broader dividend growth ETF over the past decade to see the compounding gap on $450,000.
- Model the C-corp tax drag inside AMLP against the K-1 paperwork cost of holding ET, EPD, and MPLX directly. For most retirees outside the top bracket, the 1099 simplicity wins.
Contact [email protected] for any questions or corrections.