How Much Do You Need Invested by 50 to Retire on Dividends at 60?
Retiring on dividends at 60 sounds straightforward until you realize the yield tier you choose today could mean the difference between an income stream that doubles over a decade and one that quietly erodes your nest egg.

This post may contain links from our sponsors and affiliates, and Flywheel Publishing may receive compensation for actions taken through them.

The decade between 50 and 60 is the last real window to build a dividend income stream before paychecks stop. If you want your portfolio to replace the $78,535 average annual household spending reported by the BLS for 2024, or match a comfortable $100,000 target, the math is simple: income target divided by yield equals the capital you need at 60.
Two benchmarks anchor the discussion. Per capita disposable personal income was $68,958 in Q2 2026, so $60,000 is close to the national median and $100,000 sits comfortably above it. With the 10-year Treasury yielding about 4.6%, any equity dividend strategy must justify itself against that risk-free hurdle.
The Conservative Tier: 3% to 4% Yield
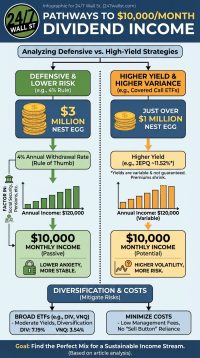
This is the dividend growth lane. Broad-market dividend funds, quality compounders, and Dividend Kings live here. To generate $60,000 at a 3.5% yield, you need roughly $1,714,000. For $100,000, roughly $2,857,000. At a 4% yield, $60,000 requires $1,500,000 and $100,000 requires $2,500,000.
Johnson & Johnson (NYSE:JNJ | JNJ Price Prediction) is the archetype. Its 2.0% yield looks modest, but the story is the growth: 64 consecutive years of dividend increases, with the quarterly payout stepping from $1.19 in 2023 to $1.34 today. The stock has also delivered a 173% total return over the past 10 years. Microsoft (NASDAQ:MSFT) sits at the extreme end with a 0.8% yield but a 10-year price gain of roughly 874%: a capital appreciation engine that grows the dividend base rather than paying you now.
The tradeoff: highest capital requirement, but the income stream compounds and principal typically appreciates. This is the sleep-at-night tier.
The Moderate Tier: 5% to 7% Yield
REITs, preferreds, covered-call ETFs, and higher-yielding equity funds live here. At 6%, $60,000 requires $1,000,000 and $100,000 requires roughly $1,667,000.
SBA Communications (NASDAQ:SBAC) is a cell-tower REIT that just raised its quarterly dividend from $1.11 to $1.25 and carries a 2.7% yield. CEO Brendan Cavanagh said the company expects “to continue growing our dividend at the highest growth rate in the industry while investing in our portfolio.” But the price story is a warning: SBAC is down roughly 43% over five years. Equinix, the data-center REIT riding the AI infrastructure buildout, pays $5.16 quarterly ($20.64 annualized) and has grown its dividend from $1.75 per quarter in 2016 to $5.16 today.
The tradeoff: less capital required, but yields in this range often signal slower dividend growth or higher rate sensitivity.
The Aggressive Tier: 8% to 14% Yield
Business development companies, mortgage REITs, leveraged covered-call funds, and high-yield bond funds populate this tier. At 10%, $60,000 needs $600,000 and $100,000 needs $1,000,000. At 12%, the numbers drop to $500,000 and $833,000.
The catch is durability. Distributions in this tier get cut when credit cycles turn, and net asset values often drift lower over time. You are frequently spending down the asset itself rather than living off its growth.
What Most 50-Year-Olds Miss
A 10-year runway is exactly the window where dividend growth beats static yield. Consider Littelfuse, which just raised its dividend roughly 7% from $0.75 to $0.80 quarterly, or BOK Financial, which stepped its quarterly payout from $0.57 to $0.63 in 2026. A 3.5% starting yield that grows 8% a year roughly doubles the income in nine years. A 12% yield that flatlines or gets trimmed stays put or shrinks. On the same $1.7 million portfolio targeted at $60,000, the dividend-growth version can be paying $110,000 to $120,000 by year 10 while the high-yield version is still writing the same check, or a smaller one.
Wes Moss, discussing a caller planning a 4% dividend strategy in retirement, put it plainly: “dividend investing is how I like to invest, particularly when you’re thinking about your retirement years and you need to start taking income.”
Three Actions to Take Before 51
- Calculate actual spending instead of salary replacement. The BLS pegs average annual household expenditures at $78,535 for 2024. Once the mortgage is gone and payroll taxes stop, your real replacement number is often 60% to 75% of gross income.
- Compare 10-year total returns of a dividend-growth fund against a high-yield fund. Include reinvested distributions. The gap between the two is the compounding effect the yield table hides.
- Model taxes by bracket and state. Qualified dividends and REIT distributions are taxed differently, and a high-tax state can shift the optimal tier. If you are within five years of retirement, run the numbers on Roth conversion capacity during the gap years between 60 and Social Security.
Contact [email protected] for any questions or corrections.
I am a long time investor and student of business, and believe finding good companies that can become great investments is the best game on earth. After 20 years of writing and researching the public markets it is clear that individuals have never had more tools and information to take control of their financial lives. From ETFs and $0 commissions to cryptos and prediction markets there has never been a greater democratization of access to investing.
I write to help people understand the investments available to them so they can make the best choice for their portfolio, whether they're starting out or looking for income in retirement.