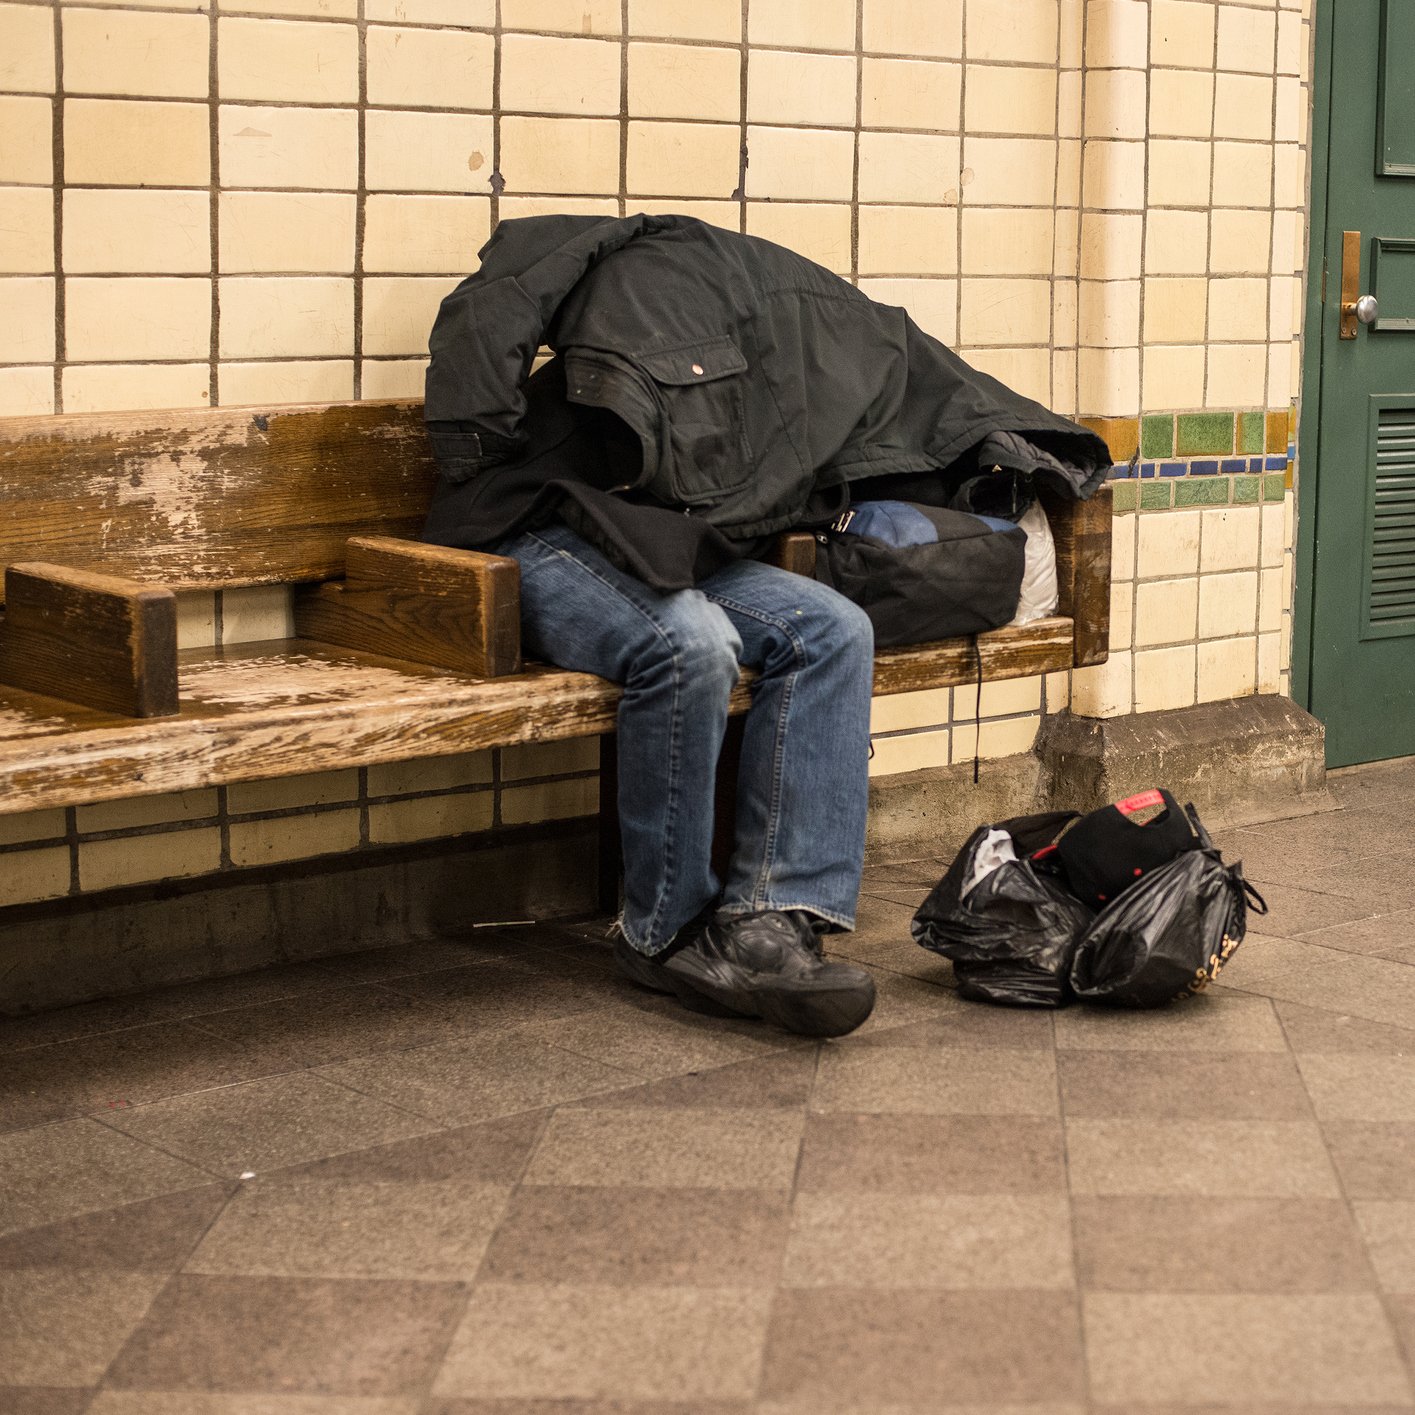
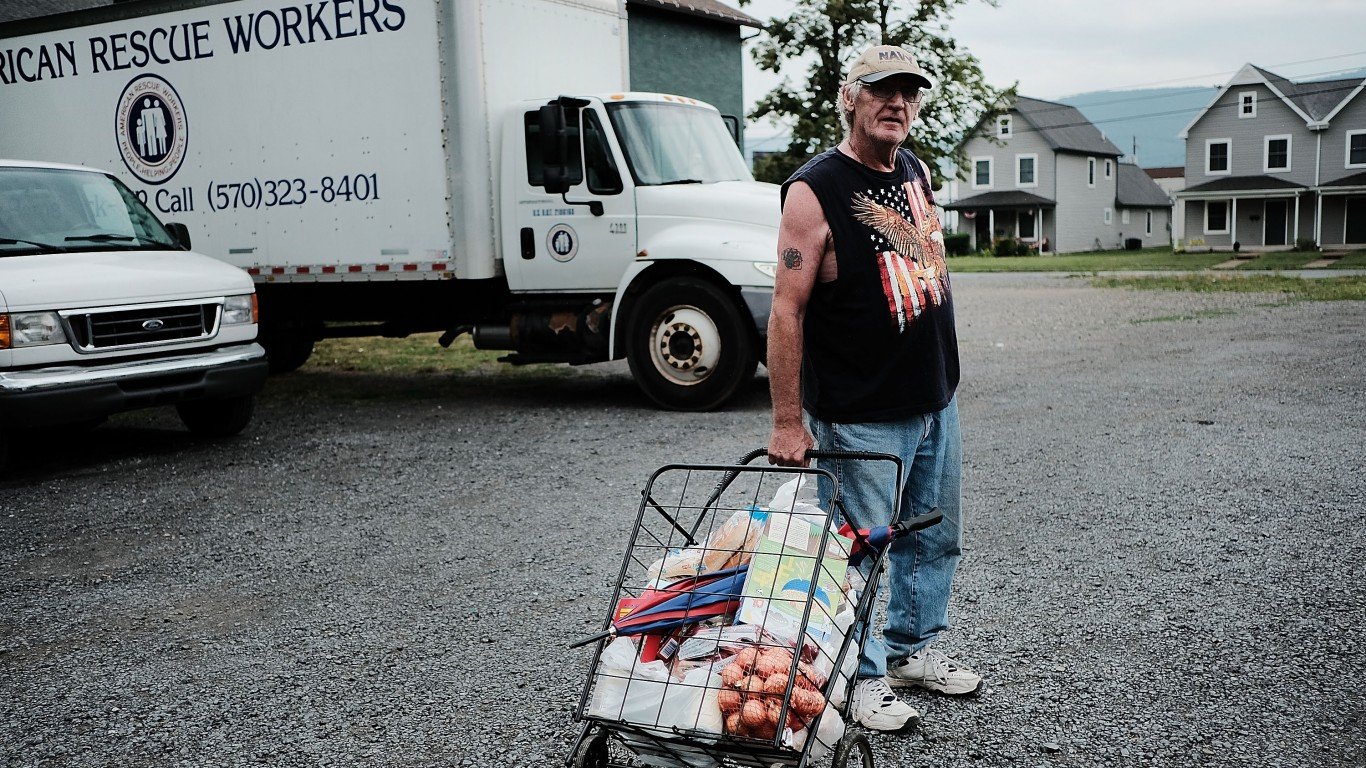
The U.S. federal poverty line has been determined using the same general framework since the mid-1960s. In that time, the official measure has come under criticism as an inadequate way to measure the number of people truly in need.
In 1995, a National Academy of Sciences panel made recommendations for how an alternative poverty measure could be developed. Since then, the Census Bureau has worked in partnership with the Bureau of Labor Statistics to further these recommendations. The result was the supplemental poverty measure, which produces state level poverty rates that differ considerably from the official poverty measures.
Compared to Mississippi’s official poverty rate of 20.7% between 2011 and 2013, the supplemental poverty rate was more than five percentage points lower during that time. In California, the supplemental poverty rate was 7.4 percentage points higher and, at 23.4%, the highest in the nation. Based on recently released data from the Census Bureau, these are the states where the poor are undercounted most.
In an interview with 24/7 Wall St., Sheldon Danziger, president of the Russell Sage Foundation, said “It’s been common wisdom among researchers since at least the 1970s that we should rethink the official poverty measure.” Danziger added that the supplementary measure improves understanding of poverty by including items such as the earned income tax credit and food stamp benefits.
Kathleen Short, economist at the Census Bureau and author of its report on the supplemental poverty measure, explained, “The important feature of that measure is that it includes a lot of the non-cash benefits that we have in the United States to help families with low incomes.” Short added that this is useful for policymakers because it allows them “to get a better idea of how effective our safety net is for helping people.”
One of the primary differences between the supplemental poverty measure and the official one is housing costs. The supplemental measure is adjusted to reflect local housing costs, whereas the official poverty measure is not. According to Short, this is one of the major factors that can push up poverty rates in many states under the supplemental measure.
In fact, of the 10 states with the highest increases in poverty under the supplemental poverty measure, eight also had among the 10 highest costs of living. Further, in seven of these states, the relative cost of renting an apartment was also among the 10 highest nationally. The two states with the largest increases in poverty under the supplemental measure — California and Hawaii — were also the top two states in terms of the cost of renting a home.
Still, the role of non-cash benefits programs is very important in shaping the supplemental poverty levels in many states. For example, in many of these states residents are far less likely to receive an earned income tax credit. The Internal Revenue Service (IRS) estimates that 79% of eligible Americans filing tax returns received a credit in the 2010 tax year, the most recent year for which data is available. However, in many of the states where poverty is most undercounted, the percentage of eligible filers receiving a credit is far lower. In Nevada, just 71.5% claimed their credit, while in California just 71% did, among the lowest rates in the U.S.
High levels of out-of-pocket medical expenses are also a factor contributing to higher supplemental poverty levels in many states. In fact, according to the Census Bureau, 11 million Americans fall into poverty under the supplemental measure because of these expenses, more than for any other reason. While some states where the poor are undercounted have high rates of health insurance coverage, others do not. Notably, in Nevada and Florida, 20.7% and 20% of the states’ populations were uninsured, respectively, as of 2013. These were the second- and third-highest rates in the nation.
In addition to the huge role played by out-of-pocket medical costs, Beth Mattingly, director of research on vulnerable families at the Carsey School of Public Policy, identified work-related costs as another expenditure that leads many families to struggle. Mattingly said that much of these costs are related to transportation, which can be high for people who live in cities, as well as in rural areas. In cities, “to take the train, then take the bus, it really adds up,” Mattingly said. Yet, in more rural areas, long drives, and the wear-and-tear on vehicles can also increase costs.
In order to determine the 10 states where the poor are undercounted most, 24/7 Wall St. reviewed data from the Census Bureau’s recent release, “The Supplemental Poverty Measure: 2013.” We then ranked states on the difference between the supplemental poverty and the official poverty measure. The supplemental measure uses an updated definition of households, as well as poverty thresholds that incorporate area housing costs. Further, while the official poverty rate is calculated using gross before-tax cash income, the supplemental measure is adjusted for noncash benefits, taxes and tax credits, work expenses, out-of-pocket medical costs and child support payments.
Data on Social Security, cash public assistance, Supplemental Security Income, SNAP benefits — or food stamps — and other factors included in measuring the social safety net are from the Census Bureau’s 2013 American Community Survey. Data on Unemployment Insurance claims are from the Department of Labor. Data on Earned Income Tax Credits are from the IRS. EITC participation rates are as of the 2010 tax year, while average EITC amounts are for the 2013 tax year. Figures on regional price parities — representing the differences in cost of living and cost of rent — are from the Bureau of Economic Analysis for 2012.
These are the states where the poor are undercounted most.
10. Connecticut
> Supplemental poverty rate 2011-2013: 12.5% (17th lowest)
> Official poverty rate: 10.7% (7th lowest)
> State price level: 6th highest
> Pct. without health insurance: 9.4% (8th lowest)
Based on pre-tax income alone, 10.7% of Connecticut residents lived in poverty between 2011 and 2013, one of the lower rates nationwide. Based on the supplemental poverty measure, however, 12.5% of state residents lived in poverty, still among the lower rates, but the 10th largest deviation from a state’s official poverty rate in the country. The supplemental poverty rate tends to be higher among older Americans. With the help of the nation’s third highest average social security payment, however, retirement-aged Connecticut residents had incomes of $26,581 on average, more than in all but a handful of states. The average earned income tax credit was $2,140 in Connecticut last year, one of the lower rates.
9. New Hampshire
> Supplemental poverty rate 2011-2013: 10.5% (7th lowest)
> Official poverty rate: 8.3% (the lowest)
> State price level: 9th highest
> Pct. without health insurance: 10.7% (12th lowest)
New Hampshire had the nation’s lowest average official poverty rate from 2011 to 2013, at just 8.3%. Although using the supplemental poverty rate, 10.5% of state residents lived in poverty in that time, this was still among the lowest rates in the nation. Among the factors that may contribute to the state’s higher supplemental poverty rate is the low average earned income tax credit.The average refunded amount was just $1,926 in the latest tax year, lower than in any state except for Vermont.
8. Massachusetts
> Supplemental poverty rate 2011-2013: 13.8% (22nd highest)
> Official poverty rate: 11.5% (14th lowest)
> State price level: 7th highest
> Pct. without health insurance: 3.7% (the lowest)
Massachusetts residents are some of the nation’s wealthiest, and the state does not lack generous social programs. Less than 4% of state residents didn’t have health insurance last year, for example, the lowest rate of any state. Despite the state’s support structures and high incomes, there is a large gap between the official poverty rate and the poverty rate that also considers social programs and the cost of living. Massachusetts had one of the nation’s highest costs of living as of 2012, and was one of the most expensive state in which to rent a home.
7. Virginia
> Supplemental poverty rate 2011-2013: 13.6% (24th highest)
> Official poverty rate: 10.9% (10th lowest)
> State price level: 10th highest
> Pct. without health insurance: 12.3% (20th lowest)
Under the official poverty measure, about 880,000 Virginia residents, or 10.9%, lived in poverty between 2011 and 2013. This was the 10th lowest rate in the nation. However, under the supplemental poverty measure, nearly 1.1 million Virginians, or 13.6%, lived in poverty in that time, 211,000 higher than the official measure. Moreover, the supplemental poverty rate was among the top half of all states. Among the factors that may contribute to this disparity are the relatively low share of households participating in federal social safety net programs. Just 28.3% of households received Social Security payments last year, 10% of households received food stamps, and 4.1% received Supplemental Security Income, in each case among the bottom 15 states nationwide.
6. Maryland
> Supplemental poverty rate 2011-2013: 13.4% (25th highest)
> Official poverty rate: 9.9% (2nd lowest)
> State price level: 5th highest
> Pct. without health insurance: 10.2% (10th lowest)
Less than 10% of Maryland residents lived below the official poverty line last year, lower than in every state except for New Hampshire. Yet, after taxes and supplemental measures were taken into account, this rate increased 3.5 percentage points. Maryland residents are exceptionally wealthy. For example, an average retirement-aged resident had an income of $30,678 in 2013, the highest nationwide. Despite the relatively high retirement income, poverty among Maryland seniors was more than twice as high based on the supplemental measure than under the official measure, according to a 2013 report from the Kaiser Family Foundation.
5. Nevada
> Supplemental poverty rate 2011-2013: 20.0% (2nd highest)
> Official poverty rate: 16.3% (13th highest)
> State price level: 21st highests
> Pct. without health insurance: 20.7% (2nd highest)
Nevada’s average poverty rate from 2011 to 2013 using the supplemental poverty measure was 20%, the second highest in the nation. One reason for the high rate may be the state’s relatively low EITC participation rate. Just 71.5% of eligible income tax filers claimed an earned income tax credit in the 2010 tax year, among the lowest rates nationwide. Additionally, many households may have to contend with high levels of out-of-pocket medical expenses. Last year, 20.7% of residents did not have health care coverage, the second highest rate in the nation. According to the Census Bureau, under the supplemental poverty measure, out-of-pocket medical costs are the top reason people fall into poverty.
4. Florida
> Supplemental poverty rate 2011-2013: 19.1% (3rd highest)
> Official poverty rate: 15.1% (18th highest)
> State price level: 16th highest
> Pct. without health insurance: 20.0% (3rd highest)
When supplemental measures were taken into account, nearly 20% of Florida residents lived in poverty — not only one of the largest deviations from the official poverty rate, but also nearly the highest supplemental poverty rate in the country. High out-of-pocket medical expenses likely explain in part the high supplemental poverty rate in the state, as one in five residents didn’t have health insurance in 2013, nearly the highest rate nationwide. Between 2011 and 2012, 58% of school-age children were eligible for free or reduced lunch. While this was one of the highest rates in the country, it clearly was not enough to offset the state’s poverty level.
3. New Jersey
> Supplemental poverty rate 2011-2013: 15.9% (12th highest)
> Official poverty rate: 10.7% (7th lowest)
> State price level: 3rd highest
> Pct. without health insurance: 13.2% (24th lowest)
New Jersey had one of the nation’s lowest official poverty rates, at just 10.7% between 2011 and 2013. However, using the supplemental poverty measure, 15.9% of state residents lived in poverty during that time, 12th highest in the country. High prices may be one factor contributing to the area’s higher supplemental rate. As of 2012, New Jersey had the third highest price level of any state, and the fourth highest cost of renting a home. The relatively few individuals claiming an earned income tax credit, as well as the low levels of households receiving food stamp benefits, may play a role in the state’s high supplemental poverty rate as well. Taxes, too, may have played a role. As of fiscal year 2011, New Jersey had the nation’s second highest state and local tax burden, behind only New York, according to the Tax Foundation.
2. Hawaii
> Supplemental poverty rate 2011-2013: 18.4% (5th highest)
> Official poverty rate: 12.4% (18th lowest)
> State price level: the highest
> Pct. without health insurance: 6.7% (2nd lowest)
Like a majority of states where poverty is worse than it seems, Hawaii residents aged 65 and older were more than twice as likely to live in poverty when supplemental measures were considered, according to a 2013 Kaiser Family Foundation study. Hawaii’s exceptionally high costs of living explain the difference between poverty rates under the official and supplemental poverty measures. Hawaii’s average cost of rent in 2012 was 60% more expensive than the average nationwide and the highest of any state. Because of geographical constraints, Hawaii’s utility costs are also among the nation’s highest. Electricity is supplied primarily by power plants fueled by petroleum, which is imported into the state.
1 California
> Supplemental poverty rate 2011-2013: 23.4% (the highest)
> Official poverty rate: 16.0% (15th highest)
> State price level: 4th highest
> Pct. without health insurance: 17.2% (8th highest)
In no state was the gap between the official poverty rate and the supplemental poverty rate wider than in California. Between 2011 and 2013, an average of 16% of residents earned incomes below the poverty line, one of the higher rates in the nation. Once taxes, cost of living, and non-cash income were taken into account, the poverty rate rose to 23.4%, the highest supplemental poverty rate nationwide. California’s high cost of living is the largest force pushing state residents into poverty. The cost of rent relative to the rest of the nation was higher than in every state except for Hawaii in 2012. Every day items are also more expensive in California than in the vast majority of states. And despite a wide-ranging need for government assistance, just 9.4% of households received food stamps last year, one of the lowest rates.
Contact [email protected] for any questions or corrections.