The number of fatal injuries resulting from motor vehicle accidents has dropped significantly over the last 10 years. In 2003, 42,884 were killed in motor vehicle accidents. By 2013, that number dropped to 32,719. While the death rate across the country for 2013 was roughly one out of every 10,000 U.S. residents, the fatality rate varied considerably state by state.
Only Texas had more than 3,000 fatal road accidents. However, after adjusting for population, many states had a significantly higher rate of fatal accidents than Texas. To rank the most dangerous states to drive in, 24/7 Wall St. reviewed state by state fatality data from the Insurance Institute of Highway Safety (IIHS) along with rural and urban travel data provided by the Federal Highway Administration (FHA). With 22.6 roadway fatalities for every 100,000 residents, Montana is the most dangerous state in the country to drive. By contrast, the corresponding rate in Massachusetts is 4.9 fatalities for every 100,000 residents, making it the safest state in the country to drive.
Click here to see the most dangerous states to drive in.
Many of the most dangerous states to drive in share several characteristics. In an interview with 24/7 Wall St., Russ Rader, a spokesman for the IIHS, explained that the most significant factor that differentiates the safest states from the most dangerous ones is how urban or rural it is. According to Rader, nearly across the board, “rural states have higher fatality rates than urban ones.”
In fact, in four out of the five most most dangerous states, well over half of all miles driven in 2013 were in rural areas. By contrast, in 22 of the 25 safest states, less than half of all miles driven were through rural areas. Rader explained that this makes a difference because on rural roads, “speeds are higher and there are more two lane roads (where) risk is greater for head-on collisions.” By contrast, in urban areas, “speeds are lower, there’s more congestion, and that means that fatal crashes are less likely.”
The choices an individual makes as a driver or passenger of a vehicle also matter a great deal. One of the most obvious ways to reduce the likelihood of a fatality in the event of an accident is to buckle up. Seatbelt use tends to be lower in states with the highest rate of roadway fatalities, and the opposite is true in states with the lowest rates of death on the road. Nationwide, about 87% of people use a seatbelt when riding in a passenger vehicle. In 10 of the 15 safest states to drive in, seatbelt use is greater than or equal to the national rate. Conversely, seatbelt use is below the national rate in 12 of the 15 most dangerous states, including Idaho, where only 62% of residents buckle up, the lowest rate of any state in the country.
To rank the safest and most dangerous states to drive in, 24/7 Wall St. reviewed state by state fatality data from the IIHS along with urban and rural travel data provided by the FHA, each for 2013. The number of fatal roadway deaths was then adjusted for population, noted as fatalities per 100,000 residents. Penalties for alcohol impaired driving by state were provided by WalletHub. Fatal injuries due to vehicle accidents include pedestrian and cyclist fatalities.
These are the most dangerous states to drive in.
Correction: A previous version of this article incorrectly represented a data set — drivers killed with known BAC (blood alcohol content) — as the proportion of drivers killed in a car crash that had alcohol in their blood. In fact, the data set — which came from IIHS — only refers to the share of drivers killed that were tested for a BAC, and makes no claim about whether these drivers had alcohol in their system.
50. Massachusetts
> Road deaths per 100,000: 4.9
> Total roadway fatalities in 2013: 326
> Pct. of residents using seatbelt: 75%
With 4.9 deaths on the road for every 100,000 residents, Massachusetts is the safest state in the country to drive in. Across the country, drivers are more likely to get into deadly accidents on rural roads than on urban ones. In the nation’s safest state for driving, just 5% of all driving is done in rural areas. Such a small portion of rural driving may account for Massachusetts rank as the safest place to drive.
49. New York
> Road deaths per 100,000: 6.1
> Total roadway fatalities in 2013: 1,199
> Pct. of residents using seatbelt: 91%
There are 6.1 deaths on the road for every 100,000 state residents in 2013, making New York one of the safest states in which to drive in the country. Vehicle occupants in New York tend to have better habits on the road. While about 87% of Americans use a seatbelt, 91% of New York residents choose to buckle up.
Drivers are more prone to get into deadly accidents on rural roads than on urban ones. Just 25% of all driving in New York is done in rural areas. The corresponding national share is 32%.
48. New Jersey
> Road deaths per 100,000: 6.1
> Total roadway fatalities in 2013: 542
> Pct. of residents using seatbelt: 91%
With 6.1 deaths on the road for every 100,000, New Jersey is one of the safest states in the country to drive in. Vehicle occupants in New Jersey tend to have better habits on the road. While about 87% of Americans use a seatbelt, 91% of New Jersey residents choose to buckle up.
Deadly accidents tend to occur more on rural roads than they do on urban ones. In New Jersey, just 6% of all driving is done in rural areas. Such a small portion of rural driving may account for New Jersey being one of the safest states to drive in.
[recirclink id=180889]
47. Rhode Island
> Road deaths per 100,000: 6.2
> Total roadway fatalities in 2013: 65
> Pct. of residents using seatbelt: 86%
With 6.2 deaths for every 100,000 residents, fatal accidents on Rhode Island roads are much less common in they are across the United States, where the corresponding rate is 10.3 deaths per 100,000 residents. Despite fewer deaths per person, drivers in Rhode Island have slightly worse habits on the road than residents nationwide. While about 87% of Americans use a seatbelt, 86% of Rhode Island residents choose to buckle up.
Drivers are more prone to get into deadly accidents on rural roads than on urban ones. Just 12% of all driving in Rhode Island is done in rural areas, which may be one of the reasons the state is one of the safest to drive.
46. Washington
> Road deaths per 100,000: 6.3
> Total roadway fatalities in 2013: 436
> Pct. of residents using seatbelt: 95%
With 6.3 deaths on the road for every 100,000 residents, Washington is one of the safest states in the country to drive. Vehicle occupants in Washington have demonstrably better habits on the road. While about 87% of Americans use a seatbelt, 95% of Washington residents choose to buckle up.
The kinds of roads Washington residents tend to drive on also likely contributed to a low fatality rate. Urban roads are safer than rural roads and only 27% of all driving in Washington takes place in rural areas. Nationally, 32% of all driving is rural.
45. Alaska
> Road deaths per 100,000: 6.9
> Total roadway fatalities in 2013: 51
> Pct. of residents using seatbelt: 86%
The car accident fatality rate of 6.9 deaths for every 100,000 residents on Alaskan roads is much lower than the national rate of 10.3 fatalities for every 100,000 residents. Despite better outcomes across the state, vehicle occupants in Alaska have slightly worse habits on the road than residents nationwide. While about 87% of Americans use a seatbelt, 86% of Alaska residents choose to buckle up.
Deadly accidents are often more likely to occur on rural roads than on urban ones, and many of the safest states are the ones with the smallest shares of rural driving. In Alaska, however, 48% of all driving is done in rural areas, one of the highest such shares of any of the safest states.
44. Minnesota
> Road deaths per 100,000: 7.1
> Total roadway fatalities in 2013: 387
> Pct. of residents using seatbelt: 95%
With 7.1 deaths for every 100,000 residents, fatal accidents on the road are much less common in Minnesota than they are across the United States, where the corresponding rate is 10.3 deaths per 100,000 residents. Vehicle occupants in Minnesota have demonstrably better habits on the road. While about 87% of Americans use a seatbelt, 95% of Minnesota residents do.
Driving in rural areas is more dangerous than driving in urban areas, and many of the safest states are ones with the least amounts of rural driving. Minnesota, however, is an exception. Roughly 41% of miles traveled in Minnesota are on rural roads, a significantly higher share than the 32% share of rural driving across the country.
43. Hawaii
> Road deaths per 100,000: 7.3
> Total roadway fatalities in 2013: 102
> Pct. of residents using seatbelt: 94%
With 7.3 deaths on the road for every 100,000 residents, Hawaii is one of the safest states in the country to drive. Drivers and passengers in Hawaii have safer habits than those in most states. Nationwide, 87% of Americans choose to wear a seatbelt. In Hawaii, 94% choose to do so. Drivers are often more likely to get into fatal car crashes in rural areas than in urban ones. Only 18% of vehicle miles traveled in Hawaii are on rural roads, which may partially account for it being one of the safest states for driving.
[recirclink id=179493]
42. Utah
> Road deaths per 100,000: 7.6
> Total roadway fatalities in 2013: 220
> Pct. of residents using seatbelt: 82%
Nationally, 87% of vehicle occupants use a seat belt. In Utah however, only 82% choose to buckle up. Despite slightly worse habits, with 7.6 deaths on the road for every 100,000, Utah is one of the safest states in the country to drive. Urban roads are safer than rural roads and only 27% of all driving in Utah takes place in rural areas. Nationally, 32% of all driving is rural.
41. Illinois
> Road deaths per 100,000: 7.7
> Total roadway fatalities in 2013: 991
> Pct. of residents using seatbelt: 94%
With 7.7 deaths for every 100,000 residents, fatal road accidents are significantly less common in Illinois than they are across the country, where 10.3 deaths occur per 100,000 residents. Many states with the least vehicle deaths per capita have the highest shares of drivers and passengers wearing seatbelts. Illinois motorists are no different. While about 87% of Americans use a seatbelt, 94% of Illinois residents buckle up. Urban roads are safer than rural roads and only 24% of all driving in Illinois takes place in rural areas. Nationally, 32% of all driving is rural.
40. Connecticut
> Road deaths per 100,000: 7.7
> Total roadway fatalities in 2013: 276
> Pct. of residents using seatbelt: 87%
The car accident fatality rate of 7.7 deaths for every 100,000 residents on Connecticut roads is much lower than the national rate of 10.3 fatalities for every 100,000 residents. Seat belt use in Connecticut is exactly in line with the national rate of 87%. As in many of the safest states in which to drive, the Connecticut’s low roadway fatality rate by be attributable to less rural driving. Only 12% of all miles driven in the state are on rural roads.
39. Maryland
> Road deaths per 100,000: 7.8
> Total roadway fatalities in 2013: 465
> Pct. of residents using seatbelt: 91%
With 7.8 deaths for every 100,000 residents, fatal accidents on Maryland roads are much less common than they are across the United States, where the corresponding rate is 10.3 deaths per 100,000 residents. Vehicle occupants in Maryland have demonstrably better habits on the road. While about 87% of Americans use a seatbelt, 91% of Maryland residents choose to buckle up. Urban roads are safer than rural roads and only 19% of all driving in Maryland takes place in rural areas. Nationally, 32% of all driving takes place in rural areas.
[recirclink id=184705]
38. California
> Road deaths per 100,000: 7.8
> Total roadway fatalities in 2013: 3,000
> Pct. of residents using seatbelt: 97%
There were 7.8 deaths on the road for every 100,000 state residents in 2013, making California one of the safest states to drive in the country. Vehicle occupants in California have demonstrably better habits on the road. While about 87% of Americans use a seatbelt, 97% of California residents choose to buckle up. Urban roads are safer than rural roads and only 16% of all driving in California takes place in rural areas. Nationally, 32% of all driving takes place in rural areas.
37. Oregon
> Road deaths per 100,000: 8.0
> Total roadway fatalities in 2013: 313
> Pct. of residents using seatbelt: 98%
In Oregon, 44% of all driving occurs on rural roads, a significantly higher share than the 32% national share. Nevertheless, with 8.0 deaths on the road for every 100,000, Oregon roads are safer than across the country on average, where the rate is 10.3 deaths per 100,000 residents. Vehicle occupants in Oregon have demonstrably better habits on the road. While about 87% of Americans use a seatbelt, 98% of Oregon residents choose to buckle up.
36. Ohio
> Road deaths per 100,000: 8.5
> Total roadway fatalities in 2013: 989
> Pct. of residents using seatbelt: 85%
The car accident fatality rate of 8.5 deaths for every 100,000 residents on Ohio roads is significantly lower than the national rate of 10.3 fatalities for every 100,000 residents. Rural roads are more dangerous than urban ones and nearly 71% of all miles driven within Ohio are in urban areas, likely contributing to a lower than average fatality rate. With 85% of vehicle occupants buckling up, seat belt use across the Buckeye State is roughly in line with the national rate of 87%.
A driver in Ohio could get convicted of a DUI four times before facing felony charges, and records are wiped clean after only six years. Despite relatively lenient DUI laws, only about 28% of Ohio drivers killed in 2013 had a blood alcohol content greater than or equal to 0.08%, a lower share than the 33% of drivers killed nationwide.
35. Virginia
> Road deaths per 100,000: 9.0
> Total roadway fatalities in 2013: 740
> Pct. of residents using seatbelt: 80%
Nationwide, about 87% of passenger vehicle occupants buckle up. In Virginia, only 80% of residents use a seatbelt. Despite the relative prevalence of some irresponsible habits on the road, with 9.0 deaths on the road for every 100,000, Virginia is one of the safer states in the country to drive in. One likely explanation is the kind of roads traveled in state.
Rural roads are more dangerous than urban ones and the vast majority of miles driven in 2013 within Virginia were in urban areas.
34. Colorado
> Road deaths per 100,000: 9.1
> Total roadway fatalities in 2013: 481
> Pct. of residents using seatbelt: 82%
With 9.1 deaths on the road for every 100,000 state residents in 2013, Colorado is one of the safer states to drive in the country. Despite a lower than average rate of roadway fatalities, Colorado residents are more likely to exhibit some bad habits on the road than the average American. Only 82% of Coloradans buckle up, a smaller share than the 87% of Americans who do. As in many of the safest states in which to drive, the Colorado’s low roadway fatality rate by be attributable to less rural driving. The vast majority of all miles driven in the state are on urban roads.
33. Nevada
> Road deaths per 100,000: 9.4
> Total roadway fatalities in 2013: 262
> Pct. of residents using seatbelt: 95%
Vehicle occupants in Nevada have demonstrably better habits on the road. While about 87% of Americans use a seatbelt, 95% of Nevada residents choose to buckle up. Additionally, drunk driving is behind a smaller share of fatal accidents in Nevada than it is across the country. Of the 83 Nevada drivers killed behind the wheel in 2013, 30% had a blood alcohol content greater than or equal to 0.08%, a smaller share than the 33% of American drivers killed the same year. With only 9.4 deaths on the road for every 100,000, Nevada is one of the safer states in the country to drive in.
[recirclink id=185202]
32. Wisconsin
> Road deaths per 100,000: 9.5
> Total roadway fatalities in 2013: 543
> Pct. of residents using seatbelt: 82%
With 9.5 deaths for every 100,000 residents, fatal accidents on the road are less common in Wisconsin than they are across the United States, where the rate is 10.3 deaths per 100,000 residents. Despite slightly better outcomes, vehicle occupants in Wisconsin have demonstrably worse habits on the road on average. While about 87% of Americans use a seatbelt, 82% of Wisconsin residents choose to buckle up. Additionally, of the 292 drivers killed behind the wheel in 2013, 35% had a blood alcohol content greater than or equal to 0.08%, a slightly higher share than the 33% of American drivers killed the same year.
31. Pennsylvania
> Road deaths per 100,000: 9.5
> Total roadway fatalities in 2013: 1,208
> Pct. of residents using seatbelt: 84%
Rural roads are more dangerous than urban ones and only three other states had higher volumes of rural miles traveled in 2013 than Pennsylvania. Despite widespread rural travel, The car accident fatality rate of 9.5 deaths for every 100,000 residents on Pennsylvania roads is slightly lower than the national rate of 10.3 fatalities for every 100,000 residents. Seatbelt use in Pennsylvania, where 84% of residents buckle up, is slightly less common than it is across the country. Of all the people killed as the result of a motor vehicle accident, 15% were motorcyclists, a slightly larger share than the 13% nationwide figure.
30. Michigan
> Road deaths per 100,000: 9.6
> Total roadway fatalities in 2013: 947
> Pct. of residents using seatbelt: 93%
Vehicle occupants in Michigan are more likely to have better habits on the road. While about 87% of Americans use a seatbelt, 93% of Michigan residents choose to buckle up. Furthermore, urban roads are safer than rural roads and only 29% of all driving in the state occurs in rural areas. The death rate on Michigan roads of 9.6 for every 100,000 residents is slightly better than the national rate of 10.3 fatalities for every 100,000 residents.
29. New Hampshire
> Road deaths per 100,000: 10.2
> Total roadway fatalities in 2013: 135
> Pct. of residents using seatbelt: 73%
The car accident fatality rate of 10.2 deaths for every 100,000 residents on New Hampshire roads is roughly in line with the national rate of 10.3 fatalities for every 100,000 residents. While about 87% of Americans use a seatbelt, only 73% of New Hampshire residents choose to buckle up — likely because it is not legally required in the state.
Just as the total fatality rate on New Hampshire roads are in line with the national figure, so is the state’s drunk driving fatality rate. Of the 74 drivers killed behind the wheel in New Hampshire in 2013, 32% had a blood alcohol content greater than or equal to 0.08%, a similar share to the 33% of American drivers killed the same year.
28. Iowa
> Road deaths per 100,000: 10.3
> Total roadway fatalities in 2013: 317
> Pct. of residents using seatbelt: 92%
With 10.3 deaths for every 100,000 residents, fatal accidents on the road are just as common in Iowa as they are across the country, where the corresponding rate is also 10.3 deaths per 100,000 residents. Despite similar outcomes to the country as a whole, Iowa drivers are at an inherent disadvantage. Rural roads are more dangerous than urban roads and 58% of all miles driven in Iowa are rural. Nationally, only 32% of all miles driven are rural.
Vehicle occupants in Iowa have demonstrably better habits on the road. While about 87% of Americans use a seatbelt, 92% of Iowa residents choose to buckle up.
27. Delaware
> Road deaths per 100,000: 10.7
> Total roadway fatalities in 2013: 99
> Pct. of residents using seatbelt: 92%
The car accident fatality rate of 10.9 deaths for every 100,000 residents on Delaware roads is roughly in line with the national rate of 10.3 fatalities for every 100,000 residents. Vehicle occupants in Delaware have demonstrably better habits on the road. While about 87% of Americans use a seatbelt, 92% of Delaware residents choose to buckle up. Additionally, rural roads tend to have more deadly accidents than urban roads, and roughly two-thirds of the total miles driven in Delaware are on urban roads.
[recirclink id=234789]
26. Maine
> Road deaths per 100,000: 10.9
> Total roadway fatalities in 2013: 145
> Pct. of residents using seatbelt: 83%
With 10.9 deaths for every 100,000 residents, fatal accidents on the road are only slightly more common in Maine than they are across the United States, where the corresponding rate is 10.3 deaths per 100,000 residents. Vehicle occupants in Maine have slightly worse habits on the road than most Americans. While about 87% of Americans use a seatbelt, 83% of Maine residents choose to buckle up.
25. Vermont
> Road deaths per 100,000: 11.0
> Total roadway fatalities in 2013: 69
> Pct. of residents using seatbelt: 85%
Eleven people die from car accidents each year per 100,000 Vermont residents, in line with the national rate of 10.3 fatalities for every 100,000 residents. Like many of the most dangerous states to drive in, the vast majority of miles driven in Vermont are in rural areas. While just over half of all deadly roadway collisions in the United States happen in rural localities, 84% of collisions in Vermont happen on rural roads — a much higher share.
24. Nebraska
> Road deaths per 100,000: 11.3
> Total roadway fatalities in 2013: 211
> Pct. of residents using seatbelt: 79%
Nebraska’s car crash fatality rate of 11.3 deaths for every 100,000 residents is slightly higher than the national rate of 10.3 fatalities for every 100,000 residents. A much larger share of deadly accidents in Nebraska occur in rural areas. While just over half of all deadly roadway collisions in the United States happen in rural localities, 81% of collisions in Nebraska happen on rural roads, a significantly higher share.
[recirclink id=235231]
23. Georgia
> Road deaths per 100,000: 11.8
> Total roadway fatalities in 2013: 1,179
> Pct. of residents using seatbelt: 96%
With 11.8 deaths on the road for every 100,000 Georgia residents in 2013, the state is slightly more dangerous to drive in than the rest of the country on average. Unlike many of the other states with a higher than average rate of roadway fatalities, drivers and passengers in Georgia are less likely to exhibit bad habits on the road. While about 87% of Americans use a seatbelt, 96% of drivers and passengers in Georgia do.
22. Indiana
> Road deaths per 100,000: 11.9
> Total roadway fatalities in 2013: 783
> Pct. of residents using seatbelt: 92%
With 11.9 deaths for every 100,000 residents, fatal road accidents are slightly more common in Indiana than they are across the country, where the corresponding rate is 10.3 deaths per 100,000 residents. Unlike many of the states with higher rates roadway fatalities, drivers and passengers in Indiana are more likely to use a seatbelt. While about 87% of Americans buckle up, about 92% of Indiana passengers and drivers do.
21. Kansas
> Road deaths per 100,000: 12.1
> Total roadway fatalities in 2013: 350
> Pct. of residents using seatbelt: 81%
The car accident fatality rate of 12.1 deaths for every 100,000 residents on Kansas roads is slightly higher than the national rate of 10.3 fatalities for every 100,000 residents. Like in many of the states with higher rates of roadway fatalities, a much larger share of deadly accidents in Kansas occur in rural areas. Even though only 48% of vehicle miles traveled in Kansas are in rural areas, 77% of of all deadly roadway collisions in the state happen on rural roads. Another factor that could explain the state’s higher than average fatality rate is the lower than average seatbelt use. While about 87% of Americans use a seatbelt, only 81% of vehicle occupants in Kansas do.
20. Florida
> Road deaths per 100,000: 12.3
> Total roadway fatalities in 2013: 2,407
> Pct. of residents using seatbelt: 87%
Seatbelt use in Florida is roughly in line with the national average. Similarly, the 34% of drivers killed with a blood alcohol content greater than or equal to 0.08% is roughly in line with the corresponding national share. However, with 12.3 deaths for every 100,000 residents, fatal road accidents are more common in Florida than they are across the country — where the corresponding rate is 10.3 deaths per 100,000 residents.
19. Missouri
> Road deaths per 100,000: 12.5
> Total roadway fatalities in 2013: 757
> Pct. of residents using seatbelt: 80%
There were 12.5 deaths on the road for every 100,000 state residents in 2013, making Missouri more dangerous to drive in than the country on average. Additionally, as in many of the states with the highest rate of roadway fatalities, a higher share of miles driven in Missouri were on rural roads, 41% compared to 32% nationally. Drivers and passengers in Missouri were less likely to use a seatbelt. While about 87% of Americans use a seatbelt, only 80% in Missouri buckle up.
18. Arizona
> Road deaths per 100,000: 12.8
> Total roadway fatalities in 2013: 849
> Pct. of residents using seatbelt: 85%
With 12.8 deaths for every 100,000 state residents, fatal accidents on the road are more common in Arizona than they are across the United States, where the corresponding rate is 10.3 deaths per 100,000 residents.
Arizona’s worse than average outcomes came despite the fact that 77% of miles driven in the state are on urban roads. Nationally, only 68% of miles driven are in urban areas. Seatbelt use in Arizona is roughly in line with the nation. While 87% of Americans buckle up, 85% of people in Arizona use a seatbelt.
17. Texas
> Road deaths per 100,000: 12.8
> Total roadway fatalities in 2013: 3,382
> Pct. of residents using seatbelt: 90%
Only about 31% of miles driven in Texas in 2013 were in rural areas, an unusually small share for a states with higher than average motor vehicle-related fatalities. However, speed limits on highways in the Lone Star State are among the highest in the nation — as high as 85 mph. Accidents at higher speeds are much more likely to result in fatal injury.
The car crash fatality rate of 12.8 deaths for every 100,000 residents on Texas roads is higher than the national rate of 10.3 fatalities for every 100,000 residents.
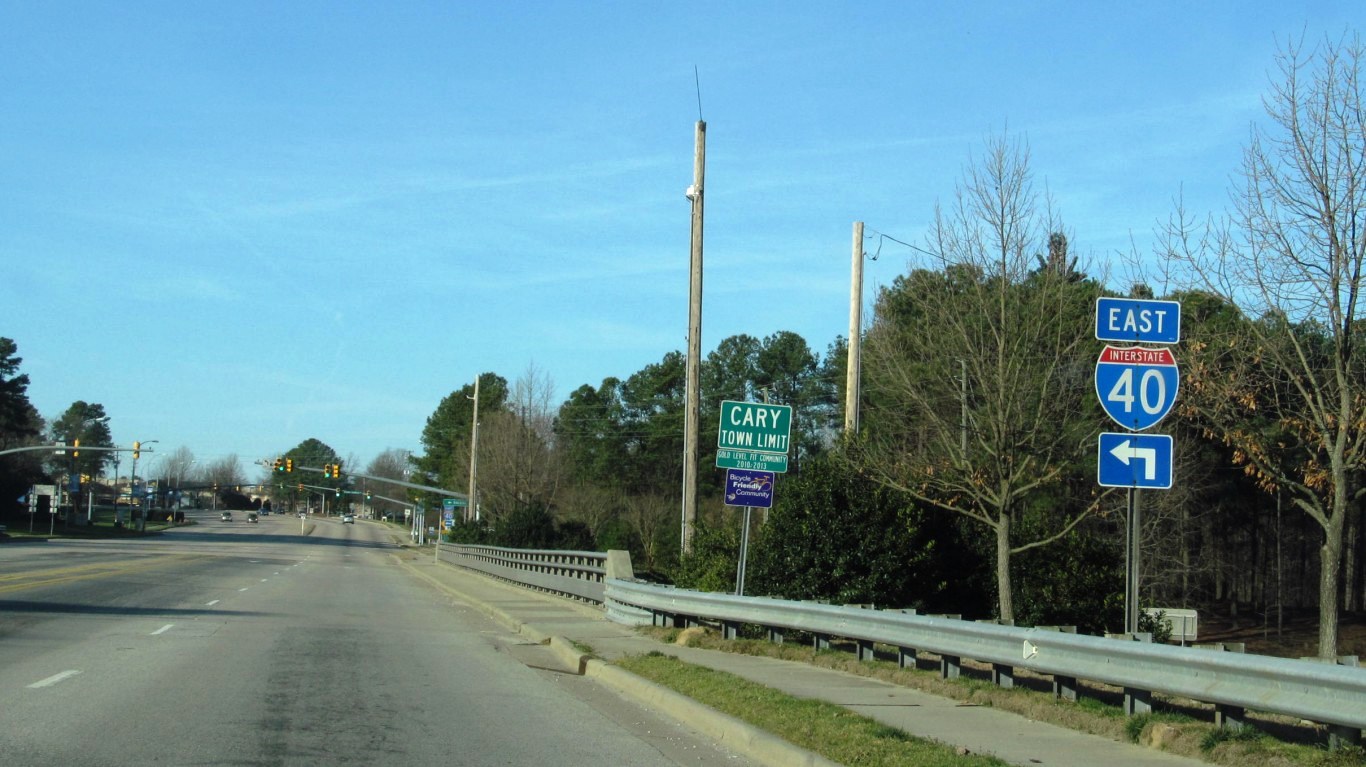
16. North Carolina
> Road deaths per 100,000: 13.1
> Total roadway fatalities in 2013: 1,289
> Pct. of residents using seatbelt: 89%
The car crash fatality rate of 13.1 deaths each year per 100,000 North Carolina residents is higher than the national rate of 10.3 fatalities for every 100,000 residents. The state’s higher than average fatality rate is partially attributable to environment. Across the country, rural roadways are much more dangerous than urban ones. While 39% of total vehicle miles traveled in North Carolina are in rural areas, only 32% of miles driven across the country are in rural areas.
[recirclink id=241177]
15. Idaho
> Road deaths per 100,000: 13.3
> Total roadway fatalities in 2013: 214
> Pct. of residents using seatbelt: 62%
The car accident fatality rate of 13.3 deaths for every 100,000 residents on Idaho roads is slightly higher the national rate of 10.3 fatalities for every 100,000 residents. As in many of the states with the highest rate of roadway fatalities, drivers and passengers in Idaho are less likely to use a seatbelt. While about 87% of Americans use a seatbelt, in Idaho, only 62% buckle up, the smallest share of any state in the country.
14. Kentucky
> Road deaths per 100,000: 14.5
> Total roadway fatalities in 2013: 638
> Pct. of residents using seatbelt: 85%
With 14.5 deaths for every 100,000 residents, fatal accidents on the road are more common in Kentucky than they are across the country, where the corresponding rate is 10.3 deaths per 100,000 residents. Rural roads are more dangerous than urban ones, which can partially explain the high rate of deadly accidents Kentucky. As many as 58% of miles traveled in Kentucky are in rural areas, and 77% of car accident fatalities happen on rural roadways.
[recirclink id=266907]
13. New Mexico
> Road deaths per 100,000: 14.9
> Total roadway fatalities in 2013: 310
> Pct. of residents using seatbelt: 92%
Like in many of the most dangerous states to drive, motorists in New Mexico primarily travel on rural roads. Roughly 57% of all vehicle miles driven in the state are through rural areas. More frequent rural driving likely contributed to the relatively high deadly accident rate. There were 14.9 deaths on the road for every 100,000 state residents in 2013, making New Mexico one of the most dangerous states to drive in the country.
12. Wyoming
> Road deaths per 100,000: 14.9
> Total roadway fatalities in 2013: 87
> Pct. of residents using seatbelt: 82%
With 14.9 deaths for every 100,000 residents, fatal accidents on the road are much more common in Wyoming than they are across the United States, where the corresponding rate is 10.3 deaths per 100,000 residents.
A much larger share of deadly accidents in Wyoming occur in rural areas. While just over half of all deadly roadway collisions in the country happen in rural localities, the corresponding rate in Wyoming of 83% is significantly higher. This may not be surprising because, with only only a handful of major urban areas, the vast majority of Wyoming is rural.
11. Louisiana
> Road deaths per 100,000: 15.2
> Total roadway fatalities in 2013: 703
> Pct. of residents using seatbelt: 83%
With 15.2 deaths on the road for every 100,000 state residents in 2013, Louisiana is one of the most dangerous states to in which to drive in the country. A high rate of vehicle-related death typically accompanies a high fatality rate per mile driven. The rates in Louisiana are no exception. While there are an average of 1.11 deaths on American roadways for every 100 million vehicle miles traveled, there are 1.51 deaths for every 100 million vehicle miles in Louisiana.
10. Tennessee
> Road deaths per 100,000: 15.3
> Total roadway fatalities in 2013: 995
> Pct. of residents using seatbelt: 85%
With 15.3 deaths for every 100,000 residents, fatal accidents on the road are much more common in Tennessee than they are across the United States, where the corresponding rate is 10.3 deaths per 100,000 residents.
A high rate of vehicle-related death typically accompanies a high fatality rate per mile driven. The rates in Tennessee are no exception. While there are an average of 1.11 deaths on American roadways for every 100 million vehicle miles traveled, there are 1.41 deaths in Tennessee for every 100 million vehicle miles.
9. South Dakota
> Road deaths per 100,000: 16.0
> Total roadway fatalities in 2013: 135
> Pct. of residents using seatbelt: 69%
As in many of the states with the highest rates of roadway fatalities, drivers and passengers in South Dakota are less likely to use a seatbelt. While about 87% of Americans use a seatbelt, only 69% South Dakotans buckle up, a smaller share than any state after Idaho. With 16 deaths on the road for every 100,000 state residents in 2013, South Dakota is one of the most dangerous states in which to drive in the country.
8. South Carolina
> Road deaths per 100,000: 16.1
> Total roadway fatalities in 2013: 767
> Pct. of residents using seatbelt: 92%
With 16.1 deaths for every 100,000 residents, fatal accidents on the road are much more common in South Carolina than they are across the country, where the corresponding rate is 10.3 deaths per 100,000 residents. Across the country, rural roads are more dangerous than urban ones. While 48% of motor vehicle travel takes place in rural parts of South Carolina, 80% of all fatal accidents in the state occur in rural areas.
[recirclink id=291722]
7. Arkansas
> Road deaths per 100,000: 16.3
> Total roadway fatalities in 2013: 483
> Pct. of residents using seatbelt: 77%
As in many of the states with the highest rate of roadway fatalities, drivers and passengers in Arkansas are not as likely to observe best practices when in a passenger vehicle. While about 87% of Americans use a seatbelt, only 77% buckle up in Arkansas. With 16.3 deaths on the road for every 100,000 state residents in 2013, Arkansas is one of the most dangerous states to drive in in the country.
6. Alabama
> Road deaths per 100,000: 17.6
> Total roadway fatalities in 2013: 852
> Pct. of residents using seatbelt: 97%
With 17.6 deaths for every 100,000 residents, fatal accidents on the road are much more common in Alabama than they are across the United States, where the corresponding rate is 10.3 deaths per 100,000 residents. Unlike many of the most dangerous states to drive in, however, people in Alabama are relatively responsible on the road. While 87% of Americans use their seatbelt, 97% of vehicle occupants in Alabama buckle up.
5. Oklahoma
> Road deaths per 100,000: 17.6
> Total roadway fatalities in 2013: 678
> Pct. of residents using seatbelt: 84%
Bad habits in Oklahoma contribute to bad outcomes. Vehicle occupants in the Sooner State are less likely to use a seatbelt. While 87% of Americans buckle up, only 84% of Oklahoma passengers and drivers use a seatbelt. There were 17.6 deaths on the road for every 100,000 state residents in 2013, making Oklahoma one of the most dangerous states to drive in the country.
4. West Virginia
> Road deaths per 100,000: 17.9
> Total roadway fatalities in 2013: 332
> Pct. of residents using seatbelt: 82%
With 17.9 deaths for every 100,000 residents, fatal accidents on the road are much more common in West Virginia than they are across the country, where the corresponding rate is 10.3 deaths per 100,000 residents. Rural roads are more dangerous than urban ones, and the majority of deadly accidents in West Virginia occur in rural areas. As many as 58% of all vehicle miles traveled in West Virginia in 2013 were in rural areas, and 73% of all roadway fatalities in the state happened in a rural area.
3. Mississippi
> Road deaths per 100,000: 20.5
> Total roadway fatalities in 2013: 613
> Pct. of residents using seatbelt: 74%
With 20.5 deaths on the road for every 100,000 state residents in 2013, Mississippi is the third most dangerous state to drive in the country. As in many of the states with the highest rate of roadway fatalities, drivers and passengers in Mississippi are less likely to use a seatbelt. While about 87% of Americans use a seatbelt, only 74% of vehicle occupants buckle up in Mississippi.
A larger than average share of those killed on Mississippi roadways are occupants of pickup trucks or SUVs. While about a quarter of roadway fatalities are occupants of pickups or SUVs nationally, roughly 40% of those killed on Mississippi roads are in pickups or SUVs. Like many of the states with the highest rates of roadway fatalities, a much larger share of deadly accidents in Mississippi occur in rural areas. Roughly 57% of all vehicle miles traveled in the state are in rural areas, and 85% of all fatal accidents in Mississippi are on rural roads.
2. North Dakota
> Road deaths per 100,000: 20.5
> Total roadway fatalities in 2013: 148
> Pct. of residents using seatbelt: 78%
With 20.5 deaths for every 100,000 residents, fatal accidents on the road are nearly twice as common in North Dakota than they are across the country, where the corresponding rate is 10.3 deaths per 100,000 residents. As in many of the states with the most dangerous roads, drivers and passengers in North Dakota are less likely to use a seatbelt. While about 87% of Americans use a seatbelt, only 78% buckle up in North Dakota.
A larger than average share of those killed on North Dakota roadways are in pickup trucks or SUVs. Nationally, SUVs and pickup trucks are involved in about a quarter of all roadway fatalities. In North Dakota, roughly 52% of those killed on the road are in pickups or SUVs.
1. Montana
> Road deaths per 100,000: 22.6
> Total roadway fatalities in 2013: 229
> Pct. of residents using seatbelt: 74%
States with more rural roadways are typically more dangerous than more urban states. In Montana, more than 69% of all vehicle miles driven in 2013 were in rural areas. Correspondingly, 98% of all deadly accidents in the state happened in rural areas. As in many of the states with the highest rate of roadway fatalities, drivers and passengers in Montana are less likely to use a seatbelt. While about 87% of Americans use a seatbelt, only 74% buckle up in Montana. With 22.6 deaths on the road for every 100,000 state residents in 2013, Montana is the most dangerous state to drive in the country.
[recirclink id=179952]
Contact [email protected] for any questions or corrections.