More than 22 million Americans are government workers. While the ideal size of government in the United States is a matter of intense debate, most Americans agree that government workers are necessary in some capacity. Public education, law enforcement, emergency services, and road maintenance are all matters of public administration, and state, local, and federal government employees help these public services run smoothly.
Using data from the Bureau of Labor Statistics (BLS), 24/7 Wall St. reviewed the percentage of each state’s labor force working as local, state, or federal government employees. While nationally, 15.5% of the country’s workforce is employed in the public sector, Wyoming’s public sector accounted for 24.6% of the state’s workforce, the largest share of all states. At just 12.1%, Pennsylvania employed the smallest share. These are states with the most (and least) government workers.
State and local government employees perform a range of tasks to keep a state running properly. Some workers are needed as administrators, while others maintain roads, serve as representatives, and help provide other public goods and services. The vast majority of total government employment in the United States comes from localities, rather than from states or the federal government. Nationally, 12.4% of all public workers are employed at the federal level, 22.9% are employed by states, and the remaining 63.8% are employed at the local level. According to Bureau of Labor Statistics chief regional economist Martin Kohli, the majority of local government jobs are in public education.
Click here to see the states where the most people work for the government.
Kohli explained that the need for public education and other basic government services, even in the smallest, most rural governments in the country, helps explain why some states have larger concentrations of public employees as a share of total employment. He noted that the need for public administration workers is subject to returns to scale, meaning fewer public employees are needed when populations are all concentrated in one area, and more are needed per capita in places with lower population density.
Indeed states with high shares of workers in government include less densely populated states like Montana, New Mexico, and North and South Dakota. The two states where government jobs make up the highest share of the state workforce — Wyoming and Alaska — also have the fewest people per square mile in the country, at just 5.8 and 1.2 people per square mile, while the national population density is 87.4 people per square mile. Very densely populated states like Massachusetts and Rhode Island tend to have relatively small government sectors.
Compared to the private sector, government jobs appear to be more stable on the whole. The number of government workers increased by about 200,000, or 0.9%, over the past decade. During the recession, some states shed hundreds of thousands of private sector jobs, and while many lost public sector workers as well, government positions were relatively stable in many states during the crisis.
Over the past 10 years, while government jobs increased in some states and decreased in others, no state had a greater than 20% increase or decline in public sector employment. Meanwhile, the construction sectors of many states are still down by more than 30%, even after years of recovery.
Kohli explained that there are many potential reasons for the relative stability of government jobs during the recession, but he pointed out that subsidies from the federal government may help preserve public sector jobs while private sector positions are at risk. “There’s a really interesting issue there, back when Mr. Obama took office, and he proposed this economic stimulus bill. And part of that stimulus involved aid to state and local governments.”
Kohli was quick to add, however, that government jobs were by no means immune to the effects of the recession. “It was a long-lasting recession, and the recovery was slow, and it did result in a certain amount of strain on state and local government budgets.” Indeed, government positions in more than five states fell by more than 5% over the past decade, even as the national share of government jobs increased slightly. Kohli gave the example of Rhode Island, where total government employment decreased by 7.1%, likely in part because the state shed jobs as a cost-cutting measure.
To determine the share of each state’s labor force employed in government at the state, local, or federal level, 24/7 Wall St. used employment data from the Bureau of Labor Statistics (BLS) for 2015. The percentage of the population working in a particular industry is relative to the state’s total nonfarm payrolls. State employment-to-population ratios are also from the BLS. Population density, the share of households living in rural areas, median household income, and poverty rates are from the U.S. Census Bureau’s 2014 American Community Survey.
These are the states with the most and least government workers.
50. Pennsylvania
> Pct. workers in government, 2015: 12.1%
> Pct. workers in government, 2005: 13.2% (3rd lowest)
> Chg. government workers (2005-2015): -6.4% (4th largest decline)
> People per square mile: 283.9 (9th most)
Only 12.1% of workers in Pennsylvania are employed in the public sector, the smallest such percentage in the country. Government employment in Pennsylvania has also declined over the last decade. While public sector employment grew by 0.9% nationwide between 2005 and 2015, it decreased by 6.4% in the Keystone State over the same period.
49. Nevada
> Pct. workers in government, 2015: 12.3%
> Pct. workers in government, 2005: 11.7% (the lowest)
> Chg. government workers (2005-2015): 8.2% (8th largest increase)
> People per square mile: 24.6 (9th fewest)
Only one other state — Pennsylvania — has a smaller percentage of government workers than Nevada. While, on average, 15.5% of workers nationwide are public employees, in Nevada the percentage is just 12.3%. In 2005, prior to the recession, this share was even lower, at 11.7%. However, as Nevada has shed jobs in other sectors, including a close to 50% drop in construction jobs over the last decade, the share of government workers has increased.
[nativounit]
48. Rhode Island
> Pct. workers in government, 2015: 12.4%
> Pct. workers in government, 2005: 13.2% (4th lowest)
> Chg. government workers (2005-2015): -7.1% (3rd largest decline)
> People per square mile: 1018.1 (2nd most)
Government workers tend to make up a smaller share of the workforce in densely populated urban areas, where private enterprises are more likely to thrive. In Rhode Island, the second most densely populated state in the country, only 12.4% of workers are employed in the public sector, the third smallest percentage in the country. The total number of government employees in the Ocean State dropped from 64,900 in 2005 to 60,300 in 2015.
47. Massachusetts
> Pct. workers in government, 2015: 12.9%
> Pct. workers in government, 2005: 13.2% (2nd lowest)
> Chg. government workers (2005-2015): 6.1% (15th largest increase)
> People per square mile: 839.4 (3rd most)
Urban areas are often more economically vibrant and tend to support larger numbers of private sector jobs. As a result, relatively small shares of urban area jobs tend to be in the public sector. In Massachusetts, a state where 92% of the population lives in urban locations, a relatively small percentage of the population is employed in the public sector. Only 451,000 workers — or 12.9% of the state’s total workforce — are government employees.
[recirclink id=328172]
46. Florida
> Pct. workers in government, 2015: 13.4%
> Pct. workers in government, 2005: 13.9% (6th lowest)
> Chg. government workers (2005-2015): 0.0%
> People per square mile: 350.6 (8th most)
The roughly 1.1 million people in Florida who work for the government make up only 13.4% of the state’s workforce, one of the smallest such percentages in the country. As is the case nationwide, the vast majority of those in the public sector in the Sunshine State work for the local government. Fewer than one in five public sector workers in Florida is employed by the state, the third smallest proportion in the country.
45. New Hampshire
> Pct. workers in government, 2015: 13.7%
> Pct. workers in government, 2005: 14.4% (7th lowest)
> Chg. government workers (2005-2015): -1.4% (12th largest increase)
> People per square mile: 147.0 (21st most)
Only about 13.7% of New Hampshire’s workforce is employed by the local, state or federal government. While the public sector accounts for a relatively small proportion of jobs in the state, that share has decreased in the last decade. The total number of public sector employees declined by 1.4% — or about 1,300 workers — between 2005 and 2015.
44. Illinois
> Pct. workers in government, 2015: 13.9%
> Pct. workers in government, 2005: 14.4% (9th lowest)
> Chg. government workers (2005-2015): -1.8% (11th largest decrease)
> People per square mile: 231.1 (12th most)
Local governments employ the majority of public workers in every state. In Illinois, however, a disproportionately high share — 72.2% — of the 830,300 government workers are employed at the local level. Only 13.9% of the Illinois workforce is employed by local, state, or federal institutions, less than the 15.5% national rate. Like most states with a relatively small percentage of government employees, Illinois is not especially rural. There are 231 people per square mile, making it the 12th most densely populated state.
[nativounit]
43. Michigan
> Pct. workers in government, 2015: 14.0%
> Pct. workers in government, 2005: 15.4% (15th lowest)
> Chg. government workers (2005-2015): -11.8% (2nd largest decrease)
> People per square mile: 174.8 (17th most)
The number of government workers in Michigan declined by nearly 80,000 between 2005 and 2015. While many sectors lost jobs during that time, only the state’s manufacturing sector had a greater total decline. Today, just 14% of Michigan’s workers are employed by the state, federal, or a local government, compared to 15.4% in 2005.
42. Indiana
> Pct. workers in government, 2015: 14.0%
> Pct. workers in government, 2005: 14.4% (8th lowest)
> Chg. government workers (2005-2015): 0.1% (36th largest increase)
> People per square mile: 181.0 (16th most)
Only 14% of Indiana’s workforce is employed in the public sector. Over a quarter of these workers are employed by the state government, many of them at the University of Indiana, one of the largest public universities in the country.
[recirclink id=328173]
41. Ohio
> Pct. workers in government, 2015: 14.2%
> Pct. workers in government, 2005: 14.7% (11th lowest)
> Chg. government workers (2005-2015): -3.9% (8th largest decrease)
> People per square mile: 282.3 (10th most)
Like in several other major industries in Ohio, the number of government jobs in Ohio has decreased in the last decade. As of last year, 768,600 Ohio residents are either employed by either local, state or federal government entities, a 3.9% drop from 10 years ago. Today, only 14.2% of Ohio’s employed population works for the government, a smaller share than all but a handful of other states.
40. Wisconsin
> Pct. workers in government, 2015: 14.2%
> Pct. workers in government, 2005: 14.6% (10th lowest)
> Chg. government workers (2005-2015): -1.3% (13th largest decrease)
> People per square mile: 105.0 (23rd most)
The federal government employs some number of people in every state, and often federal employment boosts the overall public sector workforce. In Wisconsin, however, where government workers are generally underrepresented, just 7% of the state’s public workers are federal employees. Only Iowa has a smaller percentage of federal employees.
39. Connecticut
> Pct. workers in government, 2015: 14.3%
> Pct. workers in government, 2005: 14.8% (12th lowest)
> Chg. government workers (2005-2015): -2.9% (10th largest decrease)
> People per square mile: 738.1 (4th most)
Connecticut is one of only 14 states in which the number of public employees declined over the past decade. In 2005, there were 246,200 local, state, and federal government workers employed in Connecticut. That number declined by 7,100 by 2015. More densely populated areas tend to have lower concentrations of government workers, and Connecticut has 738 residents per square mile, the fourth highest population density in the country.
[recirclink id=328234]
38. Delaware
> Pct. workers in government, 2015: 14.6%
> Pct. workers in government, 2005: 13.8% (5th lowest)
> Chg. government workers (2005-2015): 9.7% (4th largest increase)
> People per square mile: 460.8 (6th most)
In most states, the majority of government employees work for local municipalities. Delaware is a notable exception, however, as over half of the government workers are employed by the state. Only 41.3% of public employees in Delaware work for local authorities, the smallest share of any state, with the exception of Hawaii. In addition, only 8.6% of public workers in Delaware are federal employees.
37. Tennessee
> Pct. workers in government, 2015: 14.7%
> Pct. workers in government, 2005: 15.0% (13th lowest)
> Chg. government workers (2005-2015): 3.3% (25th largest increase)
> People per square mile: 153.9 (19th most)
Like most states, Tennessee’s public workforce increased over the last decade. The state’s workers employed at the federal, state, and or local levels increased by 13,700, or 3.3%, several times faster than the national increase of 0.9%. Several other Tennessee sectors added far more jobs than the public sector over the past decade, including the professional and business services sector, which added 80,000 jobs between 2005 and 2015.
[nativounit]
36. Minnesota
> Pct. workers in government, 2015: 14.7%
> Pct. workers in government, 2005: 15.2% (14th lowest)
> Chg. government workers (2005-2015): 1.5% (19th largest increase)
> People per square mile: 66.6 (20th fewest)
Only 14.7% of Minnesota’s workforce is employed in the public sector, slightly less than the nationwide rate of 15.5%. Of the 421,000 government workers in Minnesota, only 7.5% are federal employees, one of the smallest such shares of any state. The Mayo Clinic is the largest employer in Minnesota and, perhaps not surprisingly, the health services sector employs over half a million people, considerably more than the government sector.
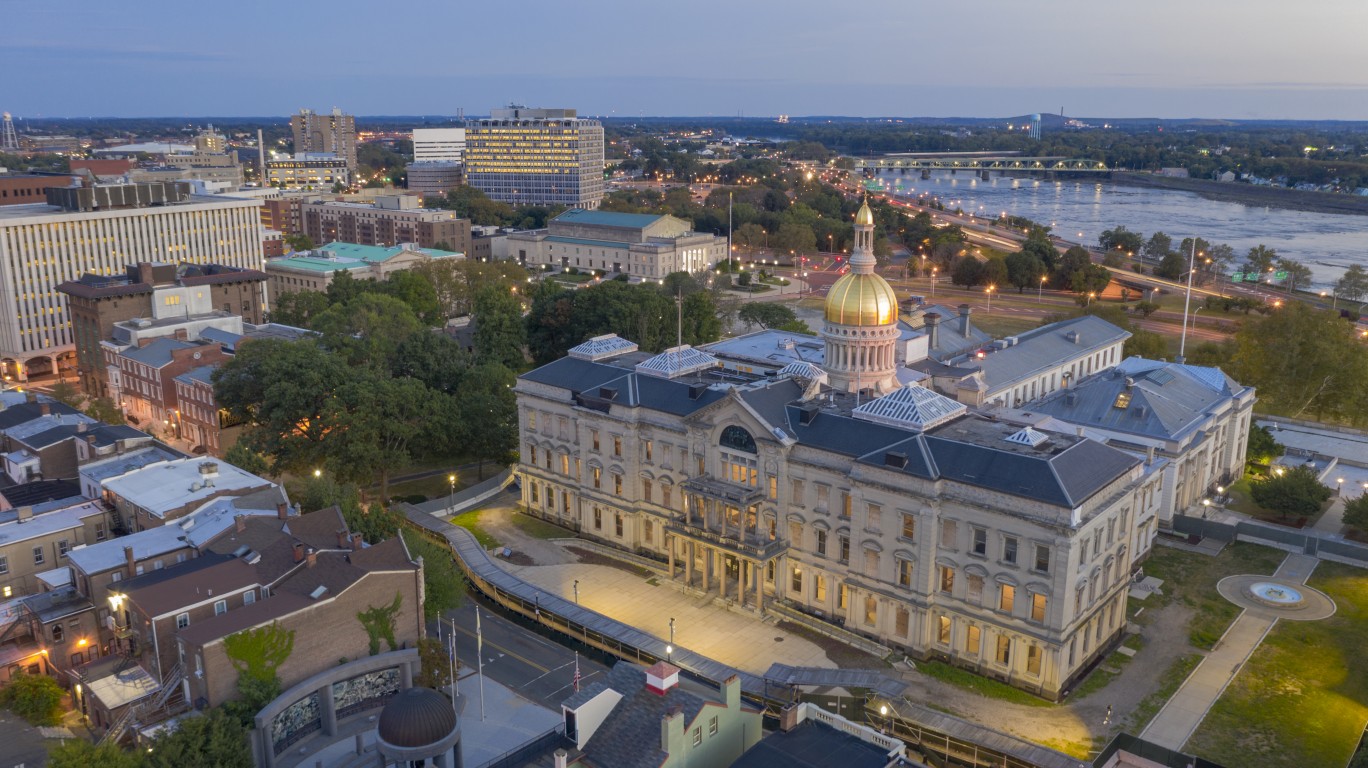
35. New Jersey
> Pct. workers in government, 2015: 15.3%
> Pct. workers in government, 2005: 15.9% (17th lowest)
> Chg. government workers (2005-2015): -4.4% (7th largest decrease)
> People per square mile: 1,195.5 (the most)
Government jobs tend to make up a smaller share of total employment in more densely populated areas. In New Jersey, which has the 15th lowest share of government workers relative to its workforce, there are nearly 1,200 residents for every square mile. This is the largest population density of any state in the country. Nationwide, there are approximately 87.4 people per square mile.
34. California
> Pct. workers in government, 2015: 15.3%
> Pct. workers in government, 2005: 16.1% (19th lowest)
> Chg. government workers (2005-2015): 1.6% (20th largest increase)
> People per square mile: 239.1 (11th most)
California employs 2.5 million local, state, and federal workers — the largest government workforce of any state in the country. Even more Californians are employed in other industries, like trade, transportation and utilities, as well as the state’s professional and business services sector. For this reason, the share of jobs in government, at 15.3%, is just under the national share.
[recirclink id=328204]
33. Arizona
> Pct. workers in government, 2015: 15.5%
> Pct. workers in government, 2005: 16.0% (18th lowest)
> Chg. government workers (2005-2015): 1.5% (18th largest increase)
> People per square mile: 56.3 (18th fewest)
The size of a state’s government often corresponds to the tax base and geographic composition of its residents. About nine in 10 Arizona residents live in an urban environment, slightly less than the eight in 10 Americans who do. Similarly, the typical Arizona household makes $49,928 a year, providing for a tax base slightly less than what the $53,482 national median household income does. Government employees account for 15.5% of the Arizona workforce, a share equivalent to the national proportion.
32. New York
> Pct. workers in government, 2015: 15.6%
> Pct. workers in government, 2005: 17.5% (20th highest)
> Chg. government workers (2005-2015): -3.4% (9th largest increase)
> People per square mile: 411.2 (7th most)
Between 2005 and 2015, the number of workers employed at the local, state, and federal level declined by about 50,000. It was one of just 14 states in which the number either decreased or remained unchanged. A disproportionately small segment of New York’s public employees are employed at the state or federal level. Nearly 75% of New York’s government employees are employed at the local level, compared to a national share of 63.8%.
[nativounit]
31. Missouri
> Pct. workers in government, 2015: 15.6%
> Pct. workers in government, 2005: 15.7% (16th lowest)
> Chg. government workers (2005-2015): 1.1% (16th largest increase)
> People per square mile: 87.1 (23rd fewest)
The share of government workers in Missouri is roughly in line with the number of public employees nationwide. Although members of the armed services are not counted as government employees, the state is home to several military bases that support non-enlisted federal government jobs, including mechanics, research analysts, and nurses. Of the government employees in the state, 12.4% are federal workers.
30. Texas
> Pct. workers in government, 2015: 15.7%
> Pct. workers in government, 2005: 17.3% (23rd highest)
> Chg. government workers (2005-2015): 10.3% (3rd largest increase)
> People per square mile: 96.3 (25th fewest)
Texas has more government workers than any state in the country, except California. However, it is also the second most populous state. When compared to its entire workforce, Texas’ local, state, and federal government employees account for 15.7% of all workers, roughly in line with the national share of 15.5%.
29. Georgia
> Pct. workers in government, 2015: 15.9%
> Pct. workers in government, 2005: 16.6% (22nd lowest)
> Chg. government workers (2005-2015): 1.8% (22nd largest increase)
> People per square mile: 168.4 (18th most)
The government sector is the second largest in the Peach State, trailing only the trade, transportation, and utilities sector. As is the case in most states, the majority of public sector workers in Georgia work for local municipalities. The Centers for Disease Control and Prevention, a branch of the Department of Health and Human Services, is headquartered in Atlanta, contributing to a larger-than-average share of federal employees. Of public sector workers in Georgia, 14.6% answer to Washington, slightly more than the 12.4% that do nationwide.
[nativounit]
28. Maine
> Pct. workers in government, 2015: 16.3%
> Pct. workers in government, 2005: 17.1% (24th lowest)
> Chg. government workers (2005-2015): -5.1% (6th largest decrease)
> People per square mile: 43.1 (13th fewest)
Just over 16% of Maine’s workforce is employed directly by the government. While that figure is slightly higher than is typical across the country, it does not fully capture the total share of workers in the state who are paid with tax dollars. The state is home to General Dynamics Bath Iron Works, a company that recently built a new stealth destroyer for the U.S. Navy. In 2014, the Navy awarded Bath Iron Works a $100 million contract for its role in developing another new combat ship.
27. Iowa
> Pct. workers in government, 2015: 16.3%
> Pct. workers in government, 2005: 16.6% (21st lowest)
> Chg. government workers (2005-2015): 4.0% (23rd largest increase)
> People per square mile: 54.5 (15th fewest)
The government sector is the second largest employer in the state of Iowa, with 255,000 employees as of 2015. Iowa passed through the recession relatively unscathed compared to most states. Its unemployment rate never exceeded 6.6%, while some states had unemployment rates more than double that. Likely as a result of of Iowa’s relative stability, few Iowa job sectors have fluctuated significantly over the past decade, including the government sector, which increased by just 4.0% over that time, close to the U.S. average.
[recirclink id=328107]
26. Colorado
> Pct. workers in government, 2015: 16.4%
> Pct. workers in government, 2005: 16.3% (20th lowest)
> Chg. government workers (2005-2015): 14.9% (2nd largest increase)
> People per square mile: 48.5 (14th fewest)
Government employees make up 16.4% of the Colorado workforce, the second largest share of any sector in the state. While the percentage of public sector employment has remained relatively unchanged since 2005, the number of employees has not. In the last decade, the number of Colorado residents who work for the government rose from 362,000 to 416,700. The 14.9% increase was the second largest of any state’s government sector in that time.
25. Louisiana
> Pct. workers in government, 2015: 16.4%
> Pct. workers in government, 2005: 19.8% (9th highest)
> Chg. government workers (2005-2015): -12.5% (the largest decrease)
> People per square mile: 104.9 (24th most)
To combat a budget shortfall brought on by a 2014 drop in oil prices, Louisiana implemented cuts to government payroll and education spending that were unprecedented in magnitude. Between 2005 and 2015, the number of government jobs in the state declined by 12.5% — by far the largest rollback in the sector nationwide. Louisiana is one of only five states over the last decade in which government employment fell as total employment grew.
24. Kentucky
> Pct. workers in government, 2015: 16.9%
> Pct. workers in government, 2005: 16.6% (23rd lowest)
> Chg. government workers (2005-2015): 5.6% (19th largest increase)
> People per square mile: 109.9 (22nd most)
In Kentucky, 41.6% of residents live in a rural area, the eighth largest such percentage of any state. A rural environment, with a population less concentrated than in an urban area, requires more resources to sustain a smaller population. This may partially explain why 16.9% of all employees in Kentucky work for the government, slightly higher than the 15.5% national share.
[nativounit]
23. Oregon
> Pct. workers in government, 2015: 16.9%
> Pct. workers in government, 2005: 17.2% (25th highest)
> Chg. government workers (2005-2015): 5.4% (20th largest increase)
> People per square mile: 39.9 (12th fewest)
In Oregon, the number of government employees went up by 7.5% between 2005 and 2015, remaining the second largest industry in the state. Despite the increase, government played a slightly larger role in the state’s economy in 2005. Employment growth across several private sector industries, including professional and business services, outpaced government growth. As a result, the percentage of residents who are employed by local, state, and federal government entities dropped from 17.2% in 2005 to 16.9% in 2015.
22. Utah
> Pct. workers in government, 2015: 17.0%
> Pct. workers in government, 2005: 17.6% (19th highest)
> Chg. government workers (2005-2015): 15.6% (the largest increase)
> People per square mile: 33.6 (10th fewest)
Of the 233,900 government employees in Utah, 15.0% work for the federal government, a slightly higher share than is typical. Many of the federal employees in the state are employed by the Department of the Interior, as Utah is home to five national parks, more than any other state, with the exception of Alaska and Hawaii.
[recirclink id=327134]
21. Nebraska
> Pct. workers in government, 2015: 17.0%
> Pct. workers in government, 2005: 17.2% (24th highest)
> Chg. government workers (2005-2015): 6.2% (14th largest increase)
> People per square mile: 23.8 (8th fewest)
Across Nebraska, there are just about 24 people per square mile, making it the eighth least densely populated state in the country. When people are less densely concentrated, it takes more resources to sustain them. This may partially explain why 17.0% of Nebraska’s workforce are employed in the government sector, slightly more than the 15.5% national share.
20. North Carolina
> Pct. workers in government, 2015: 17.0%
> Pct. workers in government, 2005: 17.1% (25th lowest)
> Chg. government workers (2005-2015): 7.5% (11th largest increase)
> People per square mile: 196.1 (15th most)
Once centered on manufacturing and tobacco, North Carolina’s economy has changed in recent years to incorporate larger information, finance, and leisure sectors. Between 2005 and 2010, employment in the mining, logging, and construction and manufacturing sectors shrank by 18.0% and 18.5%, while the information, finance, and leisure sectors grew at nearly the fastest pace in the country. Employment in North Carolina’s government sector has grown accordingly, expanding by 7.5% over the last decade, while employment in this sector nationwide grew only 0.9%.
19. Arkansas
> Pct. workers in government, 2015: 17.6%
> Pct. workers in government, 2005: 17.3% (22nd highest)
> Chg. government workers (2005-2015): 4.6% (22nd largest increase)
> People per square mile: 56.0 (17th fewest)
Over the last decade, Arkansas’ employment composition has changed significantly. Employment in the manufacturing and information sectors declined by 23.3% and 30.6%, respectively, nearly the largest downsizing of the sectors in any state. Meanwhile, employment in professional services, leisure and hospitality, and government outpaced the nation as a whole. Government employment expanded by 4.6%, about five times the 0.9% national growth rate.
[recirclink id=327858]
18. Idaho
> Pct. workers in government, 2015: 17.7%
> Pct. workers in government, 2005: 18.8% (12th highest)
> Chg. government workers (2005-2015): 3.7% (25th largest increase)
> People per square mile: 19.0 (7th fewest)
There are just 19 people per square mile in Idaho, making it the seventh least densely populated state in the country. When populations are spread out, more resources are required to sustain fewer people. The government is largely in charge of providing such resources, which may partially explain why 17.7% of Idaho’s workforce is employed in the public sector — a larger share than the 15.5% of Americans workers employed by the government.
17. Washington
> Pct. workers in government, 2015: 17.8%
> Pct. workers in government, 2005: 18.7% (14th highest)
> Chg. government workers (2005-2015): 6.7% (13th largest increase)
> People per square mile: 101.2 (25th most)
Most sectors in Washington’s economy have grown at an above-average pace over the past decade. Over that time period, employment in Washington’s government sector grew by 6.7%, or about 35,300 workers. Today, government employees account for 17.8% of the state’s workforce, a larger share than the 15.5% national figure.
[nativounit]
16. North Dakota
> Pct. workers in government, 2015: 17.9%
> Pct. workers in government, 2005: 21.8% (4th highest)
> Chg. government workers (2005-2015): 8.3% (7th largest increase)
> People per square mile: 9.7 (4th fewest)
North Dakota’s mining sector grew by 167% over the last 10 years, by far the largest growth in the sector of any state. The current share of the workforce employed in the sector, at 12.7%, eclipsed the sector’s relative concentration compared nearly any other state. the workforce of every other sector and effectively lowered the share of workers in government, even while public sector employment also increased in the state.
15. Vermont
> Pct. workers in government, 2015: 18.0%
> Pct. workers in government, 2005: 17.3% (21st highest)
> Chg. government workers (2005-2015): 5.8% (18th largest increase)
> People per square mile: 67.9 (21st fewest)
Unlike private enterprise, a minimum level of public services are necessary in every community — police and fire departments, road crews, and administrative offices, for example. For this reason, rural states like Vermont often have larger shares of government employees in their workforces. According to Kohli, another reason for Vermont’s large government sector may be due at least in part to its state university system. State government accounts for 34.2% of Vermont’s government workforce — the fourth largest share nationwide.
14. South Carolina
> Pct. workers in government, 2015: 18.0%
> Pct. workers in government, 2005: 18.0% (18th highest)
> Chg. government workers (2005-2015): 7.3% (12th largest increase)
> People per square mile: 153.9 (19th most)
Government employees comprise 18.0% of South Carolina’s workforce, slightly more than the 15.5% national share. Like many states with relatively large shares of government employees, South Carolina is fairly rural. More than a third of South Carolina’s population lives in rural areas. Nationally, only 19.3% of the population lives in rural areas.
[recirclink id=327626]
13. South Dakota
> Pct. workers in government, 2015: 18.2%
> Pct. workers in government, 2005: 19.3% (10th highest)
> Chg. government workers (2005-2015): 3.3% (24th largest increase)
> People per square mile: 10.7 (5th fewest)
There are just about 11 people per square mile in South Dakota, making it the fifth least densely populated state in the country. A rural population tends to require more resources to sustain fewer people. It is often the task of the government to provide such resources. This may partially explain why 18.2% of South Dakota employees work for the government, a larger share than the 15.5% nationally.
12. Kansas
> Pct. workers in government, 2015: 18.3%
> Pct. workers in government, 2005: 18.8% (13th highest)
> Chg. government workers (2005-2015): 2.4% (23rd largest increase)
> People per square mile: 34.9 (11th fewest)
Government employment in Kansas rose steadily over the past decade until 2012, when Governor Sam Brownback cut income taxes and, ultimately, government jobs. To preserve the governor’s vision of small government, jobs in local government were mostly spared. Today, 70.3% of government employment in the state is in local government, the third largest such share in the country.
[nativounit]
11. Virginia
> Pct. workers in government, 2015: 18.5%
> Pct. workers in government, 2005: 18.0% (17th highest)
> Chg. government workers (2005-2015): 7.5% (10th largest increase)
> People per square mile: 202.6 (14th most)
Many Virginians work in the nearby Washington D.C. area, home to some of the nation’s highest-paying and most stable government jobs. The typical Virginia household earns $64,792 annually, the eighth highest median household income of all states. Government jobs, especially federal ones, are relatively common. Of Virginia workers, 711,700, or 18.5% are employed by local, state, or federal governments. Of all government workers in the state, close to one quarter are employed by the federal government, the third largest such share of all states.
10. Maryland
> Pct. workers in government, 2015: 18.9%
> Pct. workers in government, 2005: 18.2% (16th highest)
> Chg. government workers (2005-2015): 7.9% (9th largest increase)
> People per square mile: 594.8 (5th most)
Maryland’s large share of government workers is due in part to its proximity to the nation’s capital. Of the 502,700 government workers in the state, 28.6% are employed at the federal level. This is the highest share of federal workers of any state and more than double the national average of 12.4%.
9. Alabama
> Pct. workers in government, 2015: 19.4%
> Pct. workers in government, 2005: 18.7% (15th highest)
> Chg. government workers (2005-2015): 4.0% (24th largest increase)
> People per square mile: 94.4 (24th fewest)
Of the 377,300 government workers in Alabama, a relatively high 14% share are federal employees — a relatively high percentage. The state is home to several military bases, and while those enlisted in military service are not counted as federal employees, the presence of military bases will always bring along federal government jobs for supporting roles. Some 19.4% of workers in Alabama work for either state, local, or federal government entities.
[nativounit]
8. Montana
> Pct. workers in government, 2015: 19.6%
> Pct. workers in government, 2005: 20.5% (7th highest)
> Chg. government workers (2005-2015): 4.6% (21st largest increase)
> People per square mile: 6.8 (3rd fewest)
There are just about seven people per square mile in Montana, making it the third least densely populated state in the country. The more sparsely populated a state, the more resources are required to provide for its residents. It is often the task of the government to provide such resources, which may explain the relatively large size of Montana’s government sector. Government employees make up 19.6% of Montana’s workforce, the eighth largest such share in the country.
7. Hawaii
> Pct. workers in government, 2015: 19.9%
> Pct. workers in government, 2005: 19.9% (8th highest)
> Chg. government workers (2005-2015): 5.9% (17th largest increase)
> People per square mile: 211.8 (13th most)
Almost one in every five workers in Hawaii is employed by the local, state, or federal government. By contrast, 15.5% of workers nationwide are employed in the public sector. Local governments employ a majority of public sector workers in most states. In Hawaii, however, this share, at just 14.9%, is exceptionally low. This could be partially due to the outsized effect employment at research and military facilities has on the state’s job market. Hawaii is home to numerous military bases and research facilities. According to the Hawaii Institute for Public Affairs, the Department of Defense invests over $6.5 billion Hawaii each year, one of the highest expenditures nationwide.
[recirclink id=327122]
6. West Virginia
> Pct. workers in government, 2015: 19.9%
> Pct. workers in government, 2005: 19.1% (11th highest)
> Chg. government workers (2005-2015): 6.1% (16th largest increase)
> People per square mile: 77.1 (22nd fewest)
Almost one-fifth of West Virginia’s workforce is employed in some level of government, a higher proportion than all but a handful of states. Residents of poor states are not necessarily more likely to work for the government than those in more wealthy states. However, predominantly rural areas, which are often also quite poor, frequently rely heavily on government spending. West Virginia is both relatively rural and relatively poor. The state’s population density of 77 people per square mile is lower than the national rate of 87 people. Also, one in every 10 households earns less than $10,000 annually, the second highest proportion nationwide.
5. Oklahoma
> Pct. workers in government, 2015: 21.1%
> Pct. workers in government, 2005: 21.0% (6th highest)
> Chg. government workers (2005-2015): 9.7% (6th largest increase)
> People per square mile: 54.7 (16th fewest)
Over the last decade, Oklahoma’s employment composition has changed significantly. Employment in the information sector has declined faster than all but two states, while increasing employment in mining, logging, and construction, leisure and hospitality, and government has outpaced the nation as a whole. Government sector workers today makes up 21.1% of the Oklahoma workforce, the fifth largest such share nationwide.
4. Mississippi
> Pct. workers in government, 2015: 21.5%
> Pct. workers in government, 2005: 21.3% (5th highest)
> Chg. government workers (2005-2015): 1.4% (17th largest increase)
> People per square mile: 63.2 (19th fewest)
In Mississippi, 22.6% of people live in poverty, more than in any other state in the nation. Workers in poor states are not necessarily more likely to work for the government than those in more wealthy states. However, predominantly rural communities, which are often very poor, often rely heavily on government spending. Also, while private enterprises may not be thriving in poorer, rural areas, a certain level of public services, including most notably education and safety services, will always be necessary. Over half of Mississippi’s population live in rural areas.
[nativounit]
3. New Mexico
> Pct. workers in government, 2015: 23.0%
> Pct. workers in government, 2005: 24.9% (2nd highest)
> Chg. government workers (2005-2015): -5.7% (5th largest decrease)
> People per square mile: 17.0 (6th fewest)
With only 17 people per square mile, New Mexico has the sixth-lowest population density of all states. With relatively low levels of private enterprise but necessary public services like safety and education, government tends to employ larger shares of the workforce in rural states. New Mexico is also home to a number of military research facilities, further increasing the level of government employment. According to think tank the Rand Corporation, the federal government spends over $2 billion on R&D in New Mexico annually, among the largest such expenditures nationwide.
2. Alaska
> Pct. workers in government, 2015: 24.2%
> Pct. workers in government, 2005: 26.2% (the highest)
> Chg. government workers (2005-2015): 1.6% (21st largest increase)
> People per square mile: 1.2 (the fewest)
Alaska is highly dependent on its oil industry. With the steep drop off in oil prices over the last several years, oil company investments have declined, layoffs have been announced, and even the government sector has slashed some of its spending. Alaska is the least densely populated state in the county and, like a number of other relatively rural states, Alaska’s workforce is dominated by the government sector. Rural communities are often extremely dependent on state funding.
[recirclink id=326784]
1. Wyoming
> Pct. workers in government, 2015: 24.6%
> Pct. workers in government, 2005: 24.7% (3rd highest)
> Chg. government workers (2005-2015): 9.7% (5th largest increase)
> People per square mile: 5.8 (2nd fewest)
The local, state, and federal governments in Wyoming account for 24.6% of jobs, a larger percentage than in any other state. The mining, logging, and construction sector also employs a relatively large share of state residents, accounting for 16.3% of the state’s workforce. This is the highest share of employment compared to any other state’s mining, logging, and construction sector. The drop in oil prices over the past several years has likely had an outsized effect on Wyoming’s economy, as well as on government revenue. Governor Matt Mead instituted a statewide hiring freeze at the end of last year.
Contact [email protected] for any questions or corrections.