[cnxvideo id=”655426″ placement=”ros”]The U.S. Census Bureau released on Wednesday new data from its 2015 nationwide population survey. According to the annual survey, the national median household income rose to $55,775 in 2015. No state reported income declines. While 39 states reported significant increases in household income, income levels in 11 states remained the same.
24/7 Wall St. ranked all 50 states according to the newly released median household income figures. Annual income levels range from $75,847 in Maryland to $40,593 in Mississippi.
[in-text-ad]
High-income states typically share certain social and economic characteristics. For example, residents of states with the highest incomes also tend to have high education levels. In 17 of the states reporting higher than average household incomes, college attainment rates also exceed the national attainment rate of 30.1%.
Click here to see America’s richest (and poorest) states.
While it certainly does not make up the difference between a poverty wage and a six-figure salary, residents of low-income states enjoy cheaper goods and services than residents of high-income states. For example, goods and services cost 10.3% more in Maryland than they do across the nation. In Mississippi, meanwhile, goods and services cost 13.4% less than the national average.
Similarly, home values closely mirror household incomes. In 18 of the states with high household incomes median home values exceed the national median home value of $194,500. The opposite is the case in the nation’s poorest states.
To identify the richest and poorest states with the highest and lowest median household income, 24/7 Wall St. reviewed state data on income from the U.S. Census Bureau’s 2015 American Community Survey (ACS). Median household income for all years is adjusted for inflation. Data on health insurance coverage, employment by industry, food stamp recipiency, poverty, and income inequality also came from the 2015 ACS. Income inequality is measured by the Gini coefficient, which is scaled from 0 to 1, with 0 representing perfect equality and 1 representing total inequality. We also reviewed annual average unemployment data from the Bureau of Labor Statistics (BLS) for 2014 and 2015.
These are America’s richest and poorest states.

50. Mississippi
> Median household income: $40,593
> Population: 2,992,333 (19th lowest)
> 2015 Unemployment rate: 6.5% (4th highest)
> Poverty rate: 22.0% (the highest)
With 2015 median household income unchanged from 2014, Mississippi is once again the poorest state in the country.The typical Mississippi household earned $40,593 last year, well below the national median income of $55,775. Mississippi also has the highest poverty rate in the country, with 22.0% of residents living below the poverty line. A relatively large share of state households are very poor. Some 11.5% earn $10,000 or less annually, the highest extreme poverty rate of any state. Similarly, there are relatively few affluent households in the state. Only 2.1% of Mississippi households earn $200,000 or more a year, the lowest such share.
[in-text-ad]

49. Arkansas
> Median household income: $41,995
> Population: 2,978,204 (18th lowest)
> 2015 Unemployment rate: 5.2% (24th highest)
> Poverty rate: 19.1% (4th highest)
Goods and services in Arkansas cost less on average than almost anywhere else in the country. While the relative affordability certainly helps low income households, state residents are still quite poor. The typical household earns $41,995 a year, second lowest after Mississippi. Also, 19.1% of people live in poverty, the fourth highest poverty rate of any state. Homes tend to have relatively low values to match the low incomes. At just $120,700, the typical home in Arkansas is valued at more than $70,000 below the national benchmark of $194,500.
[nativounit]
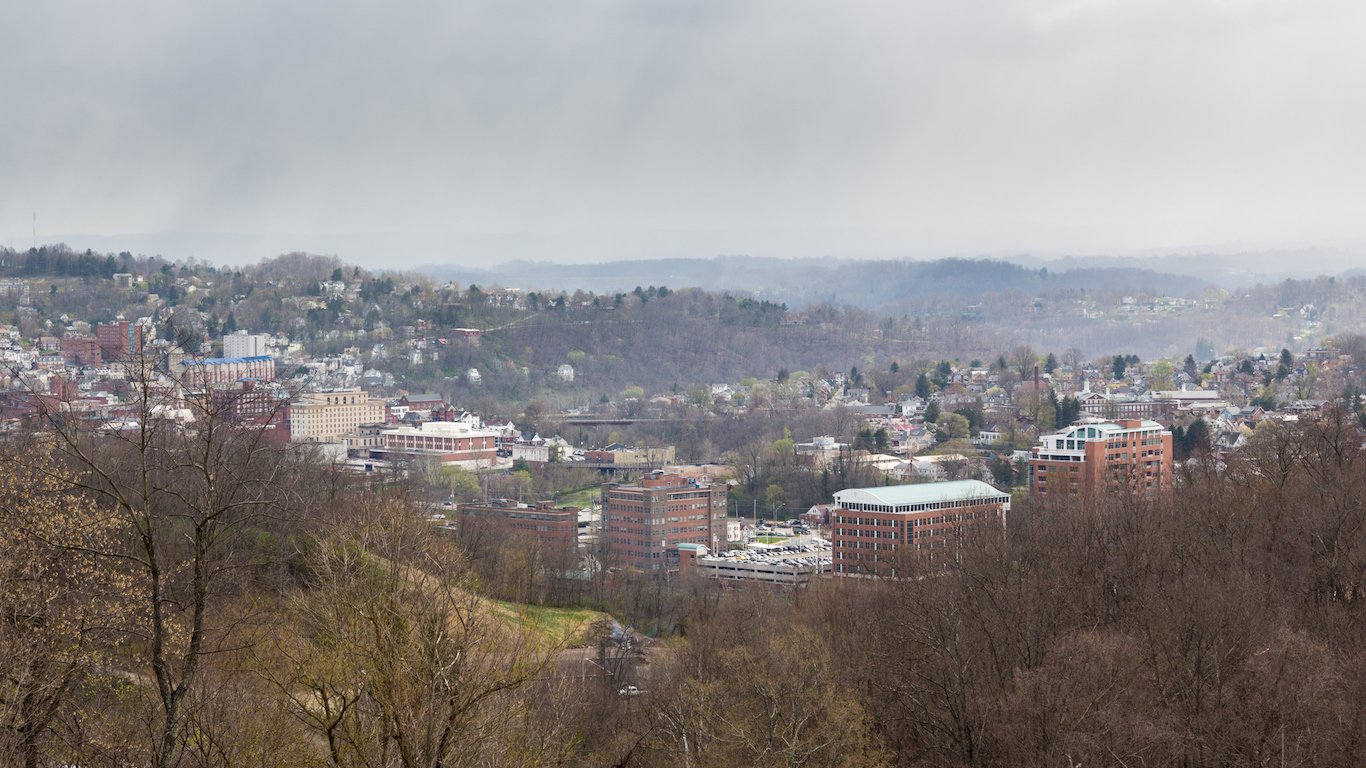
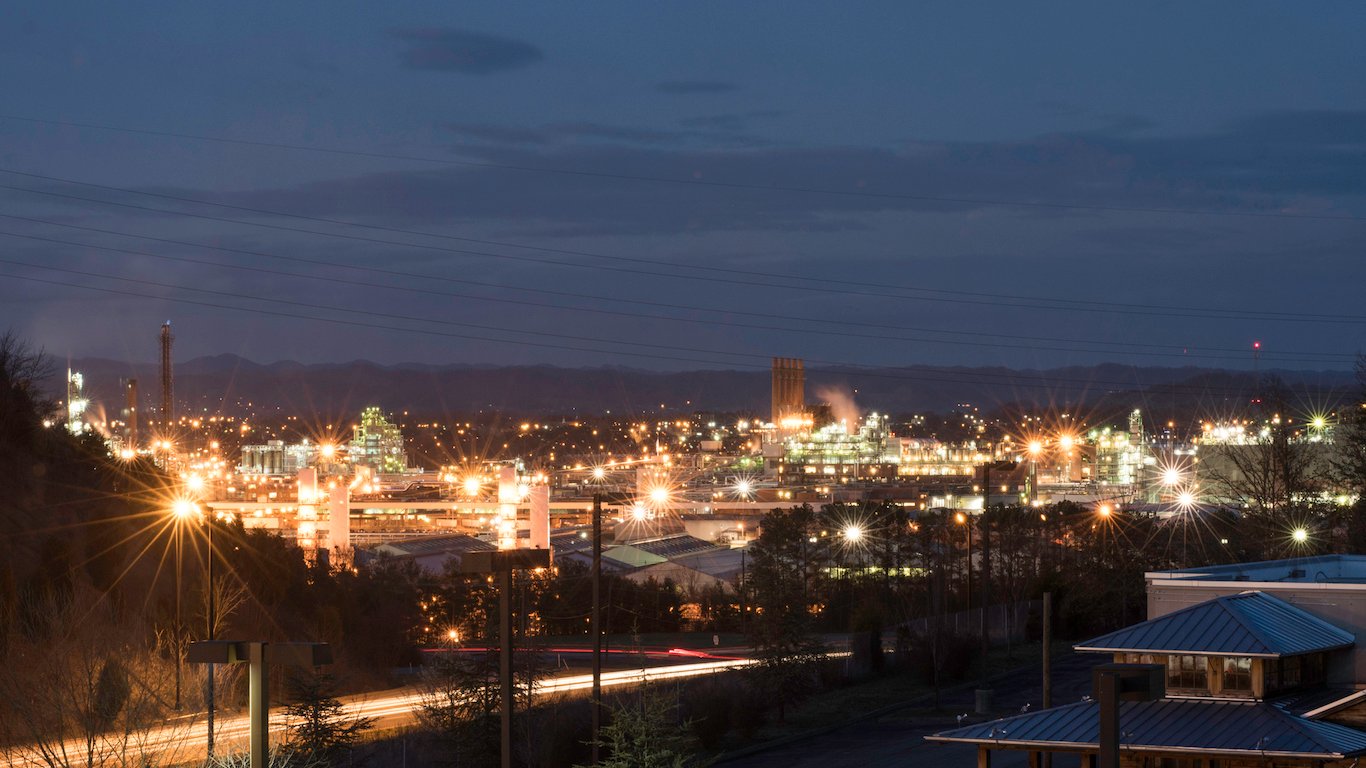
48. West Virginia
> Median household income: $42,019
> Population: 1,844,128 (13th lowest)
> 2015 Unemployment rate: 6.7% (the highest)
> Poverty rate: 17.9% (7th highest)
The typical West Virginia household earns $42,019, compared to the national median income of $55,775. Individuals struggling to find work who live on little to no income contribute to low household incomes in West Virginia. Of workers in the state, 6.7% were unemployed in 2015, the highest annual unemployment rate of any state.
West Virginia’s population is one of the largest recipients of government assistance programs such as SNAP, which each year help millions of people cope with poverty. Of households in the state, 16.0% use food stamps, the ninth highest share.
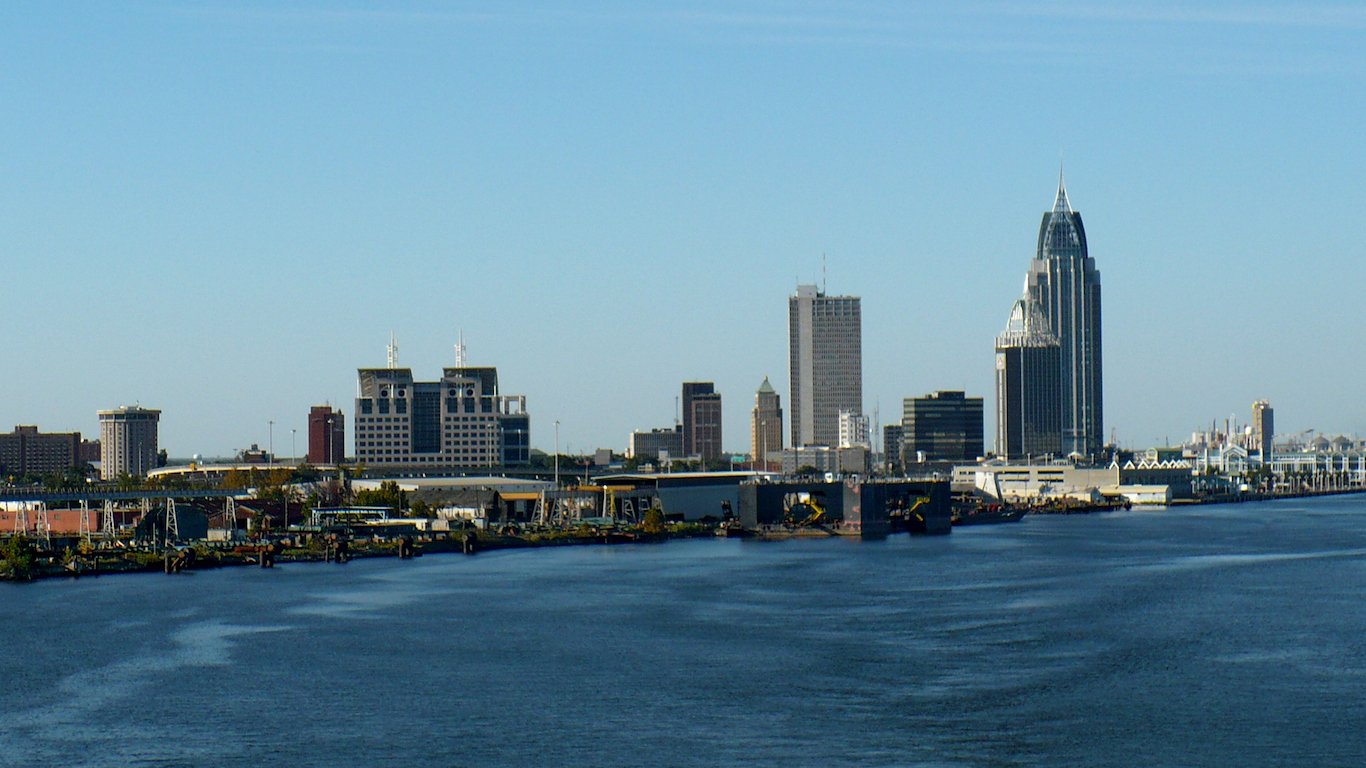
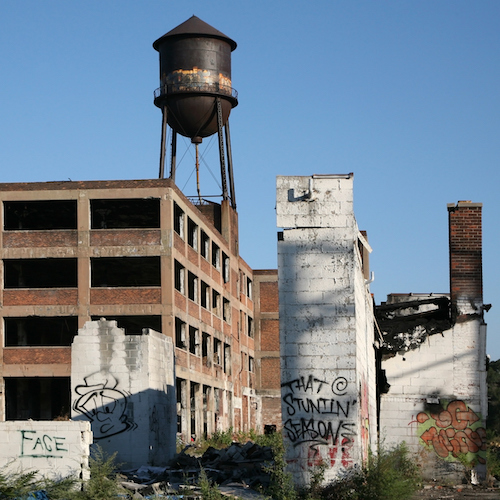
47. Alabama
> Median household income: $44,765
> Population: 4,858,979 (24th highest)
> 2015 Unemployment rate: 6.1% (8th highest)
> Poverty rate: 18.5% (5th highest)
Alabama is one of the poorest states in the nation with a median household income of $44,765 a year. However, this figure is notably higher than in 2014, when the median income, adjusted for inflation, was $42,895.
Like in many of the poorest states, Alabama’s poverty rate of 18.5% is among the highest of all states. Other problems the state faces are a high jobless rate and a high proportion of households relying on food stamps. Last year, 6.1% of workers were unemployed, the eighth highest jobless rate of any state. With low incomes, home values are also low in Alabama. The median home is worth $134,100, or more than $60,000 below the national benchmark of $194,500.
[recirclink id=352573]

46. Kentucky
> Median household income: $45,215
> Population: 4,425,092 (25th lowest)
> 2015 Unemployment rate: 5.4% (20th highest)
> Poverty rate: 18.5% (5th highest)
Like most states, Kentucky’s median household income of $45,215 a year has increased since 2014, when the median income, adjusted for inflation, was $43,014 a year. Residents are still quite poor, however. Kentucky’s poverty rate of 18.5% is the fifth highest poverty rate of all states. While no guarantee, a college degree substantially improves the odds of finding a job with a good wage. In Kentucky, just 23.3% of adults have a bachelor’s degree, considerably lower than the national college attainment rate of 30.6%.
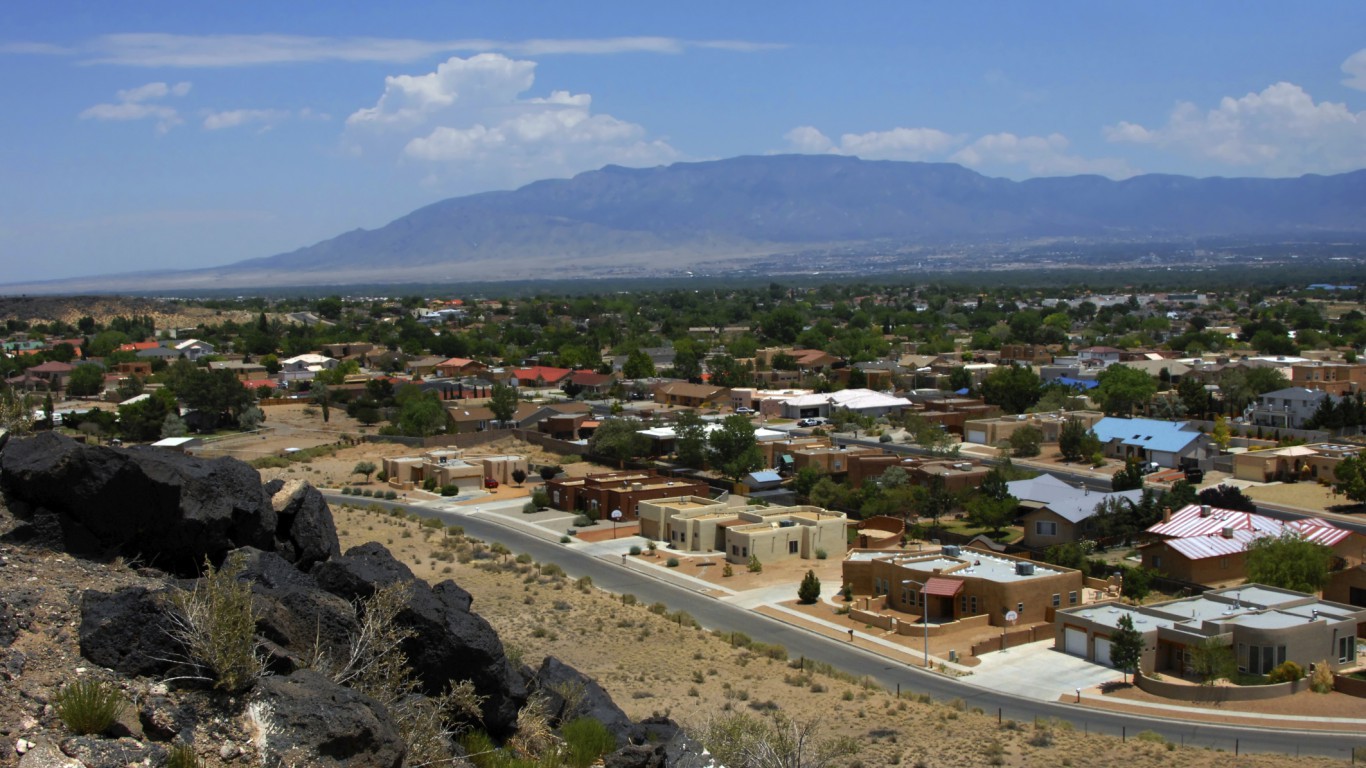
45. New Mexico
> Median household income: $45,382
> Population: 2,085,109 (15th lowest)
> 2015 Unemployment rate: 6.6% (3rd highest)
> Poverty rate: 20.4% (2nd highest)
New Mexico’s 2015 median household income remained unchanged from 2014, reflecting little improvement in the residents’ standard of living. The typical New Mexico household earns $45,382 a year, well below the national median income of $55,775. Like in many of the poorest states, poverty also continues to be a major problem in New Mexico. The state’s poverty rate of 20.4% is the second highest in the country.
[in-text-ad]
Incomes do not necessarily rise in healthy job markets, but high unemployment has a negative impact on household incomes. In 2015, 6.6% of New Mexico workers were unemployed, the third highest rate nationally.

44. Louisiana
> Median household income: $45,727
> Population: 4,670,724 (25th highest)
> 2015 Unemployment rate: 6.3% (6th highest)
> Poverty rate: 19.6% (3rd highest)
In addition to one of the lowest median household incomes, Louisiana has the third highest poverty rate in the country at 19.6%. Further, some state households earn incomes well below the poverty level. As many as one in 10 households earn $10,000 or less a year, the second highest such share of any state. Workers out of a job likely helped reduce median incomes in the state. At 6.3%, the state’s 2015 unemployment rate was sixth highest of all states.
Statewide, homes are valued at just $155,600, or more than $30,000 below the national benchmark of $194,500.
[nativounit]

43. South Carolina
> Median household income: $47,238
> Population: 4,896,146 (23rd highest)
> 2015 Unemployment rate: 6.0% (10th highest)
> Poverty rate: 16.6% (11th highest)
The typical household in South Carolina makes $47,238 a year, eighth lowest of all states. However, this figure is up significantly from 2014, when the median income, adjusted for inflation, was $45,277. Like in many of the poorest states, poverty remains a major problem. South Carolina’s poverty rate of 16.6% is 11th highest of any state. The state also faces a high jobless rate. In 2015, 6.0% of workers were unemployed, the 10 highest rate nationally.
Homes values in South Carolina, at just $148,600, are more than $40,000 below the national median home value of $194,500. While the low home values mirror the state’s low incomes, they also speak to the low cost of living in the state, which on average is nearly 10% cheaper than across the nation.
42. Tennessee
> Median household income: $47,275
> Population: 6,600,299 (17th highest)
> 2015 Unemployment rate: 5.8% (14th highest)
> Poverty rate: 16.7% (10th highest)
As was the case in most states, Tennessee’s median household income of $47,275 increased significantly from 2014, when the median income was $44,403. Still, Tennesseans are not wealthy. In addition to one of the lowest median household incomes, 16.7% of people live in poverty, the 10th highest poverty rate of all states.
Government programs help millions of impoverished Americans make ends meet, especially in the nation’s poorest states. In Tennessee, 17.6% of households rely on food stamps, a higher percentage than in all but two other states.
[wallst_email_signup]

41. North Carolina
> Median household income: $47,830
> Population: 10,042,802 (9th highest)
> 2015 Unemployment rate: 5.7% (15th highest)
> Poverty rate: 16.4% (12th highest)
North Carolina is one of the poorest states in the nation with a median household income of $47,830 a year. This figure is notably higher than in 2014, however, when median income, adjusted for inflation, was $46,585. Despite the improvement, poverty is still high in the state. At 16.4%, the state’s poverty rate is 12th highest of all states.
Low incomes tend to accompany low home values — and North Carolina is a case in point. Statewide, homes are valued at just $160,100, or more than $30,000 below the national median value of $194,500.

40. Idaho
> Median household income: $48,275
> Population: 1,654,930 (12th lowest)
> 2015 Unemployment rate: 4.1% (12th lowest)
> Poverty rate: 15.1% (20th highest)
While Idaho households tend to earn incomes well below the national median income of $55,775, the state’s job market is relatively healthy. Idaho’s 2015 unemployment rate of 4.1% was 12th lowest of all states, and exceptionally low compared with other low income states. Some portion of residents earn very high incomes in every state. In Idaho, however, only 2.7% of households earn $200,000 or more, nearly the lowest of any state. By contrast, 5.8% of households nationwide earn such high incomes.
[in-text-ad]

39. Oklahoma
> Median household income: $48,568
> Population: 3,911,338 (23rd lowest)
> 2015 Unemployment rate: 4.2% (15th lowest)
> Poverty rate: 16.1% (13th highest)
The typical Oklahoma household earns $48,568 in a year, well below the national median income of $55,775. With lower incomes, home values are also low. Statewide, the median home value is just $126,800, more than $60,000 below the national median home value of $194,500.
A college education opens doors to more and higher paying job opportunities. In Oklahoma, fewer than one in four adults have a bachelor’s degree, one of the lowest proportions of all states. This could partially explain the relatively low incomes in the state.
[recirclink id=352208]

38. Florida
> Median household income: $49,426
> Population: 20,271,272 (3rd highest)
> 2015 Unemployment rate: 5.4% (20th highest)
> Poverty rate: 15.7% (16th highest)
The typical Florida household earns $49,426, well below the national median income of $55,775. The housing crisis slammed Florida harder than most states. While home values in the state rose from $162,700 in 2014 to $179,800 in 2015, the value remains $10,000 below the national median value of $194,500.
Wages rose across the nation and in most states, but the distribution of that income has worsened. Income distribution in Florida is especially unequal — the Gini coefficient pegs the state fifth worst for income inequality.

37. Montana
> Median household income: $49,509
> Population: 1,032,949 (7th lowest)
> 2015 Unemployment rate: 4.1% (12th lowest)
> Poverty rate: 14.6% (24th highest)
The typical Montana household earns $49,509, well below the national median income of $55,775. While household income is lower than the national income level, home values in the state are relatively high. The median value of a home in the state is $209,500, higher than the national median home value of $194,500.
The percentage of Montana adults who have at least a high school diploma increased to 93.5%, now the highest share of any state. The state’s bachelor’s attainment rate of just under 30% is inline with the national attainment rate.
[nativounit]

36. Missouri
> Median household income: $50,238
> Population: 6,083,672 (18th highest)
> 2015 Unemployment rate: 5.0% (24th lowest)
> Poverty rate: 14.8% (21st highest)
Missouri’s unemployment rate dropped by 1.2 percentage points in 2015 compared to 2014, nearly the largest improvement of any state. However, at 5.0%, the state’s unemployment rate is still just slightly below the national jobless rate of 5.2%. As in many other relatively low income states, Missouri’s median home value of $147,800 is more than $40,000 below the national benchmark of $194,500.

35. Indiana
> Median household income: $50,532
> Population: 6,619,680 (16th highest)
> 2015 Unemployment rate: 4.8% (20th lowest)
> Poverty rate: 14.5% (25th highest)
The typical Indiana household earns about $5,000 less than the national median income level. Low incomes often occur in places with low levels of education. In Indiana, 24.9% of adults have a bachelor’s degree, one of the lowest college attainment rates in the country and more than 5 percentage points below the national rate. Statewide, homes have relatively low values at a median of just $131,000, or more than $60,000 below the national median home value of $194,500.
[in-text-ad]

34. Ohio
> Median household income: $51,075
> Population: 11,613,423 (7th highest)
> 2015 Unemployment rate: 4.9% (22nd lowest)
> Poverty rate: 14.8% (21st highest)
Ohio has a median household income of $51,075, about $4,700 less than the national median income. Places with lower incomes tend to have less valuable real estate. In Ohio, homes are valued relatively low at just $136,400, or more than $50,000 below the national benchmark of $194,500. Low incomes in the state may be tied to the relatively small share of adults with a college education. In Ohio, just 26.8% of adults have a bachelor’s degree. Conditions may be improving slightly in the state as the share of Ohio’s population living in poverty has declined from 16.4% to 14.8%.
[wallst_email_signup]

33. Michigan
> Median household income: $51,084
> Population: 9,922,576 (10th highest)
> 2015 Unemployment rate: 5.4% (20th highest)
> Poverty rate: 15.8% (15th highest)
Michigan’s median household income of $51,084 In many states with lower household incomes, poverty is also a problem. Michigan has the 15th highest poverty rate in the country at 15.8% of residents. A weak job market can be a drag on incomes. At 5.4%, the state had one of the highest unemployment rates in the country in 2015. Low incomes often correspond with low educational attainment, and Michigan is no exception. In Michigan, 27.8% of adults have a bachelor’s degree compared to a national college attainment rate of 30.6%.

32. Georgia
> Median household income: $51,244
> Population: 10,214,860 (8th highest)
> 2015 Unemployment rate: 5.9% (12th highest)
> Poverty rate: 17.0% (9th highest)
While not a perfect correlation, poverty tends to be more common in low income states. Georgia’s poverty rate of 17.0% is ninth highest in the country. To help alleviate conditions for those living below the poverty line, the government assists a disproportionate number of Georgia families. The 14.1% of state households relying on food stamps is the 15th highest such share in the country. The state’s low incomes are also likely tied to its relatively weak job market. At 5.9%, the state had one of the higher unemployment rates in the country in 2015.
[nativounit]
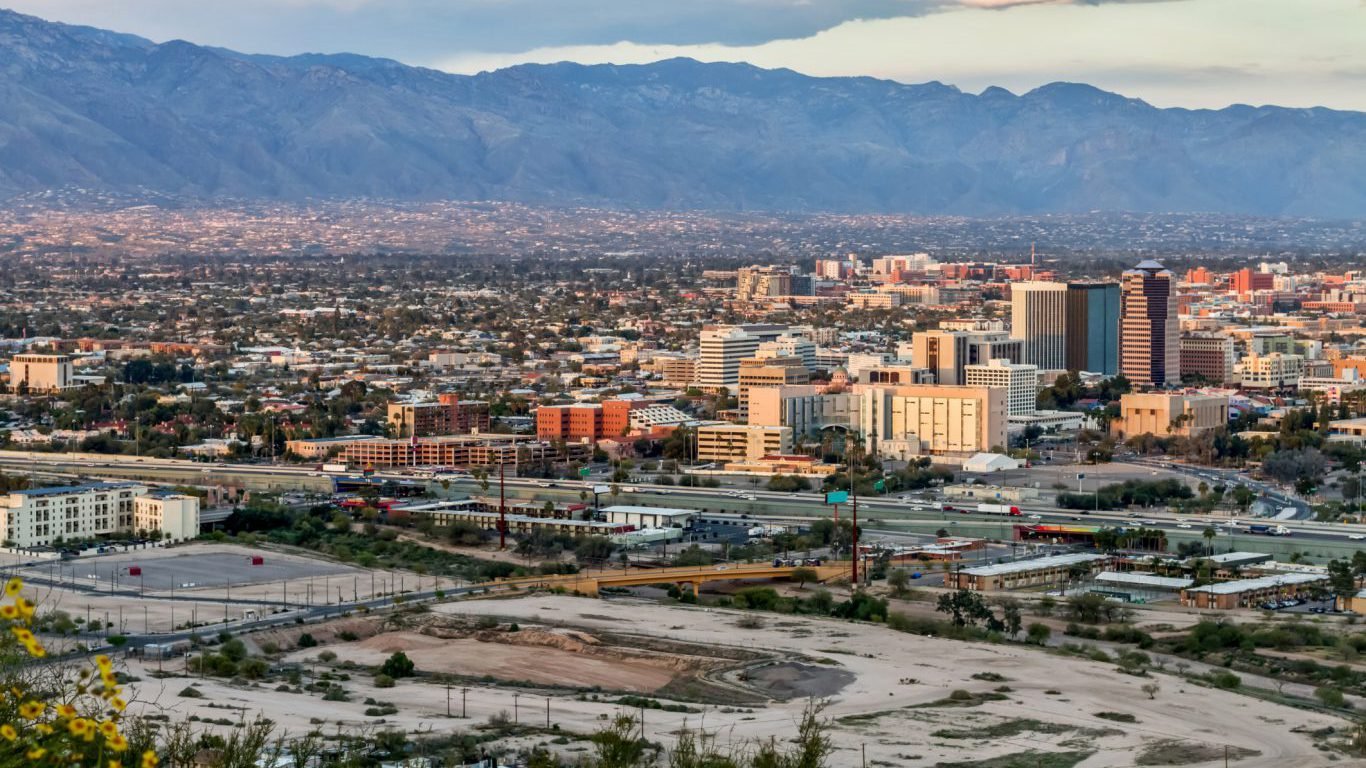
31. Arizona
> Median household income: $51,492
> Population: 6,828,065 (14th highest)
> 2015 Unemployment rate: 6.1% (8th highest)
> Poverty rate: 17.4% (8th highest)
States with high unemployment tend to have lower incomes. Arizona’s 2015 annual unemployment rate of 6.1% was the eighth highest in the country. Matching another trend among low-income states, Arizona also has the eighth highest poverty rate in the country at 17.4%. The state’s low incomes may be tied to the relatively small share of adults in the state who pursued higher education. Just 27.7% of adults in Arizona have a bachelor’s degree.

30. Maine
> Median household income: $51,494
> Population: 1,329,328 (9th lowest)
> 2015 Unemployment rate: 4.4% (17th lowest)
> Poverty rate: 13.4% (22nd lowest)
An educated population tends to earn more. Despite the higher than average 91.7% share of adults with at least a high school education, incomes in Maine are relatively low. The typical household in the state earns $51,494 a year, roughly $4,300 less than the typical American household. Low incomes may be due to a large proportion of the state’s workforce being employed in a low-paying industry. In fact, 13.1% of Maine’s workforce is employed in the retail sector, the second highest share in the country.
[in-text-ad]

29. Nevada
> Median household income: $52,431
> Population: 2,890,845 (16th lowest)
> 2015 Unemployment rate: 6.7% (the highest)
> Poverty rate: 14.7% (23rd highest)
Nevada’s median household income of $52,431 a year is not a significant improvement from 2014. Indeed, economic stagnation is a major problem in the state. The 6.7% unemployment rate in 2015 was the worst in the country. While nevada was hit hard by the housing crisis, the state’s home values today are relatively high. The typical home in the state is worth $221,400, compared to the national median home value of $194,500.
[nativounit]

28. South Dakota
> Median household income: $53,017
> Population: 858,469 (5th lowest)
> 2015 Unemployment rate: 3.1% (3rd lowest)
> Poverty rate: 13.7% (24th lowest)
The typical South Dakota household earns only $53,017 a year, nearly $2,800 less than the typical American household. Despite lower incomes, the state’s economy is faring relatively well. Only 3.1% of the state’s workforce were unemployed in 2015, the third smallest rate of any state in the country. A dollar also goes a lot farther in South Dakota than in nearly every other state. Goods and services are 12% cheaper in the state than they are across the country as a whole.

27. Kansas
> Median household income: $53,906
> Population: 2,911,641 (17th lowest)
> 2015 Unemployment rate: 4.2% (15th lowest)
> Poverty rate: 13.0% (20th lowest)
The median household income in Kansas increased to $53,906 from $52,556 in 2014. Despite the increase, the typical household in the state makes about $1,900 less than the typical American household. Lower incomes may not be felt as much, however, as goods and services are 9.3% less expensive in Kansas than they are nationwide. A lower cost of living may partially explain the relatively low food stamp recipiency rate. Only 8.6% of area households rely on food stamps, the sixth smallest share of any state in the country.
[recirclink id=351971]

26. Oregon
> Median household income: $54,148
> Population: 4,028,977 (24th lowest)
> 2015 Unemployment rate: 5.7% (15th highest)
> Poverty rate: 15.4% (17th highest)
The typical Oregon household earns $54,148 a year, roughly $1,600 less than the typical American household. In addition to lower than average incomes, the state faces a high jobless rate and a high food stamp recipiency rate. Last year, 5.7% of workers were unemployed, the 15th highest rate nationally. Even more striking, 18.9% of households currently rely on food stamps, the largest share of any state in the country.

25. Iowa
> Median household income: $54,736
> Population: 3,123,899 (21st lowest)
> 2015 Unemployment rate: 3.7% (9th lowest)
> Poverty rate: 12.2% (17th lowest)
Iowa’s 2015 median household income of $54,736 is effectively unchanged from the previous year, reflecting little improvement in the residents’ standard of living. Considering that incomes nationwide increased in 2015, state residents are relatively poorer — the typical Iowa household used to earn slightly more than the typical American household, but it now earns about $1,000 less. Though incomes are lower, a dollar goes further in Iowa than it does across the country. Goods and services are nearly 10% cheaper in Iowa than they are nationwide.
[in-text-ad]

24. Nebraska
> Median household income: $54,996
> Population: 1,896,190 (14th lowest)
> 2015 Unemployment rate: 3.0% (2nd lowest)
> Poverty rate: 12.6% (19th lowest)
The typical Nebraska household earns $54,996 a year. Though the state’s median household income is nearly $1,000 lower than the corresponding national figure, it is significantly higher than it was in 2014, when the typical Nebraska household earned $52,707.
While Nebraska residents may not be the highest earners in the country, they benefit from several important economic advantages. Goods and services are 9.4% cheaper in the state than they are across the country, and the state’s 3% unemployment rate in 2015 was the second lowest in the country.
[nativounit]
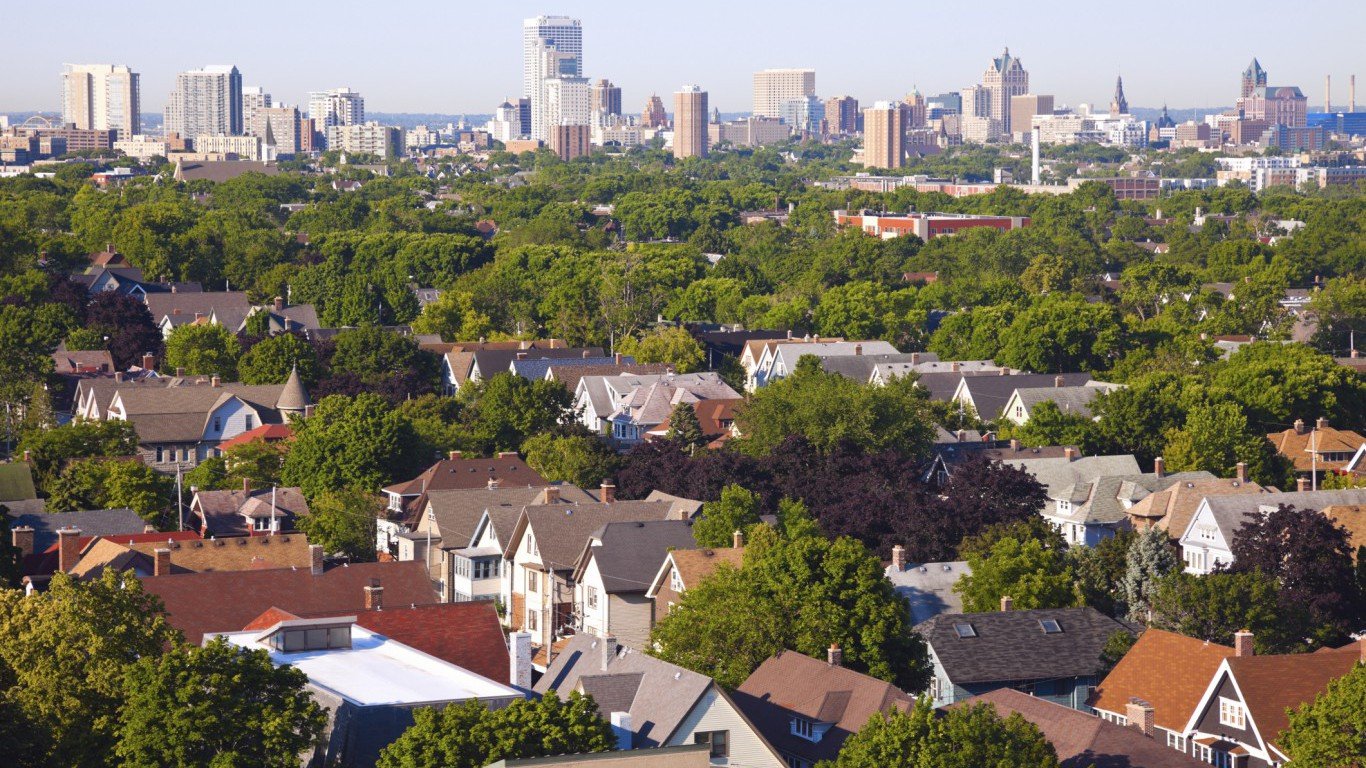
23. Wisconsin
> Median household income: $55,638
> Population: 5,771,337 (20th highest)
> 2015 Unemployment rate: 4.6% (19th lowest)
> Poverty rate: 12.1% (15th lowest)
The typical Wisconsin household earns $55,638 a year, only about $150 less than the median income nationwide. While incomes across the state are roughly in line with the nation as a whole, income inequality is far less pronounced in Wisconsin. With one of the lowest Gini coefficients of any state in the country, income is relatively evenly distributed across the Wisconsin’s 5,771,337 residents.
Homes across the state are worth less than homes across the country. The typical Wisconsin home is valued at just $168,300, or more than $20,000 below the national median home value of $194,500.

22. Texas
> Median household income: $55,653
> Population: 27,469,114 (2nd highest)
> 2015 Unemployment rate: 4.5% (18th lowest)
> Poverty rate: 15.9% (14th highest)
Only 82.4% of adults in Texas have completed high school, the second smallest share of any state in the country. While a high school education is a fundamental precursor to most careers, incomes in Texas are roughly in line with typical earnings nationwide. The typical household in Texas earns $55,653 a year, a significant increase from $53,105 in 2014. Nationwide, median household income has risen to $55,775 a year from $53,713 in 2014.
[wallst_email_signup]
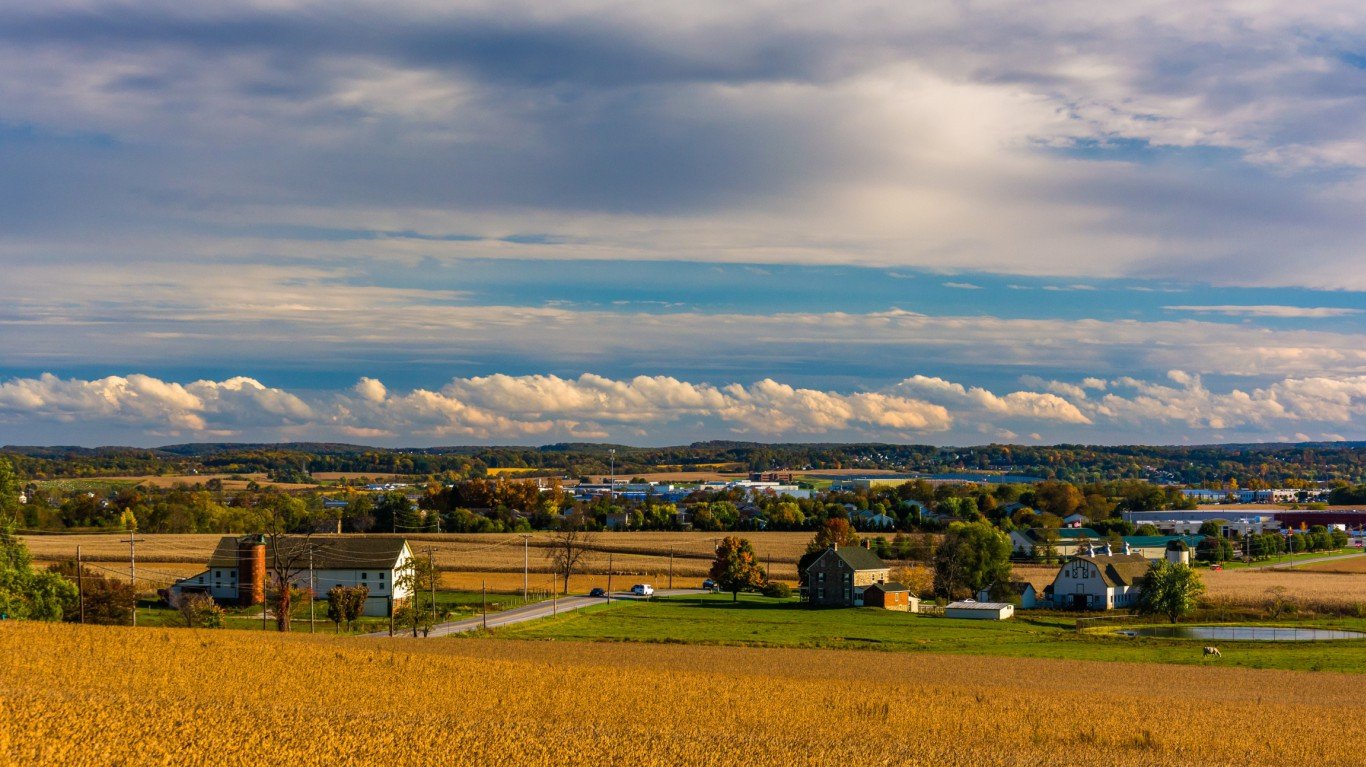
21. Pennsylvania
> Median household income: $55,702
> Population: 12,802,503 (6th highest)
> 2015 Unemployment rate: 5.1% (25th lowest)
> Poverty rate: 13.2% (21st lowest)
Increasing by about $2,500 from 2014, the $55,702 median household income in Pennsylvania remains roughly in line with the nationwide median income. Though home values in the state have increased dramatically last year, they remain well below the value of a typical American home. The median home value in the Keystone State is just $170,600, or more than $20,000 below the national median home value of $194,500.

20. Vermont
> Median household income: $56,990
> Population: 626,042 (2nd lowest)
> 2015 Unemployment rate: 3.7% (9th lowest)
> Poverty rate: 10.2% (4th lowest)
The typical Vermont household earns $56,990 a year, roughly $1,200 more than the typical American household. With a slightly higher than normal median household income, poverty is far less common in the Green Mountain State than it is across the country. Only 10.2% of Vermonters live below the poverty line, a smaller share than in all but three other states. Higher incomes and a lower poverty rate across the state is likely partially attributable to higher educational attainment rates. In Vermont, 36.9% of adults have at least a bachelor’s degree, higher than 30.6% of American adults with similar education.
[in-text-ad]

19. Rhode Island
> Median household income: $58,073
> Population: 1,056,298 (8th lowest)
> 2015 Unemployment rate: 6.0% (10th highest)
> Poverty rate: 13.9% (25th lowest)
The typical Rhode Island household earns $58,073 a year compared to the $55,775 the typical American household earns. While incomes in Rhode Island tend to be slightly higher than they are across the country as a whole, state residents are more likely than the typical American to struggle in other ways. Economic problems the state faces include a high jobless rate and a high proportion of households relying on food stamps. Last year, 6.0% of workers were unemployed, the 10th highest rate nationally. Meanwhile, 16.2% of households rely on food stamps, the sixth highest rate.
[recirclink id=351872]

18. Illinois
> Median household income: $59,588
> Population: 12,859,995 (5th highest)
> 2015 Unemployment rate: 5.9% (12th highest)
> Poverty rate: 13.6% (23rd lowest)
High median incomes and a low poverty rate demonstrate how Illinois has one of the most equitable income distributions in the country. Statewide, homes were valued relatively low, at just $180,300, or more than $10,000 below the national benchmark of $194,500. Illinois’s relatively high education attainment rate partly accounts for high incomes in the area. More than 32.9% of adults had at least a bachelor’s degree last year, compared to 30.6% nationally.

17. Wyoming
> Median household income: $60,214
> Population: 586,107 (the lowest)
> 2015 Unemployment rate: 4.2% (15th lowest)
> Poverty rate: 11.1% (10th lowest)
Wyoming was one of only two states to report an uptick in unemployment in 2015 compared to 2014. Despite a worsening job market, incomes across the state rose significantly. The typical Wyoming household earns $60,214 a year, up from $57,080 in 2014.
Higher levels of education typically lead to higher incomes. Despite having a higher median household income than most states, a relatively small share of adults in Wyoming are college educated. Only 26.2% of adults in the state have a bachelor’s degree, a considerably smaller share than the 30.6% share of American adults with similar education.
[nativounit]

16. North Dakota
> Median household income: $60,557
> Population: 756,927 (4th lowest)
> 2015 Unemployment rate: 2.7% (the lowest)
> Poverty rate: 11.0% (9th lowest)
For the second year in a row, North Dakota’s 2.7% annual unemployment rate was the lowest in the country. The strong job market across the state contributes to higher incomes. The typical household in the state earns $60,557 a year, nearly $5,000 more than the typical American household. While incomes across the state are relatively high, they have not increased significantly from the previous year, likely at least in part due to persistent low oil prices.
With higher than average incomes and low unemployment, a small share of North Dakota residents depend on government assistance. Only 6.9% of households in the state receive food stamps, roughly half the comparable nationwide share.

15. New York
> Median household income: $60,850
> Population: 19,795,791 (4th highest)
> 2015 Unemployment rate: 5.3% (23rd highest)
> Poverty rate: 15.4% (17th highest)
While the median household income in New York is relatively high — roughly $5,000 higher than the corresponding national figure — not all state residents are benefitting. Alongside higher incomes is a higher poverty rate. In fact, New York is one of a handful of rich states with a poverty rate above the 14.7% national rate — 15.4% of state residents live in poverty. With higher than average incomes and relatively pervasive poverty, New York has the worst income inequality in the country.
[in-text-ad]
Those at the lower end of the income spectrum are further strained by a high cost of living. Goods and services are 15.7% more expensive in New York than they are across the country as a whole.

14. Delaware
> Median household income: $61,255
> Population: 945,934 (6th lowest)
> 2015 Unemployment rate: 4.9% (22nd lowest)
> Poverty rate: 12.4% (18th lowest)
Delaware’s median household income has not increased meaningfully last year, reflecting little improvement in the residents’ standard of living. Still, incomes in the state remain considerably higher than they are across the country. High median incomes likely drove up home values. The median home value in the state of $240,200 is among the higher values nationwide.
Higher educational attainment typically translates to higher incomes. Delaware residents benefit from higher incomes despite having a college attainment rate roughly in line with that of the nation. In Delaware, 30.9% of adults have a bachelor’s degree compared to 30.6% of adults nationwide.
[wallst_email_signup]

13. Utah
> Median household income: $62,912
> Population: 2,995,919 (20th lowest)
> 2015 Unemployment rate: 3.5% (5th lowest)
> Poverty rate: 11.3% (12th lowest)
The typical household in Utah earns $62,912 a year, over $7,000 more than the typical American household. Furthermore, only 11.3% of state residents live in poverty, well below the 14.7% of American residents who do. With high incomes and a low poverty rate, Utah has the lowest income inequality in the country.
The relative prosperity and equality across the state is likely bolstered by a healthy job market. The state’s 3.5% unemployment rate was one of the lowest in the country in 2015.
12. Minnesota
> Median household income: $63,488
> Population: 5,489,594 (21st highest)
> 2015 Unemployment rate: 3.7% (9th lowest)
> Poverty rate: 10.2% (4th lowest)
Higher levels of education typically lead to higher incomes. In Minnesota, where 34.7% of adults have at least a bachelor’s degree compared to 30.6% of adults nationally, incomes are also — predictably — higher. The typical household in the state earns $63,488 annually, considerably more than the $55,775 the typical American household earns a year. In addition to higher incomes, poverty is relatively scarce in Minnesota. Only 10.2% of state residents live below the poverty line, the fourth smallest share of any state.
[nativounit]

11. Colorado
> Median household income: $63,909
> Population: 5,456,574 (22nd highest)
> 2015 Unemployment rate: 3.9% (10th lowest)
> Poverty rate: 11.5% (14th lowest)
Incomes in Colorado have increased meaningfully in 2015, while the food stamp recipiency rate fell. The typical household in the state earns $63,909 a year, up from $61,351 in 2014. Meanwhile, only 8.4% of state residents rely on food stamps, down half a percentage point from 2014. Both of these measures demonstrate that Colorado is better off economically than much of the country.
The state’s improved economic outcomes are likely the result of an improving job market. The 3.9% unemployment rate in 2015 was one of the lowest in the country and a marked improvement over the 5.0% unemployment rate in 2014.

10. Washington
> Median household income: $64,129
> Population: 7,170,351 (13th highest)
> 2015 Unemployment rate: 5.7% (15th highest)
> Poverty rate: 12.2% (17th lowest)
At $64,129, the annual median household income in Washington is the 10th highest of all states. Washington’s relatively high educational attainment rate partly accounts for the higher incomes. Of adults in the state, 34.2% have a bachelor’s degree compared to 30.6% of adults nationwide. High incomes are likely driving up home values in the state. The typical Washington home is worth $284,000, one of the highest values nationwide.
[in-text-ad]
Still, the state is not without some economic challenges. Last year, 5.7% of workers were unemployed, the 15th highest jobless rate nationally. In addition,14.5% of households rely on food stamps, a slightly larger share than the national 12.8% recipiency rate.

9. California
> Median household income: $64,500
> Population: 39,144,818 (the highest)
> 2015 Unemployment rate: 6.2% (7th highest)
> Poverty rate: 15.3% (19th highest)
A typical California household earns $64,500 a year, far higher than the national median income of $55,775. The cost of living is especially high in California, however, with goods and services costing an average of 12.4% more than they do across the country. Relatively high incomes are likely driving up home values. The typical home in the state is worth $449,100, more than double the value of the typical American home.
Although California is home to some of the wealthiest individuals nationwide, 15.3% of state residents live in poverty. California is one of a handful of rich states with poverty rates above the national poverty rate of 14.7%. Indeed, income inequality as measured by the Gini coefficient is more pervasive in California than in all but three other states.
[nativounit]

8. Virginia
> Median household income: $66,262
> Population: 8,382,993 (12th highest)
> 2015 Unemployment rate: 4.4% (17th lowest)
> Poverty rate: 11.2% (11th lowest)
Higher educational levels typically lead to higher earning power. In Virginia, 37.0% of adults have a bachelor’s degree, a larger share than in all but five other states. Partially as a result, incomes are higher than average in the state. The state is home to a larger share of households earning at least $200,000 a year than the country. It is also home to a smaller share of households earning less than $10,000 a year than the country as a whole. With more higher earners and fewer low earners, a typical Virginia household earns about $10,500 more than the typical American household.
Higher incomes are also partially the result of a relatively healthy job market. The 2015 unemployment rate in the state was only 4.4%, nearly a full percentage point below the national unemployment rate.

7. New Hampshire
> Median household income: $70,303
> Population: 1,330,608 (10th lowest)
> 2015 Unemployment rate: 3.4% (4th lowest)
> Poverty rate: 8.2% (the lowest)
A typical New Hampshire household earns $73,303 a year, nearly $15,000 more than the typical American household. High median incomes are likely driving up home values in the state. The median New Hampshire home value of $244,500 is among the higher values nationwide.
New Hampshire’s relatively high education attainment rates partly accounts for the high incomes in the area. More than 35.7% of state adults have at least a bachelor’s degree compared to 30.6% of adults nationally. Similarly, while 87.1% of the country’s adults have graduated from high school, 93.1% of New Hampshire’s adults have, second most in the country.
[recirclink id=351747]

6. Massachusetts
> Median household income: $70,628
> Population: 6,794,422 (15th highest)
> 2015 Unemployment rate: 5.0% (24th lowest)
> Poverty rate: 11.5% (14th lowest)
Massachusetts is one of only a handful of states to report a median household of more than $70,000 annually. The state is home to some of the nation’s most prestigious universities, and fittingly boasts the highest college attainment rate of any state at 41.5%. By contrast, 30.1% of adults nationwide have at least a bachelor’s degree. While no guarantee, a college education helps open higher-paying job opportunities, and it is no surprise that some state households are very wealthy. One in every 10 households in the state earns $200,000 or more each year, the third highest such share of any state. High median incomes are likely driving up home values. The median home value of $352,100 in the state is among the highest nationwide.

5. Connecticut
> Median household income: $71,346
> Population: 3,590,886 (22nd lowest)
> 2015 Unemployment rate: 5.6% (18th highest)
> Poverty rate: 10.5% (6th lowest)
A typical Connecticut household earns $71,346 in a year, considerably higher than the national median income of $55,775. With such high incomes, residents are better able to afford more expensive homes. Connecticut’s median home value of $270,900 is among the highest nationwide. A portion of every state’s population is extremely wealthy, and the share of such high earners is especially large in Connecticut. More than one in 10 households earn $200,000 or more a year. Connecticut’s relatively high education attainment rate partially accounts for the high incomes in the area. More than 38.3% of adults have at least a bachelor’s degree compared to 30.6% nationally.
[in-text-ad]

4. New Jersey
> Median household income: $72,222
> Population: 8,958,013 (11th highest)
> 2015 Unemployment rate: 5.6% (18th highest)
> Poverty rate: 10.8% (8th lowest)
While New Jersey households report some of the highest incomes in the nation, living in the state is not cheap. Goods and services cost an average of 14.5% more in New Jersey than across the country. Housing is also very expensive in the state. The median home value of $322,600 in New Jersey is considerably higher than the national median home value of $194,500.
Few states have a higher proportion of high-income households than New Jersey, where 10.9% earn $200,000 or more a year. While certainly not a guarantee for such high wages, high college attainment among adults in New Jersey partially explains the high median income. More than 37.6% of adults have at least a bachelor’s degree, compared to 30.6% nationally.
[nativounit]

3. Alaska
> Median household income: $73,355
> Population: 738,432 (3rd lowest)
> 2015 Unemployment rate: 6.5% (4th highest)
> Poverty rate: 10.3% (5th lowest)
A typical Alaska household earns $73,355 annually, nearly $18,000 more than the typical American household. While the price of oil has fallen considerably in recent years, Alaska still relies heavily on its traditionally high-paying oil industry. Of workers in the state, 5.6% work in the agriculture, forestry, fishing, and hunting, and mining sector — which includes the oil industry — the sixth highest such share of any state. State workers who are employed in the industry likely still earn relatively high wages.
Like the nation, the percentage of people without health insurance in Alaska dropped substantially in 2015. However, 14.9% of residents still do not have health insurance, the second highest rate in the nation.

2. Hawaii
> Median household income: $73,486
> Population: 1,431,603 (11th lowest)
> 2015 Unemployment rate: 3.6% (6th lowest)
> Poverty rate: 10.6% (7th lowest)
With its picturesque island scenery, Hawaii attracts some of the world’s wealthiest individuals. The state is also home to some of the more valuable real estate. Hawaii’s median household income trails only Maryland as the highest in the country, and the median home value of $566,900 is the highest of any state and several times greater than the national median home value of $194,500. Even the richest states do not necessarily have especially healthy job markets, but Hawaii’s unemployment rate of 3.6% in 2015 was one of the lowest in the country.
[wallst_email_signup]

1. Maryland
> Median household income: $75,847
> Population: 6,006,401 (19th highest)
> 2015 Unemployment rate: 5.2% (24th highest)
> Poverty rate: 9.7% (2nd lowest)
Maryland leads the nation with a median annual household income of $75,847. The state’s poverty rate of less than 10% is also nearly the lowest of any state. The prosperity can be partially explained by high levels of education among state residents. More than 38% of adults have at least a college degree, many of whom are likely among the state’s high-income residents. The state also contains Washington D.C., home to some of the nation’s highest-paying government occupations. More than 10% of Maryland workers are employed in public administration, which represents only one portion of such government jobs.
Contact [email protected] for any questions or corrections.