
The U.S. Census Bureau released on Wednesday new data from its 2016 annual population survey — with largely positive findings. Most notable among the survey’s findings is the significant increase in U.S. median household income between 2014 and 2016 — more than in any two-year period on record.
Not only did incomes go up nationwide, but the share of uninsured Americans and the share of Americans facing serious financial hardship declined. This year’s data release marks the first time in nearly three decades that income, health insurance coverage, and poverty all improved for two consecutive years.
Despite such improvements on the national scale, income inequality in the U.S. remains high and incomes vary dramatically from state to state. 24/7 Wall St. ranked all 50 states according to the newly released median household income figures. Many of the poorest states in the country are concentrated in the South, while many of the wealthiest are coastal states in the West, mid-Atlantic, and Northeast regions. The typical household in the wealthiest state earns over $37,000 more a year than the typical household in the poorest state.
Click here to see the richest and poorest states.
Click here to see our detailed findings and methodology.

50. Mississippi
> Median household income: $41,754
> Population: 2,988,726 (19th lowest)
> 2016 Unemployment rate: 5.8% (7th highest)
> Poverty rate: 20.8% (the highest)
Despite Mississippi’s median household income climbing by $844 between 2015 and 2016 to $41,754, it remains the lowest of any state. The state’s poverty rate of 20.8% is also the highest in the country and well above the 14.0% U.S. poverty rate. Low incomes in Mississippi are reflected in property values across the state. The typical Mississippi home is worth only $113,900, the lowest of any state and well below the $205,000 median home value nationwide.
As is the case in many of the lower income states, Mississippi’s job market is hurting. Some 5.8% of the state’s labor force is out of a job, well above the 4.9% U.S. unemployment rate.
[in-text-ad]
49. West Virginia
> Median household income: $43,385
> Population: 1,831,102 (13th lowest)
> 2016 Unemployment rate: 6.0% (4th highest)
> Poverty rate: 17.9% (5th highest)
West Virginia’s median household income of $43,385 remains effectively unchanged from 2015. But because Arkansas’ household income, which was second lowest last year, increased by nearly $2,000, it surpassed that of West Virginia and moved up a spot. West Virginia, on the other hand, dropped to having second lowest median household income. Better news for the state is the fact that annual average unemployment declined from 6.8%, the highest in the country in 2015, to 6.0% in 2016 — a better rate than in three other states.
[recirclink id=405812]

48. Arkansas
> Median household income: $44,334
> Population: 2,988,248 (18th lowest)
> 2016 Unemployment rate: 4.0% (15th lowest)
> Poverty rate: 17.2% (6th highest)
With a median household income of only $44,334, Arkansas is one of only three U.S. states where more than half of all households earn less than $45,000 a year. Though it ranks as the third poorest state, incomes in Arkansas increased in 2016. The typical Arkansas household earned about $2,000 more last year than it did in 2015. The share of state residents living in poverty fell from 19.1% to 17.2% over the same period.

47. Louisiana
> Median household income: $45,146
> Population: 4,681,666 (25th highest)
> 2016 Unemployment rate: 6.1% (3rd highest)
> Poverty rate: 20.2% (2nd highest)
The typical Louisiana household earns only $45,146 a year, less than in all but three other U.S. states. Serious financial hardship is relatively common in Louisiana as about one in every five state residents live below the poverty line, the second highest poverty rate of any state — and well above the 14.0% U.S. poverty rate. Low incomes and high poverty rates are indicative of a poor job market, and that appears to be the case in Louisiana. Some 6.1% of the state’s labor force are out of a job, the third highest unemployment rate of any state.
[in-text-ad-2]

46. Alabama
> Median household income: $46,257
> Population: 4,863,300 (24th highest)
> 2016 Unemployment rate: 6.0% (4th highest)
> Poverty rate: 17.1% (7th highest)
Alabama’s poverty rate, while still quite high compared to most states, fell significantly last year. In 2015, 18.5% of the state’s population lived at or below the poverty line, the fifth highest rate in the country. The state’s poverty of rate of 17.1% in 2016, however, is currently the seventh highest among states. While Alabama’s poverty rate is no longer in the top five, incomes for the many of the lowest earners in the state have remained relatively stagnant over the past year. In 2016, 9.5% of Alabama households earned less than $10,000, effectively unchanged from 2015.

45. Kentucky
> Median household income: $46,659
> Population: 4,436,974 (25th lowest)
> 2016 Unemployment rate: 5.0% (18th highest)
> Poverty rate: 18.5% (4th highest)
Kentucky’s median annual household income of $46,659 is the sixth lowest in the country, and its poverty rate is fourth highest. Though the U.S. poverty rate fell from 14.7% in 2015 to 14.0% in 2016, Kentucky’s poverty rate remained flat at 18.5%.
Across broad populations, incomes tend to go up with educational attainment. In Kentucky, only 23.4% of adults have at least a bachelor’s degree, a smaller share than in all but four other states, and a considerably smaller share than the 31.3% of adults nationwide.
[in-text-ad]
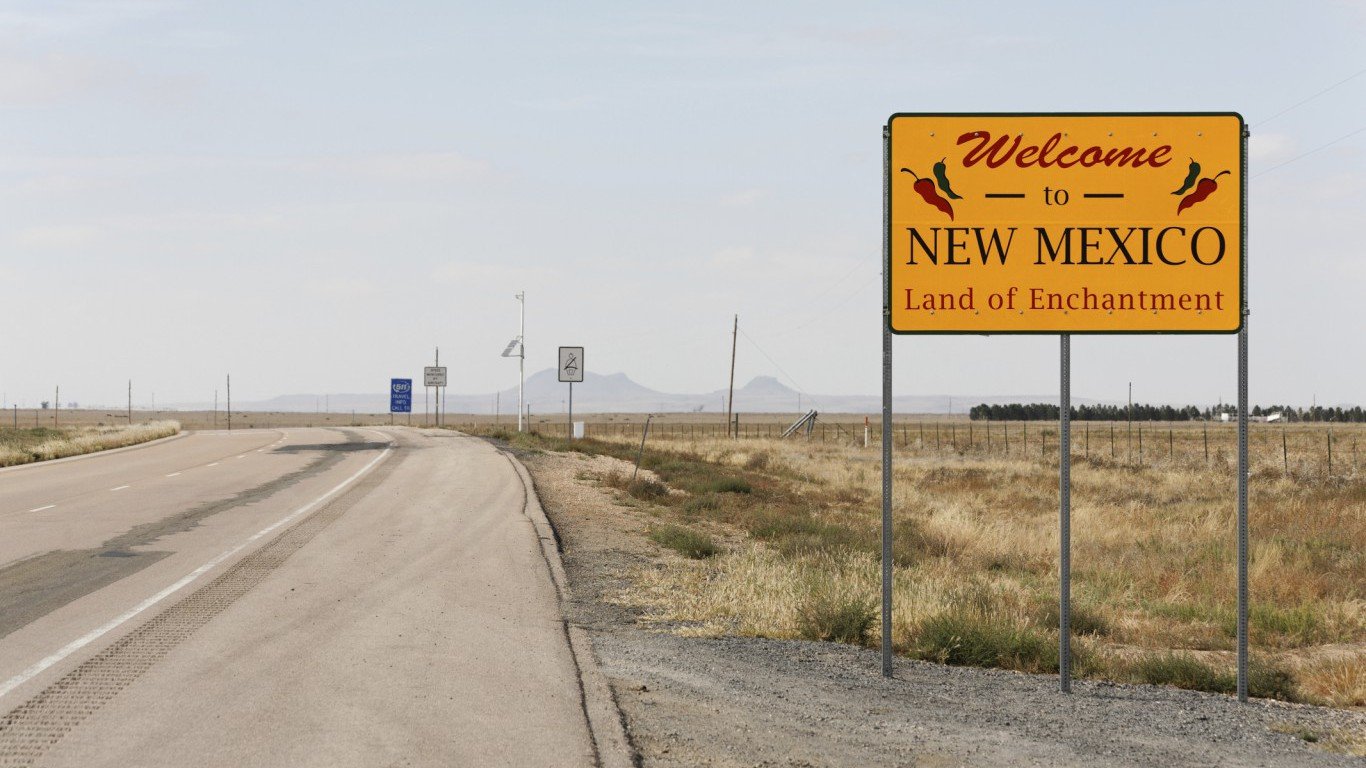
44. New Mexico
> Median household income: $46,748
> Population: 2,081,015 (15th lowest)
> 2016 Unemployment rate: 6.7% (the highest)
> Poverty rate: 19.8% (3rd highest)
New Mexico’s 6.7% jobless rate is the highest of any state and well above the 4.9% U.S. unemployment rate. The lack of available employment opportunities likely contributes to lower incomes across the state. The typical household in the state earns only $46,748 a year, nearly $11,000 below the $57,617 national median household income.
State residents are also more likely than most Americans to face serious financial hardship. Nearly 1 in every 5 New Mexico residents live in poverty, the third highest poverty rate of any state.
[recirclink id=413864]

43. Tennessee
> Median household income: $48,547
> Population: 6,651,194 (16th highest)
> 2016 Unemployment rate: 4.8% (25th highest)
> Poverty rate: 15.8% (11th highest)
Tennessee’s median household income remained effectively unchanged from 2015 to 2016. Meanwhile, the state’s poverty rate improved slightly from 16.7% to 15.8%, falling just outside the 10 states with the highest poverty rates. The share of families in the state receiving food stamps also declined, from 16% to 14.6%.
Low incomes across Tennessee are reflected in property values across the state. The typical Tennessee home is worth $157,700 — considerably less than the $205,000 median home value nationwide.

42. Oklahoma
> Median household income: $49,176
> Population: 3,923,561 (23rd lowest)
> 2016 Unemployment rate: 4.9% (20th highest)
> Poverty rate: 16.3% (9th highest)
With a median household income of $49,176, Oklahoma is one of only 10 states where a majority of households earn less than $50,000 a year. In a break from the national trend, conditions did not improve for many of Oklahoma’s poorest citizens over the past year. While the U.S. poverty rate fell from 14.7% to 14.0% between 2015 and 2016, Oklahoma’s poverty rate remained effectively unchanged at 16.3%.
In addition to a relatively high poverty rate, a far larger than typical share of Oklahoma residents lack health insurance. Some 13.8% of state residents are uninsured, a larger share than in all but two other states and well above the 8.6% U.S. uninsured rate.
[in-text-ad-2]

41. South Carolina
> Median household income: $49,501
> Population: 4,961,119 (23rd highest)
> 2016 Unemployment rate: 4.8% (25th highest)
> Poverty rate: 15.3% (14th highest)
Most of the 10 poorest states are in the South, as is South Carolina. Despite ranking among the poorest states, incomes climbed more in South Carolina last year than they did on average across the country. The typical South Carolina household earned $49,501 in 2016, up $1,711 from 2015. In comparison, the typical U.S. household earned $57,617 in 2016, up $1,340 over 2015.
In keeping with rapid income growth, South Carolina’s job market improved markedly last year. Only 4.8% of the state’s workforce are out of a job compared to the 4.9% U.S. unemployment rate. In 2015, South Carolina’s unemployment rate of 6.0% was well above the comparable 5.3% U.S. rate.

40. Montana
> Median household income: $50,027
> Population: 1,042,520 (7th lowest)
> 2016 Unemployment rate: 4.1% (17th lowest)
> Poverty rate: 13.3% (24th highest)
The typical household earns only $50,027 a year in Montana, effectively the same median household income as the year before and well below the current $57,617 national median income. Stagnant incomes are likely tied to a stagnant job market. Montana’s annual unemployment rate of 4.1% is only a slight improvement over 2015, when 4.2% of the state’s workforce was unemployed. Still, the share of unemployed workers in Montana is far less than the 4.9% national rate.
Despite lower than average incomes, a smaller than typical share of state residents face serious financial hardship. Some 13.3% of Montana residents live in poverty, compared to 14.0% of Americans nationwide.
[in-text-ad]

39. North Carolina
> Median household income: $50,584
> Population: 10,146,788 (9th highest)
> 2016 Unemployment rate: 5.1% (16th highest)
> Poverty rate: 15.4% (13th highest)
In most U.S. states, the annual median household income is higher than in North Carolina, where the typical household earns $50,584 a year. Still, economic conditions are improving rapidly in the Tar Heel State. The state’s poverty rate stands at 15.4%, down a full percentage point from 2015. Over the same period, unemployment fell in North Carolina from 5.8% to 5.1%.
[recirclink id=405297]

38. Florida
> Median household income: $50,860
> Population: 20,612,439 (3rd highest)
> 2016 Unemployment rate: 4.9% (20th highest)
> Poverty rate: 14.7% (16th highest)
The typical Florida household earns $50,860 annually, considerably less than the typical U.S. household income of $57,617. Relatively low incomes in Florida are reflected in property values across the state. The typical Florida home is worth $197,700, less than the $205,000 national median home value.
In keeping with the national trend, economic conditions improved in the Sunshine State in 2016. Florida’s poverty rate fell a full percentage point over the last year, from 15.7% in 2015 to 14.7% in 2016. Similarly, Florida’s annual unemployment rate fell from 5.4% to 4.9%.

37. Missouri
> Median household income: $51,746
> Population: 6,093,000 (18th highest)
> 2016 Unemployment rate: 4.5% (22nd lowest)
> Poverty rate: 14.0% (22nd highest)
Missouri’s median household income of $51,746 a year is well below the median income nationwide of $57,617. Despite the lower incomes, the share of Missouri residents facing serious financial hardship is in line with the corresponding share nationwide. The poverty rate across both Missouri and the U.S. as a whole is 14.0%.
Lower incomes in Missouri do not necessarily reflect poor economic conditions. Only 4.5% of the state’s labor force were out of a job, a slightly smaller share than the 4.9% unemployment rate nationwide in 2016.
[in-text-ad-2]

36. Idaho
> Median household income: $51,807
> Population: 1,683,140 (12th lowest)
> 2016 Unemployment rate: 3.8% (11th lowest)
> Poverty rate: 14.4% (19th highest)
Though Idaho’s 2016 median household income remains lower than in most states, it improved more than in nearly any other state. The typical household in the state earned $51,807 in 2016, over $3,000 more than the year before — more than double the $1,340 increase in median household income nationwide over the same period.
Strong job growth and lower than typical unemployment in the state may partially explain the improvement. The state’s unemployment fell from 4.2% in 2015 to 3.8% in 2016. In comparison, the U.S. unemployment rate fell from 5.3% to 4.9% over the same period.

35. Indiana
> Median household income: $52,314
> Population: 6,633,053 (17th highest)
> 2016 Unemployment rate: 4.4% (21st lowest)
> Poverty rate: 14.1% (21st highest)
The typical Indiana household earns $52,314 a year, about $5,300 less than the typical American household. Across broad populations, incomes tend to increase with educational attainment. In Indiana, only 25.6% of adults have a bachelor’s degree or higher, a considerably smaller share than the 31.3% of adults nationwide with a bachelor’s degree.
Lower incomes in Indiana are reflected in the state’s property values. The typical home in the state is worth $134,800, well below the $205,000 median home value nationwide.
[in-text-ad]

34. Ohio
> Median household income: $52,334
> Population: 11,614,373 (7th highest)
> 2016 Unemployment rate: 4.9% (20th highest)
> Poverty rate: 14.6% (18th highest)
The median household income in Ohio climbed slightly from $51,610 in 2015 to $52,334 in 2016. The increase was not enough to meaningfully reduce the share of state residents facing serious financial hardship, however. The state’s 2016 poverty rate of 14.6% remained effectively unchanged from the previous year. Meanwhile, the U.S. poverty rate fell from 14.7% to 14.0% over the same period.
The state’s stagnant poverty rate may partially be the result of a stagnant job market. Ohio’s 4.9% annual unemployment rate has remained unchanged since 2015. Meanwhile, the national unemployment rate fell from 5.3% to 4.9% over the same period.
[recirclink id=413864]

33. Michigan
> Median household income: $52,492
> Population: 9,928,300 (10th highest)
> 2016 Unemployment rate: 4.9% (20th highest)
> Poverty rate: 15.0% (15th highest)
While Michigan continues to compare unfavorably to most states in economic measures such as poverty and income, some economic conditions are improving modestly in the state. The state’s median household income climbed by nearly $1,000 in 2016 to $52,492. Additionally, the share of state residents living below the poverty line fell from 15.8% in 2015 to 15.0% in 2016.

32. Maine
> Median household income: $53,079
> Population: 1,331,479 (9th lowest)
> 2016 Unemployment rate: 3.9% (13th lowest)
> Poverty rate: 12.5% (21st lowest)
Maine’s median household income of $53,079 a year is about $4,500 below the national median of $57,617. For a state in which incomes tend to be so low, Maine is unusual by at least one key measure — relatively high educational attainment. While higher educational attainment tends to correlate with higher incomes, in Maine 92.3% of adults have a high school diploma, the seventh largest share in the country and well above the national share of 87.5%. College attainment tends to be a better indicator of wealth, however, and Maine’s 30.1% share of adults with a bachelor’s degree falls slightly below the national share of 31.3%.
[in-text-ad-2]

31. Arizona
> Median household income: $53,558
> Population: 6,931,071 (14th highest)
> 2016 Unemployment rate: 5.3% (13th highest)
> Poverty rate: 16.4% (8th highest)
The concentration of poverty in a state often mirrors the state’s median household income ranking, but this is not always the case. Arizona has the 20th highest median household income of any state but the eighth highest poverty rate. The state’s relatively high unemployment rate could be contributing to the state’s high poverty rate. At 5.3%, Arizona’s jobless rate is 13th highest of all states and slightly higher than the U.S. 4.9% jobless rate.

30. Georgia
> Median household income: $53,559
> Population: 10,310,371 (8th highest)
> 2016 Unemployment rate: 5.4% (9th highest)
> Poverty rate: 16.0% (10th highest)
Georgia ranks 30th overall in median household income among states, with the typical household earning $53,559 a year. The state’s poverty rate, however, ranks among the 10 worst, as 16% of Georgia residents live in poverty compared to 14% of Americans nationwide.
Georgia’s population is one of the most exposed to crisis in the event of an accident, injury, or disease, as 12.9% of the state’s population lack health insurance coverage, the fourth highest proportion among states.
[in-text-ad]
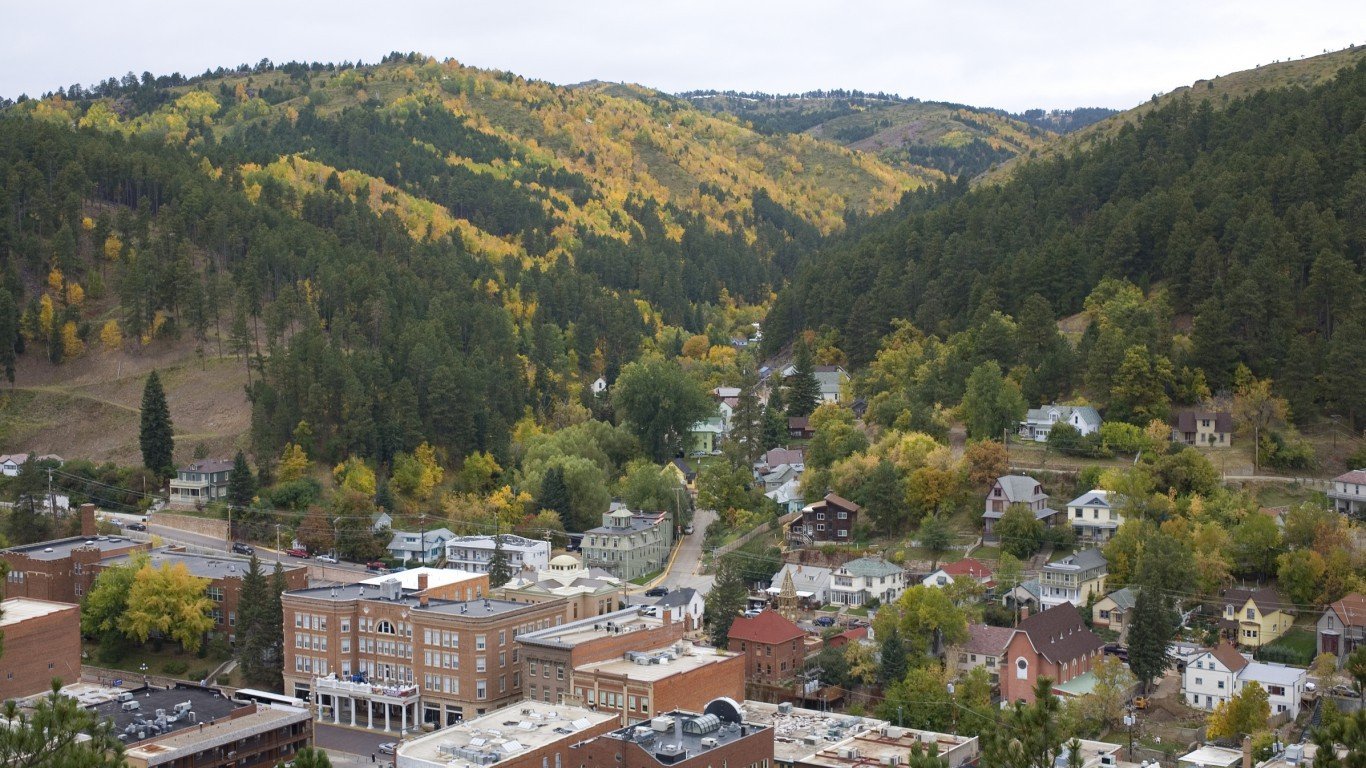
29. South Dakota
> Median household income: $54,467
> Population: 865,454 (5th lowest)
> 2016 Unemployment rate: 2.8% (2nd lowest)
> Poverty rate: 13.3% (24th highest)
High unemployment can often, at least partially, explain poverty and low incomes in a state, but not in South Dakota. The state’s median household income is about $3,000 below the national median at $54,467 a year despite very low unemployment. Just 2.8% of South Dakota’s labor force was unemployed in 2016, the second lowest jobless rate of all states. Also, despite the relatively low income, the share of adults receiving assistance in the form of food stamps in South Dakota is one of the smallest. Just 9.4% of households receive SNAP benefits, the 11th lowest share among states.
[recirclink id=404837]

28. Kansas
> Median household income: $54,935
> Population: 2,907,289 (16th lowest)
> 2016 Unemployment rate: 4.2% (18th lowest)
> Poverty rate: 12.1% (20th lowest)
In 2016, Kansas had one of the lowest food stamp recipiency rates in the country. Just 7.9% of area households received SNAP benefits compared to 12.4% of all American households that did. In measures of poverty and income, the state compares much more closely with the nation’s average. The typical household in Kansas earned $54,935 a year, compared to the national median of $57,617. Still, the state’s poverty rate of 12.1% was slightly lower than the national rate of 14.0%.

27. Nevada
> Median household income: $55,180
> Population: 2,940,058 (17th lowest)
> 2016 Unemployment rate: 5.7% (8th highest)
> Poverty rate: 13.8% (23rd highest)
Nevada had the highest unemployment rate in 2015, at 6.8%. While the state’s unemployment rate improved in 2016 to 5.7%, it was still one of the highest of all states. Employers are the primary providers of health insurance for Americans, so Nevada’s high jobless rate may help explain the state’s high uninsured rate — one of the highest nationwide. In Nevada, 11.4% of adults do not have health insurance compared to 8.6% of adults nationwide.
[in-text-ad-2]

26. Iowa
> Median household income: $56,247
> Population: 3,134,693 (21st lowest)
> 2016 Unemployment rate: 3.7% (10th lowest)
> Poverty rate: 11.8% (18th lowest)
The typical household in Iowa earns $56,247 a year, just under the national median household income of $57,617. Generally, the relative value of property in a state mirrors area incomes, but there are exceptions. While Iowa’s median household income is effectively in line with that of the country, the typical home in the state is only worth $142,300, the ninth lowest of all states and well below the national median home value of $205,000.

25. Texas
> Median household income: $56,565
> Population: 27,862,596 (2nd highest)
> 2016 Unemployment rate: 4.6% (23rd lowest)
> Poverty rate: 15.6% (12th highest)
While college attainment tends to be a better indicator of income than high school attainment, states where a relatively high share of adults have a high school education also tend to have higher incomes. Texas has the second lowest high school attainment rate among adults, at just 82.9%, compared to the national share of 87.5% of adults. Still, rather than being extremely low, incomes in Texas are in line with the national figure. The typical Texas household earns $56,565 a year, roughly $1,000 below the national figure.
[in-text-ad]

24. Wisconsin
> Median household income: $56,811
> Population: 5,778,709 (20th highest)
> 2016 Unemployment rate: 4.1% (17th lowest)
> Poverty rate: 11.8% (18th lowest)
Wisconsin’s median household income of $56,811 is effectively the same as it was in 2015. Similarly, the state’s 11.8% poverty rate and 11.9% SNAP recipiency rate remain effectively unchanged from the previous year. The only economic measure that changed significantly in 2016 is the 4.1% share of households in the state earning $200,000 or more — up from 3.7% in 2015.
[recirclink id=413864]

23. Pennsylvania
> Median household income: $56,907
> Population: 12,784,227 (6th highest)
> 2016 Unemployment rate: 5.4% (9th highest)
> Poverty rate: 12.9% (23rd lowest)
Pennsylvania’s median household income increased very slightly between 2015 and 2016, rising by $700 to $56,907. The state’s relatively high unemployment rate of 5.4% would suggest lower incomes, but the typical state household earns only $700 less than the national median household income.
Serious financial hardship is also less common in Pennsylvania than it is nationwide. Some 12.9% of state residents live below the poverty line compared to 14.0% of Americans nationwide.

22. Nebraska
> Median household income: $56,927
> Population: 1,907,116 (14th lowest)
> 2016 Unemployment rate: 3.2% (5th lowest)
> Poverty rate: 11.4% (15th lowest)
Nebraska’s typical household earns $56,907 a year, just under the national median household income and 22nd highest of all states. While real estate values usually reflect the earning potential of state residents, Nebraska’s does not. The typical home in the state is worth $148,100, the 12th lowest median home value of all state and over $50,000 lower than the national median home value.
Nebraska’s poverty rate improved slightly to 11.4% from 12.6% in 2015.
[in-text-ad-2]

21. Oregon
> Median household income: $57,532
> Population: 4,093,465 (24th lowest)
> 2016 Unemployment rate: 4.9% (20th highest)
> Poverty rate: 13.3% (24th highest)
While Oregon’s median household income is less than $300 below the national figure, this does not give a complete economic picture. Nearly 17% of households in the state rely on food stamps, which is well above the national SNAP recipiency rate of 12.4% and the third highest share among states. While this is a high figure, it is nevertheless a substantial improvement from 2015, when the state had the highest household SNAP recipiency rate, at 18.6% of households.

20. Vermont
> Median household income: $57,677
> Population: 624,594 (2nd lowest)
> 2016 Unemployment rate: 3.3% (7th lowest)
> Poverty rate: 11.9% (19th lowest)
Vermont’s median household income of $57,677 in 2016 remains effectively unchanged from the year before. On a broader scale, Vermont’s median household income is $2,300 higher today than it was in 2012. Still, the poverty rate is in line with the share of state residents living below the poverty line in 2012. In a break from the national trend, serious financial hardship became more common in Vermont in 2016. Some 11.9% of state residents live in poverty, up from 10.2% the year before.
[in-text-ad]

19. Wyoming
> Median household income: $59,882
> Population: 585,501 (the lowest)
> 2016 Unemployment rate: 5.3% (13th highest)
> Poverty rate: 11.3% (14th lowest)
The typical household in Wyoming earns $59,882, effectively unchanged from the previous year. Similarly, some 11.3% of state residents live in poverty, about the same poverty rate as in 2015. Economic conditions remained static in the state in 2016 despite a worsening job market. An average of 5.3% Wyoming’s labor force were out of a job in 2016, up considerably from the state’s 4.2% unemployment rate in 2015.
Serious financial hardship is less common in Wyoming than in most states, and partially as a result, only 5.9% of households rely on government SNAP benefits, the smallest share of any state.
[recirclink id=405409]

18. Rhode Island
> Median household income: $60,596
> Population: 1,056,426 (8th lowest)
> 2016 Unemployment rate: 5.3% (13th highest)
> Poverty rate: 12.8% (22nd lowest)
Rhode Island is one of five New England states with a higher median income than the nation as a whole. The typical Rhode Island household earns $60,596 annually, slightly more than the median income nationwide of $57,617. Despite wealthier residents, a larger than typical share of Rhode Islanders rely on government assistance. Some 15.9% of households in the state receive SNAP benefits, the fifth highest share among all states.

17. North Dakota
> Median household income: $60,656
> Population: 757,953 (4th lowest)
> 2016 Unemployment rate: 3.2% (5th lowest)
> Poverty rate: 10.7% (10th lowest)
The typical North Dakota household earned over $60,000 in 2016, roughly the same as in 2015. Incomes in the state remained static even as other economic conditions worsened. In a break from the national trend of declining unemployment, North Dakota’s unemployment rate climbed from 2.8% in 2015 to 3.2% in 2016.
A slump in global oil prices may partially explain North Dakota’s lagging economy, as 8.4% of the state’s workforce are employed in resource extraction, roughly five times the comparable share of the U.S. workforce.
[in-text-ad-2]

16. Illinois
> Median household income: $60,960
> Population: 12,801,539 (5th highest)
> 2016 Unemployment rate: 5.9% (6th highest)
> Poverty rate: 13.0% (24th lowest)
In keeping with the broader nationwide trend, incomes climbed in Illinois in 2016, while poverty fell. The typical household in the state earns $60,960 annually — more than in most states and up from $60,094 in 2015. Similarly, only 13.0% of state residents live in poverty — roughly a half a percentage point improvement from the previous year and slightly below the 14.0% U.S. poverty rate.

15. Delaware
> Median household income: $61,757
> Population: 952,065 (6th lowest)
> 2016 Unemployment rate: 4.4% (21st lowest)
> Poverty rate: 11.7% (16th lowest)
Higher educational attainment rates are often tied to higher incomes in a population. In Delaware, 31.0% of adults have a bachelor’s degree or higher, in line with the 31.3% U.S. bachelor’s degree attainment rate. Despite similar educational attainment rates, the typical household in Delaware earns $61,757 annually, well above the nationwide median household income of $57,617.
In keeping with higher incomes, property is worth more in Delaware than in much of the United States. The typical home in the state is worth $243,400 — about $38,400 more than the median home value nationwide.
[in-text-ad]

14. New York
> Median household income: $62,909
> Population: 19,745,289 (4th highest)
> 2016 Unemployment rate: 4.8% (25th highest)
> Poverty rate: 14.7% (16th highest)
The typical New York state household earns $62,909 a year, considerably more than the national median household income of $57,617. While most New York households outearn the typical American household, 15.0% receive food stamps, the seventh largest share of all states and well above the comparable U.S. share. One explanation may be the large number of New York City residents receiving SNAP benefits, which rose slightly in the past year, largely because of increasingly generous qualification standards. While New York City makes up more than 40% of the state’s population, the city accounts for nearly 60% of New York state’s food stamp recipients.
[recirclink id=413864]

13. Minnesota
> Median household income: $65,599
> Population: 5,519,952 (22nd highest)
> 2016 Unemployment rate: 3.9% (13th lowest)
> Poverty rate: 9.9% (6th lowest)
Breaking from the broader national pattern, Minnesota’s job market worsened in 2016. The state’s unemployment rate climbed slightly from 3.7% in 2015 to 3.9% in 2016. Nationwide, the unemployment rate fell from 5.3% to 4.9% over same period. Despite the jobs slump, median household income went up in Minnesota from $64,188 in 2015 to $65,599 in 2016. Additionally, with a 9.9% poverty rate, relatively few state residents face serious financial hardship. Twelve states have a higher median household income than Minnesota, and only five have a lower poverty rate.

12. Colorado
> Median household income: $65,685
> Population: 5,540,545 (21st highest)
> 2016 Unemployment rate: 3.3% (7th lowest)
> Poverty rate: 11.0% (12th lowest)
The typical Colorado household earns $65,685 a year, far more than the typical American household income of $57,617. A higher educational attainment rate often leads to higher paying job opportunities, and 39.9% of adults in Colorado have a bachelor’s degree or higher — the highest such share after only Massachusetts and well above the 31.3% share of adults nationwide.
With higher incomes, state residents can afford more expensive homes. The typical home in Colorado is worth $314,200, about $109,200 more than the median home value nationwide.
[in-text-ad-2]

11. Utah
> Median household income: $65,977
> Population: 3,051,217 (20th lowest)
> 2016 Unemployment rate: 3.4% (8th lowest)
> Poverty rate: 10.2% (7th lowest)
Utah residents are among the least likely to be struggling financially nationwide. Only 4.2% of households in the state earn less than $10,000 a year, the third smallest share after only New Hampshire and Alaska. Similarly, Utah’s 10.2% poverty rate is well below the U.S.’s 14.0% poverty rate. Utah’s median household income of $65,977 a year is higher than in all but 10 other states and well above the median household income nationwide of $57,617.

10. Washington
> Median household income: $67,106
> Population: 7,288,000 (13th highest)
> 2016 Unemployment rate: 5.4% (9th highest)
> Poverty rate: 11.3% (14th lowest)
The median household income in Washington state climbed significantly — from $64,764 in 2015 to $67,106 in 2016. Not only did earnings go up, but homeowners in the state also likely increased their net worth in 2016. Washington’s median home value climbed $22,400 from $284,000 in 2015 to $306,400 in 2016. In comparison, the typical home value nationwide climbed only $10,500 over the same period.
[in-text-ad]
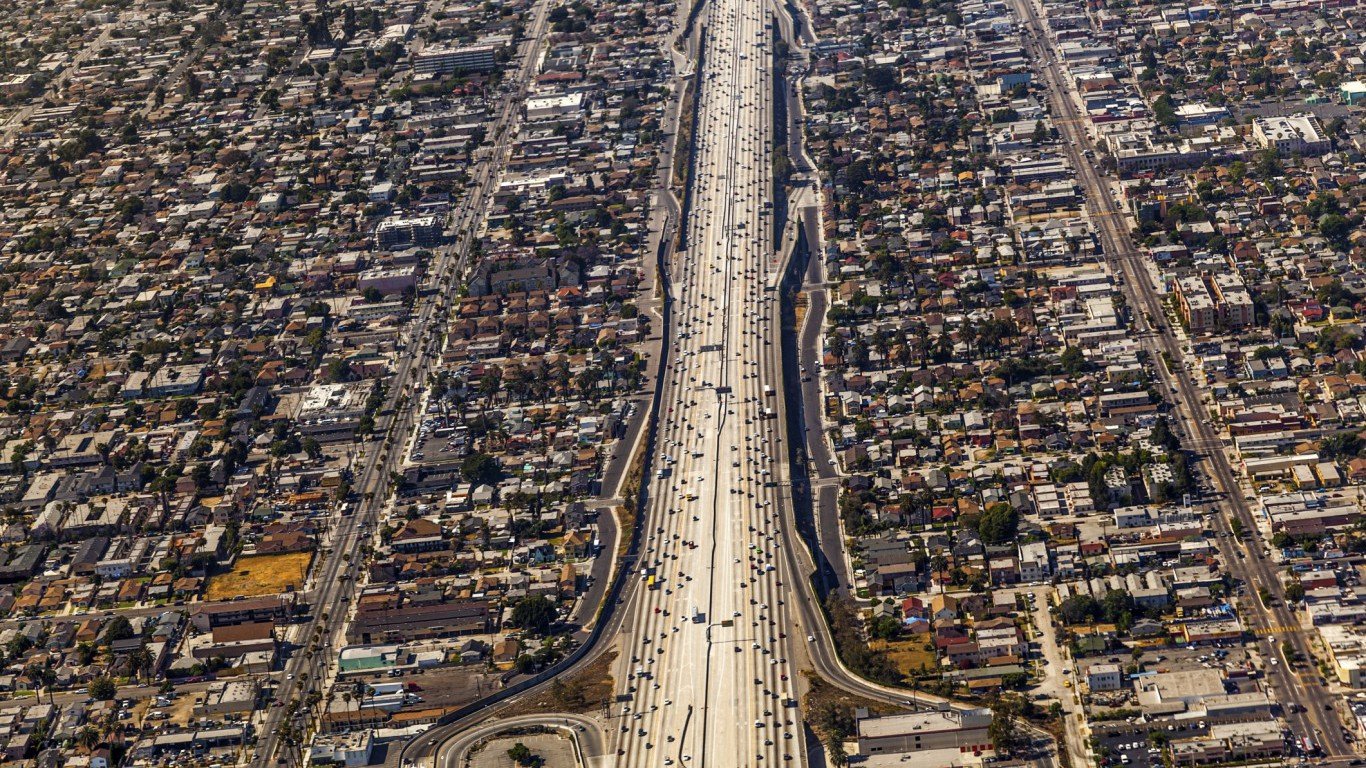
9. California
> Median household income: $67,739
> Population: 39,250,017 (the highest)
> 2016 Unemployment rate: 5.4% (9th highest)
> Poverty rate: 14.3% (20th highest)
California is one of the wealthiest states in the nation. Some 10.1% of households in the state earn over $200,000 a year, well above the 6.4% share of households nationwide. The median income across the state is $67,739 per year, about $10,000 more than the U.S. median. The state’s higher incomes are reflected in higher home values. The typical home in California is worth $477,500, more than in any state other than Hawaii.
The relatively large shares of high earners does not mean the state is without low income households, however. Some 14.3% of Californians live in poverty, roughly in line with the 14.0% U.S. poverty rate.
[recirclink id=405048]

8. Virginia
> Median household income: $68,114
> Population: 8,411,808 (12th highest)
> 2016 Unemployment rate: 4.0% (15th lowest)
> Poverty rate: 11.0% (12th lowest)
Virginia has a healthy job market with a relatively large share of high-paying jobs. Just 4.0% of the Virginia workforce is unemployed, a substantial improvement from the state’s 4.5% unemployment rate one year ago and less than 4.9% annual U.S. unemployment rate. An estimated 15.4% of workers in the state are employed in the generally high paying professional, scientific, management, and administrative services, the second largest share in the country. The typical household in Virginia earns $68,114 a year, far more than the U.S. median household income of $57,617.

7. New Hampshire
> Median household income: $70,936
> Population: 1,334,795 (10th lowest)
> 2016 Unemployment rate: 2.8% (2nd lowest)
> Poverty rate: 7.3% (the lowest)
The typical New Hampshire household earns $70,936 a year, far more than the national median of $57,617. Relatively few residents in the state endure extreme financial hardship. Just 4.0% of households earn less than $10,000 annually, and just 7.3% of New Hampshire residents live in poverty, the second smallest and smallest shares in the country, respectively. New Hampshire’s high incomes may partially be the result of high educational attainment in the state. Some 92.8% of state adults have graduated from high school, and 36.6% of adults have a bachelor’s degree — the fourth and seventh largest shares of any state, respectively.
[in-text-ad-2]

6. Connecticut
> Median household income: $73,433
> Population: 3,576,452 (22nd lowest)
> 2016 Unemployment rate: 5.1% (16th highest)
> Poverty rate: 9.8% (4th lowest)
In Connecticut, high educational attainment and a large number of advanced, high-paying jobs have likely contributed to a high concentration of wealth. Some 38.6% of adults in Connecticut have a bachelor’s degree, the fourth highest share of any state. An estimated 8.8% of the state’s workforce is employed in generally high paying finance and insurance jobs, and 2.3% are in information, the second and fifth largest shares in the country. The typical Connecticut household earns $73,433 annually, far more than the $57,617 national median income.

5. Hawaii
> Median household income: $74,511
> Population: 1,428,557 (11th lowest)
> 2016 Unemployment rate: 3.0% (3rd lowest)
> Poverty rate: 9.3% (2nd lowest)
The typical household in Hawaii earned $74,511 in 2016, roughly the same as in 2015 yet far more than the national median income of $57,617. While incomes in Hawaii remained stagnant over the past year, property values rose. The typical home is currently worth $592,000, the most of any state and far more than the value one year ago of $566,900.
Hawaii has one of the largest tourism industries of any state. An estimated 16.6% of the state’s workforce is employed in arts, entertainment, recreation, accommodation, and food services, far more than the 9.8% national figure.
[in-text-ad]
![]()
4. Massachusetts
> Median household income: $75,297
> Population: 6,811,779 (15th highest)
> 2016 Unemployment rate: 3.7% (10th lowest)
> Poverty rate: 10.4% (9th lowest)
The typical Massachusetts household earned $75,297 in 2016, a substantial increase from the state’s one year ago’s income of $71,146 and far more than the national median of $57,617. One reason for the rising incomes in Massachusetts may be the state’s improving job market. While 4.9% of the state’s labor force was unemployed in 2015, the jobless rate fell to 3.7% in 2016 — one of the largest improvements of any state. The share of Massachusetts adults with a bachelor’s degree also rose from 41.5% to 42.7%, still the largest share of any state.
[recirclink id=413864]

3. New Jersey
> Median household income: $76,126
> Population: 8,944,469 (11th highest)
> 2016 Unemployment rate: 5.0% (18th highest)
> Poverty rate: 10.4% (9th lowest)
In New Jersey, 38.6% of adults have a bachelor’s degree, a substantial increase from the 37.6% one year ago. Incomes rose in tandem with educational attainment rate. The typical New Jersey household earned $76,126 in 2016, nearly $3,000 more than in 2015. The share of households earning more than $200,000 rose from 11.1% to 12.0% over the same period, remaining the largest of any state. Meanwhile, the share of households earnings less than $10,000 fell from 5.6% to 5.3%.

2. Alaska
> Median household income: $76,440
> Population: 741,894 (3rd lowest)
> 2016 Unemployment rate: 6.6% (2nd highest)
> Poverty rate: 9.9% (6th lowest)
An estimated 6.6% of the Alaskan labor force is unemployed, far more than the 4.9% national unemployment rate and the second largest share of any state. Some 29.6% of adults in the state have a bachelor’s degree, less than the 31.3% national share. Despite pervasive joblessness and low educational attainment, Alaskans are relatively wealthy. The typical household earns $76,440 a year, far more than the national median of $57,617. One factor contributing to the state’s high incomes may be the large share of workers employed in the state’s lucrative oil industry. The transportation, warehousing, and utilities sector employs 8.0% of the Alaska workforce, the largest share of any state.
[in-text-ad-2]

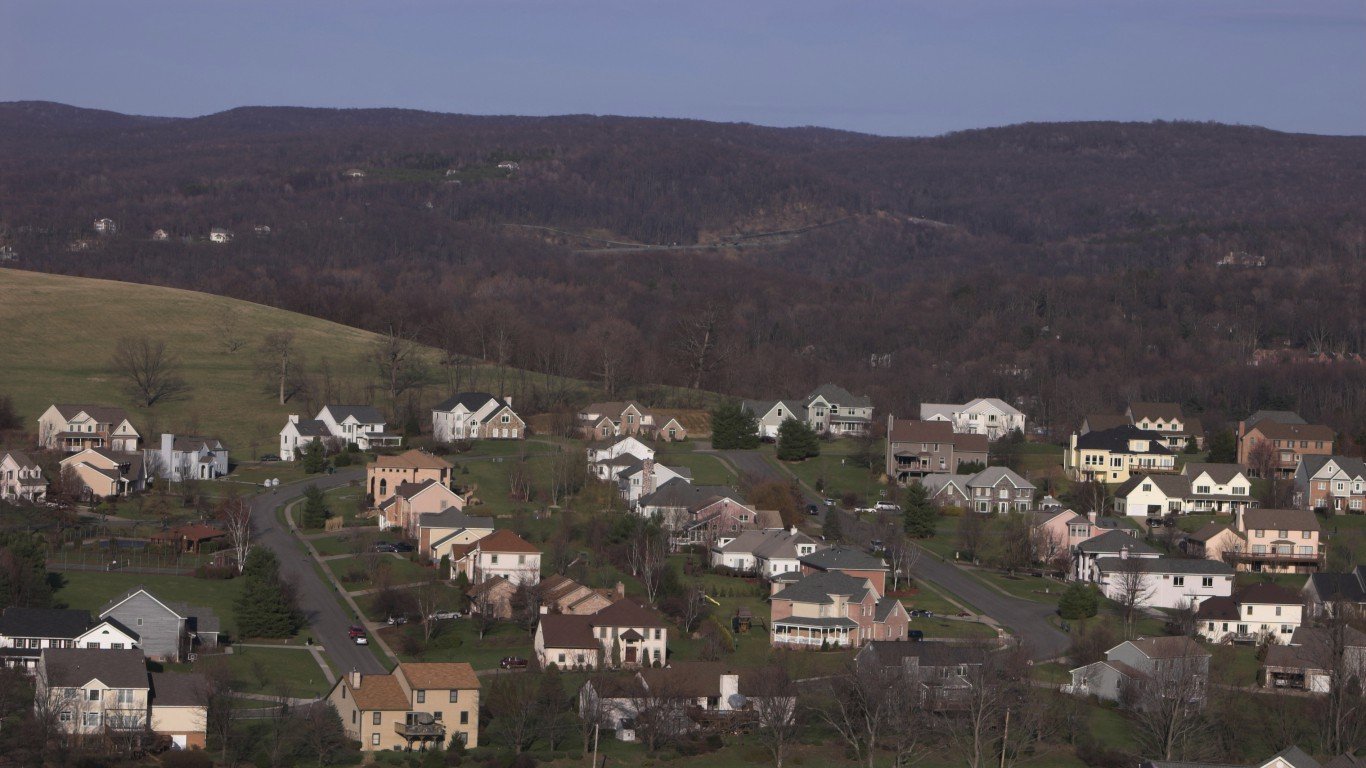
1. Maryland
> Median household income: $78,945
> Population: 6,016,447 (19th highest)
> 2016 Unemployment rate: 4.3% (19th lowest)
> Poverty rate: 9.7% (3rd lowest)
The typical Maryland household earns $78,945 a year, the most of any state and far more than the national median income of $57,617. Many of the wealthiest parts of Maryland are suburbs surrounding Washington, D.C. such as Chevy Chase, Somerset, and Travilah, where the state’s highest earners can commute to advanced, high-paying jobs in the D.C. metro area. An estimated 15.6% of the Maryland workforce is employed in the generally high paying professional, scientific, and management services, that largest share of any state.
Maryland is also one of the most educated states in the country. Some 39.3% of Maryland adults have a bachelor’s degree, the third largest share of any state.
Detailed Findings and Methodology
The improvements in economic measures coincided with improvements in the labor market. The U.S. unemployment rate fell from 5.3% in 2015 to 4.9% in 2016. Median household income in the U.S. climbed from $56,277 to $57,617 over the same period. Some 30 states reported a statistically meaningful improvement in median household income in 2016, while median income in the remaining states remained effectively unchanged.
While economic conditions generally improved nationwide in 2016, some perennial patterns still hold true. For example, states with higher educational attainment rates tend to report higher incomes. Of the 10 wealthiest states, nine are home to a larger share of adults with at least a bachelor’s degree than the 31.3% national share. Conversely, each of the 10 poorest states in the country is home to a smaller than typical share of adults with at least a bachelor’s degree.
Property values across states also tend to closely mirror income. Each of the 10 states with the highest median household incomes also has a higher median home value than the national median value of $205,000. Meanwhile, the 10 states with the lowest incomes have median home values below the U.S. median.
To identify the richest and poorest states with the highest and lowest median household income, 24/7 Wall St. reviewed state data on income from the U.S. Census Bureau’s 2016 American Community Survey (ACS). Median household income for all years is adjusted for inflation. Data on health insurance coverage, employment by industry, food stamp recipiency, poverty, and income inequality also came from the 2016 ACS. We also reviewed annual average unemployment data from the Bureau of Labor Statistics (BLS) for 2015 and 2016.
Contact [email protected] for any questions or corrections.