[cnxvideo id=”510430″ placement=”ros”]Is your state a drag on the American economy or a boon? The 50 states — as diverse as they are — each contribute something to the U.S. economy. Because of their diversity, state economies rarely trend in unison. GDP growth is often the default measure for economic strength, but it often fails to tell the whole story. Unemployment, poverty, job growth, and education among other factors can also play a part in defining the strength of an economy.
Economic vitality is as much about growth as it is about the state’s ability to support its population — with jobs, education, economic opportunities and more. In turn, employed, better-paid, and better-educated residents of a state further contribute to economic growth.
24/7 Wall St. reviewed economic growth, poverty, unemployment, job growth, and college attainment rates nationwide to compare and rank each state’s economy. As a result, the best ranked states tend to have fast-growing economies, low poverty and unemployment, high job growth, and a relatively well-educated workforce, while the opposite is generally the case among states with the worst ranked economies.
Click here to see the states with the best (and worst) economies.
Click here to see the detailed findings and methodology.

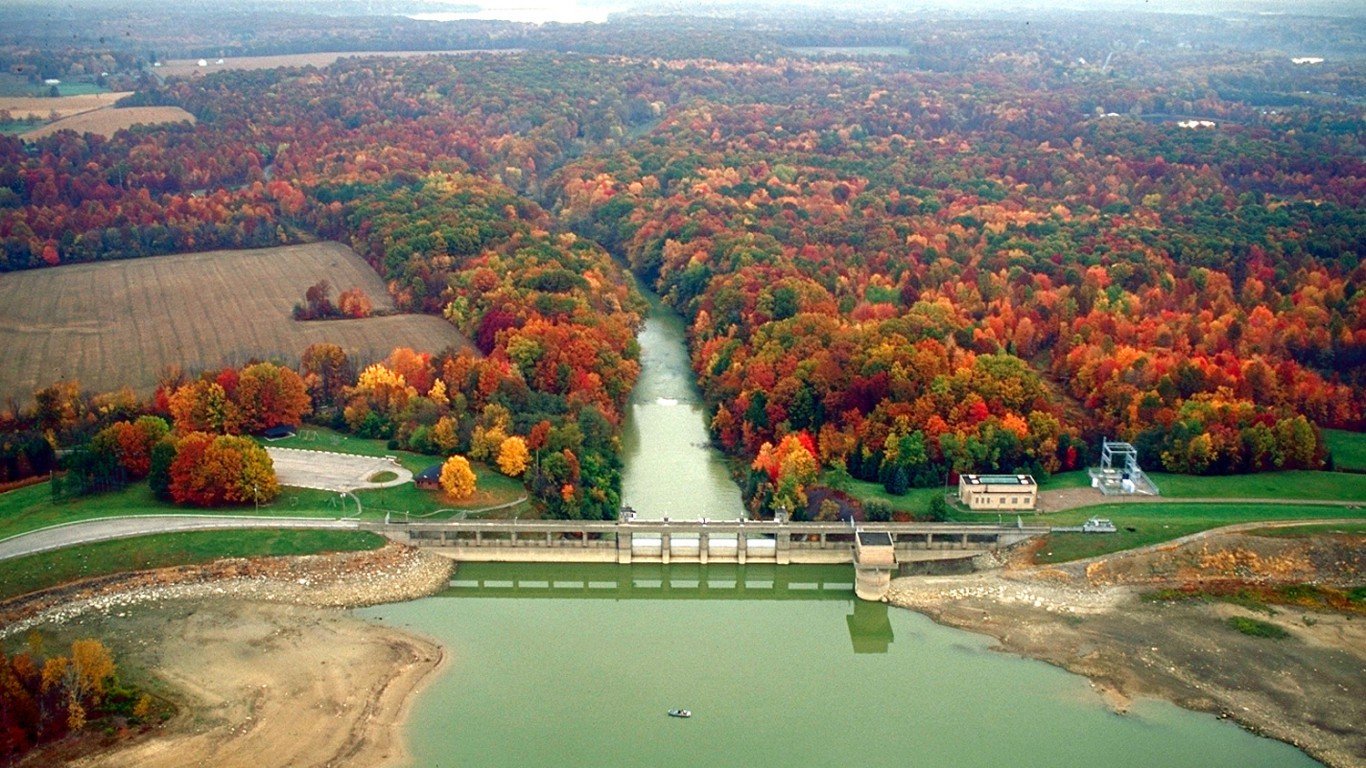
50. West Virginia
> 2016 GDP: $66.50 billion (11th smallest)
> 5 yr. GDP annual growth rate: -0.1% (4th largest decline)
> Unemployment: 4.5% (17th highest)
> 5 yr. annual employment growth: -0.5% (the largest decline)
West Virginia’s unemployment rate of 4.5% in May was only slightly higher than the national jobless rate of 4.3% and exceptionally low compared to a number of other states on the low end of this list. However, the state has the worst job growth rate in the nation, with the number of jobs actually shrinking by 0.5% on average each year over the five years through 2016. Fewer than 20% of adults in West Virginia have a bachelor’s degree, the lowest percentage of all states. College-level education in a population is widely considered a key element of economic health.
[in-text-ad]
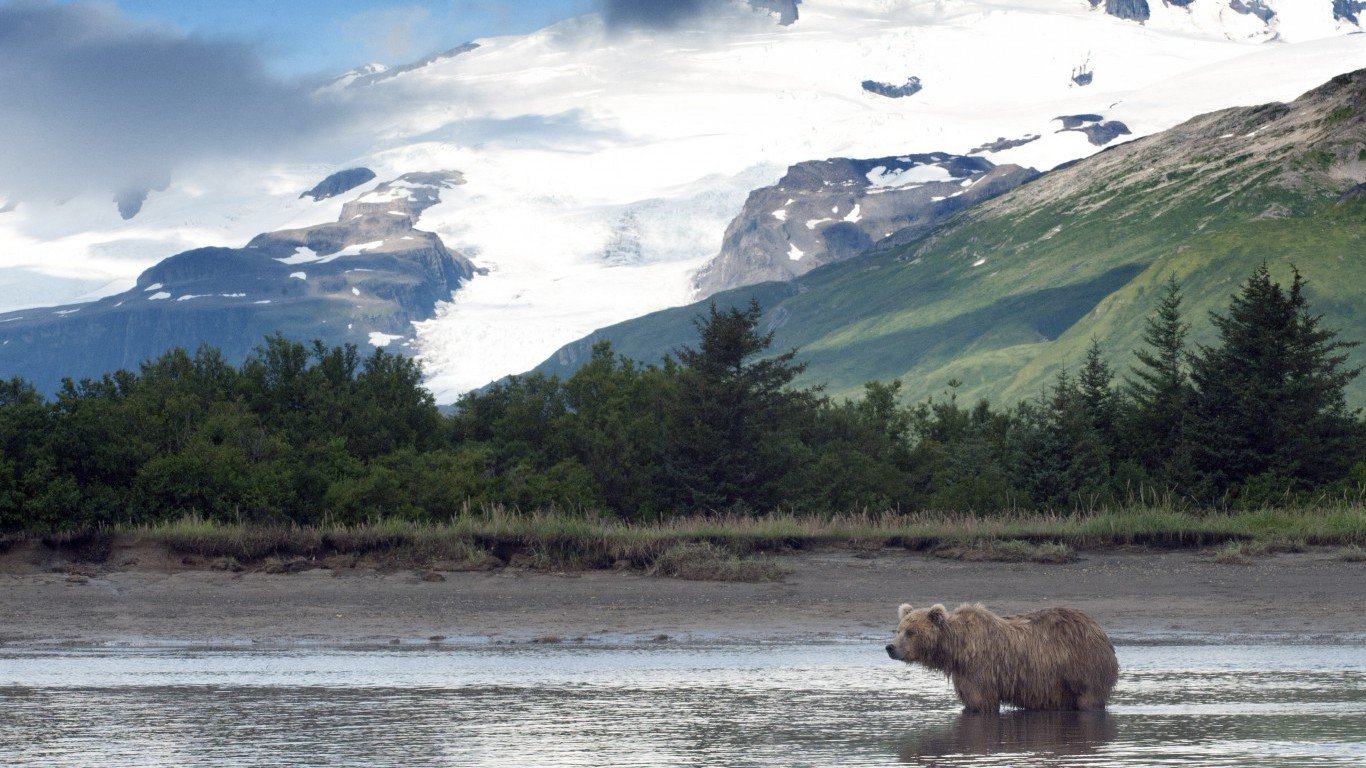
49. Alaska
> 2016 GDP: $47.46 billion (5th smallest)
> 5 yr. GDP annual growth rate: -1.4% (the largest decline)
> Unemployment: 6.7% (the highest)
> 5 yr. annual employment growth: 0.2% (the slowest growth)
GDP growth is a traditional measure of economic strength — and by that measure, Alaska has the worst economy of any state. Alaska’s GDP contracted by an annual rate of 1.4% between 2011 and 2016, even as the U.S. economy as a whole grew by 2.0%. Alaska’s GDP contraction may partially explain the large share of the state’s workforce out of a job. The state’s 6.7% unemployment rate is the highest of any state and well above the 4.3% U.S. unemployment rate.
[recirclink id=398404]

48. Mississippi
> 2016 GDP: $95.28 billion (15th smallest)
> 5 yr. GDP annual growth rate: 0.5% (3rd smallest growth)
> Unemployment: 4.9% (7th highest)
> 5 yr. annual employment growth: 0.9% (8th slowest growth)
While measures such as GDP and employment growth rates are useful in gauging the strength of a given economy, the prevalence of serious financial hardship is perhaps a more tangible measure. Across Mississippi, 22% of residents live in poverty, the largest share of any state and well above the 14.7% U.S. poverty rate.
Higher educational attainment often correlates with higher incomes, and in Mississippi, only 20.8% of adults have at least a bachelor’s degree, well below the corresponding 30.6% national share.
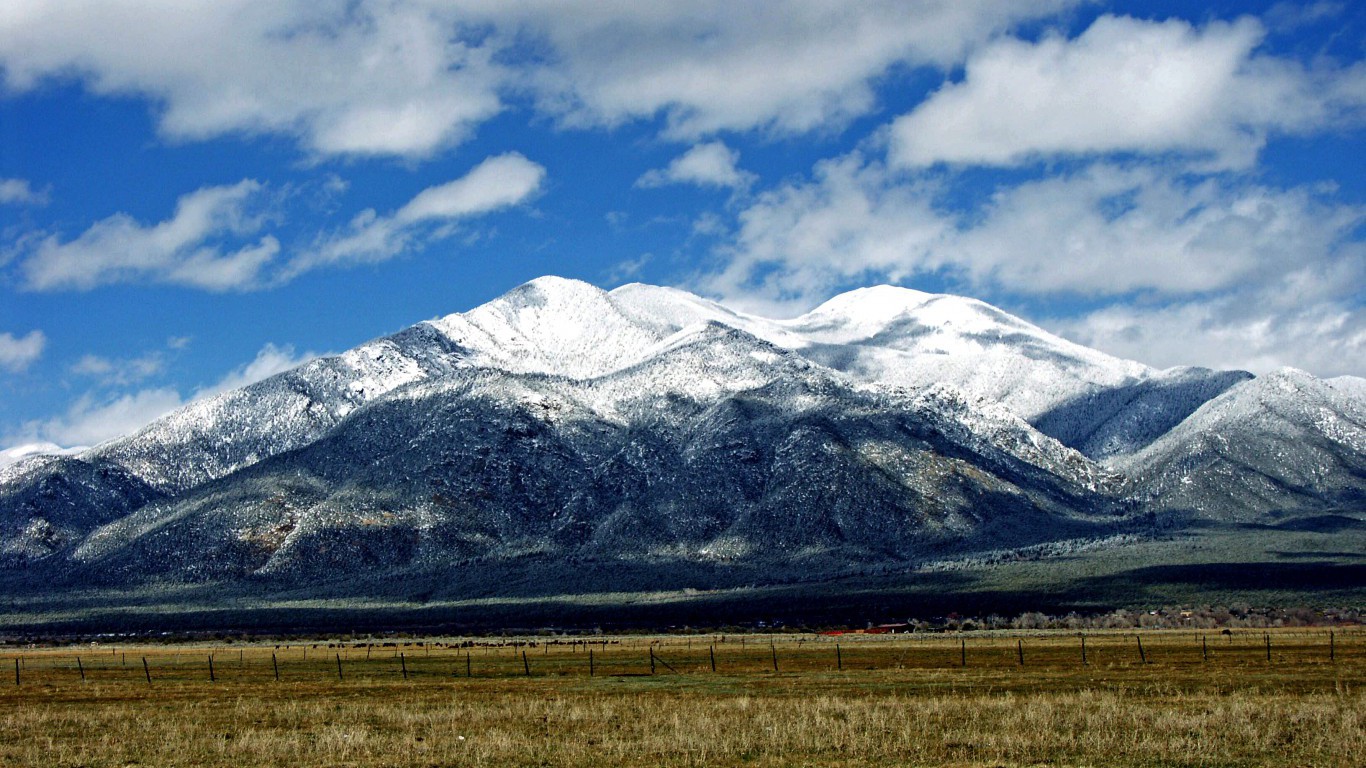
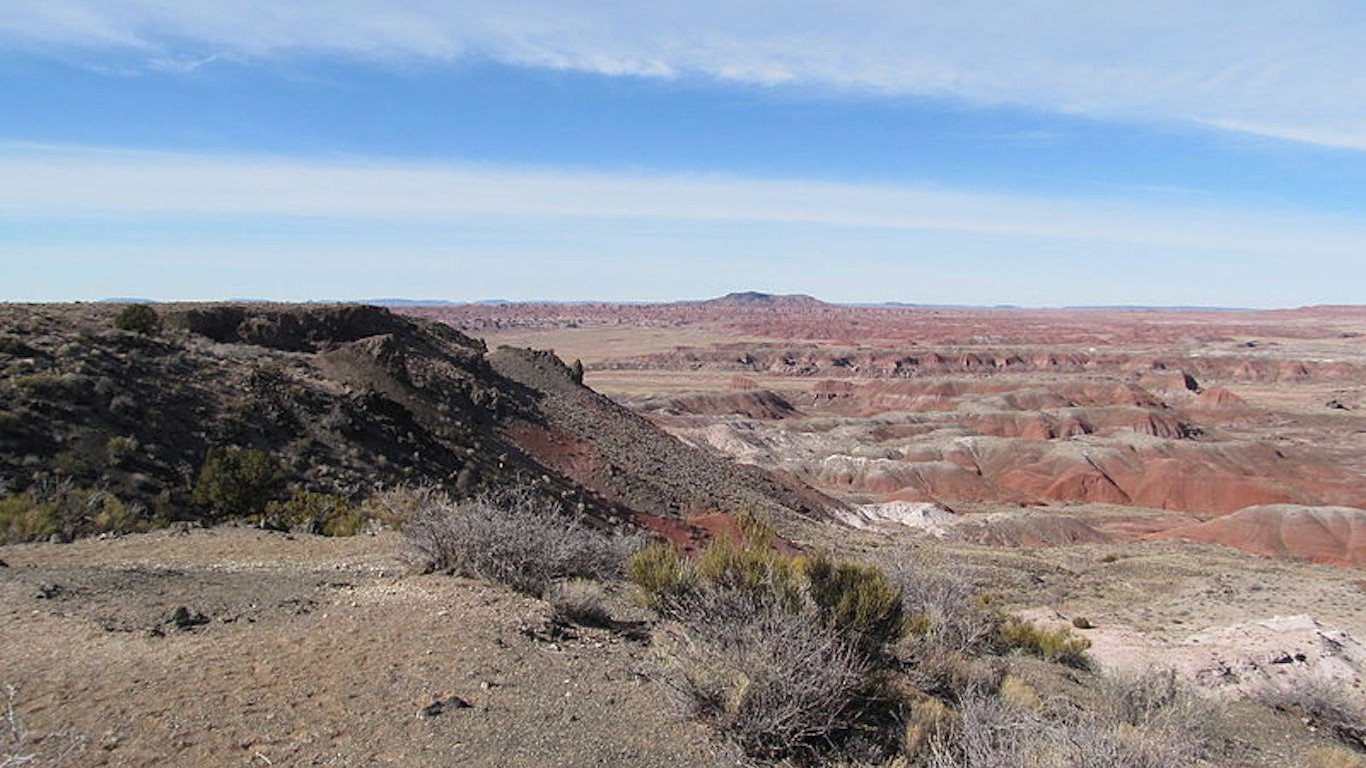
47. New Mexico
> 2016 GDP: $86.05 billion (14th smallest)
> 5 yr. GDP annual growth rate: 0.6% (5th smallest growth)
> Unemployment: 6.6% (2nd highest)
> 5 yr. annual employment growth: 0.7% (3rd slowest growth)
New Mexico is one of only two states where more than one in five residents live below the poverty line. The state’s widespread financial hardship is likely partially the result of a lack of available jobs. Some 6.6% of the state’s labor force is out of work, one of the highest shares of any state and well above the 4.3% U.S. unemployment rate. Job growth in the state has not kept pace with total U.S. job growth in the last five years. Between 2011 and 2016, total employment expanded by only 0.7% in New Mexico compared to 1.9% employment growth nationwide.
[in-text-ad-2]

46. Louisiana
> 2016 GDP: $205.61 billion (25th largest)
> 5 yr. GDP annual growth rate: -0.3% (3rd largest decline)
> Unemployment: 5.7% (3rd highest)
> 5 yr. annual employment growth: 0.6% (2nd slowest growth)
The state’s GDP contracted by 0.3% by 0.3% between 2011 and 2015, even as the U.S. economy grew by 2.0% over the same time period.
Having an educated workforce can bolster economic growth. In Louisiana, only 84.6% of adults have graduated from high school and only 23.2% have at least a bachelor’s degree — each among the lowest shares of any state and well below the corresponding 87.1% and 30.6% national shares.
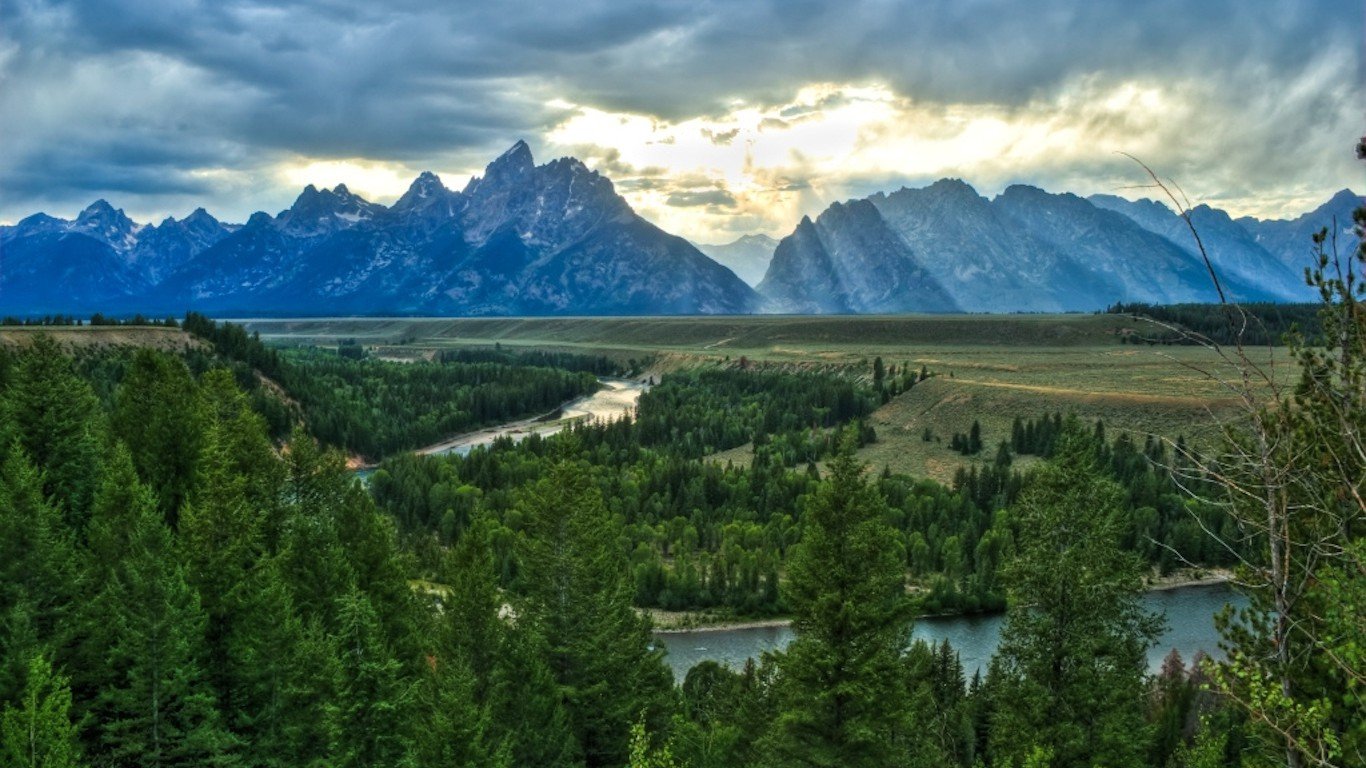
45. Wyoming
> 2016 GDP: $34.44 billion (2nd smallest)
> 5 yr. GDP annual growth rate: -1.1% (2nd largest decline)
> Unemployment: 4.1% (25th lowest)
> 5 yr. annual employment growth: -0.2% (2nd largest decline)
The total value of goods and services fell by 1.1% in Wyoming between 2011 and 2016 — the steepest decline of any state except for Alaska. The number of jobs in the state also fell by 0.2% over the same time period, the second worst employment decline in the country after only West Virginia.
Like many states with relatively weak economies, Wyoming is heavily dependent on its natural resources. About 8.0% of all jobs in the state are in resource extraction, the highest share of any state and well above the industry’s 1.3% share of total employment nationwide.
[in-text-ad]
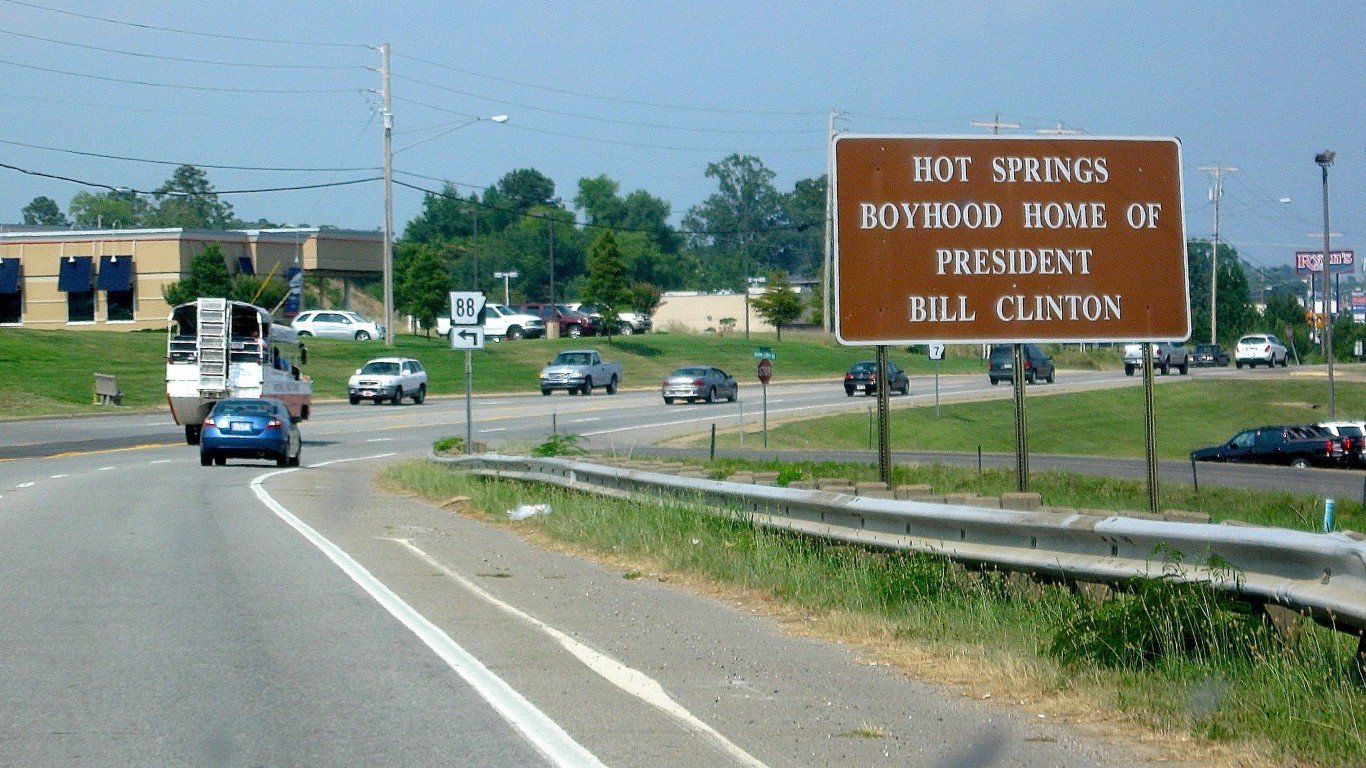
44. Arkansas
> 2016 GDP: $108.68 billion (17th smallest)
> 5 yr. GDP annual growth rate: 1.0% (tied–16th smallest growth)
> Unemployment: 3.4% (14th lowest)
> 5 yr. annual employment growth: 0.9% (10th slowest growth)
Arkansas is one of several states in the Southeast with a relatively weak economy. Though the state’s 3.4% jobless rate is well below the 4.3% nationwide unemployment rate, many in Arkansas are struggling financially. Some 19.1% of residents live below the poverty line, the fourth largest share of any state. In addition, the state’s economy is heavily dependent on manufacturing, an industry that will likely continue to decline in the United States as companies rely increasingly on automation and foreign labor.
[recirclink id=400089]

43. Kentucky
> 2016 GDP: $172.98 billion (22nd smallest)
> 5 yr. GDP annual growth rate: 0.9% (tied–12th smallest growth)
> Unemployment: 5.0% (5th highest)
> 5 yr. annual employment growth: 1.4% (24th slowest growth)
Kentucky’s economy has expanded by a rate of 0.9% a year since 2011, less than half the 2.0% annual national growth rate over that time. Once a source of major economic growth and steady employment, the state’s coal industry has been shedding jobs for years and continues to decline. In 2016 alone, Kentucky’s mining industry shed 3,500 jobs. High-growth industries such as information and professional services employ relatively small share of workers in the state. Kentucky also struggles with unemployment and poverty. Some 5.0% of workers in the state are unemployed, and 18.5% of residents live in poverty, each the sixth largest share of any state.
42. Alabama
> 2016 GDP: $181.21 billion (24th smallest)
> 5 yr. GDP annual growth rate: 0.8% (8th smallest growth)
> Unemployment: 4.9% (7th highest)
> 5 yr. annual employment growth: 1.1% (13th slowest growth)
Some 13.6% of Alabama’s workers are employed in manufacturing, a slow growth industry that will likely decline in the coming years as companies increasingly rely on automation and foreign labor. The state’s 1.1% annual employment growth rate between 2011 and 2016 lags behind most other states and the 1.9% nationwide employment growth over that time.
Wages tend to be lower in Alabama. Average wages in every major industry in the state are lower than the comparable typical wages nationwide. Partially as a result, Alabama’s GDP per capita of $37,261 is lower than in all but five other states.
[in-text-ad-2]
41. Oklahoma
> 2016 GDP: $175.08 billion (23rd smallest)
> 5 yr. GDP annual growth rate: 3.0% (tied–4th largest growth)
> Unemployment: 4.3% (21st highest)
> 5 yr. annual employment growth: 0.9% (9th slowest growth)
Oklahoma’s economy expanded at an annual rate of 3.0% over the last five years, one of the fastest growth rates of any state and well above the 2.0% U.S. GDP growth rate over the same time period. The rapidly increasing value of goods and services has not translated into rapid job growth, however. Over the same time period, employment in the state increased by an annualized rate of 0.9%, one of the smallest such growth rates of any state. Like many states with lagging economies, Oklahoma is heavily dependent on mining and resource extraction.

40. Nevada
> 2016 GDP: $128.83 billion (18th smallest)
> 5 yr. GDP annual growth rate: 1.2% (tied–19th smallest growth)
> Unemployment: 4.7% (13th highest)
> 5 yr. annual employment growth: 2.9% (4th fastest growth)
Employment climbed at an annual rate of 2.9% in Nevada over the last five years, one of the strongest improvements of any state and well above the 1.9% annual U.S. employment growth rate. Despite strong job growth, some 4.7% of Nevada’s workers are unemployed, slightly higher than the 4.3% U.S. unemployment rate.
No state economy is as dependent on tourism as Nevada’s, and the accommodation and food services industry detracted 0.2 percentage points from the state’s GDP growth last year. The highest growth industries in the coming years will require a college education, and only 23.6% of adults Nevada have at least a bachelor’s degree, one of the smallest shares among states.
[in-text-ad]
39. Arizona
> 2016 GDP: $267.47 billion (21st largest)
> 5 yr. GDP annual growth rate: 1.6% (tied–18th largest growth)
> Unemployment: 5.1% (4th highest)
> 5 yr. annual employment growth: 2.4% (10th fastest growth)
Employment increased at an annual rate of 2.4% in Arizona between 2011 and 2016, a more rapid improvement than in the vast majority of states. Despite the increase in available jobs, Arizona is one of only four states with an unemployment rate above 5%.
Pervasive financial hardship can be a symptom of a weak economy. In Arizona, 17.4% of residents live in poverty compared to only 14.7% of all Americans.
[recirclink id=397755]
38. Ohio
> 2016 GDP: $552.46 billion (7th largest)
> 5 yr. GDP annual growth rate: 1.6% (tied–18th largest growth)
> Unemployment: 4.9% (7th highest)
> 5 yr. annual employment growth: 1.4% (23rd slowest growth)
Ohio is one of many states in the Appalachian Region where residents struggle with high unemployment and slow economic growth. The state’s unemployment rate of 4.9% is higher than the 4.3% national jobless rate. And unemployment could get worse. Relatively few workers in Ohio are employed in fast-growing industries such as information, while employment in the state is highly concentrated in the shrinking manufacturing industry. Some 12.9% of workers in the state are employed in the manufacturing industry, the eighth largest share nationwide. In 2016, the durable goods manufacturing industry detracted more from Ohio’s GDP growth rate than any other sector.

37. Pennsylvania
> 2016 GDP: $651.96 billion (6th largest)
> 5 yr. GDP annual growth rate: 1.8% (tied–15th largest growth)
> Unemployment: 5.0% (5th highest)
> 5 yr. annual employment growth: 0.7% (5th slowest growth)
Pennsylvania is one of only a dozen states where annual employment growth averaged less than 1.0% per year between 2011 and 2016. The state’s slow job growth may partially explain the higher than average jobless rate. Some 5.0% of Pennsylvania’s workers are unemployed, and another 10.6% are underemployed. This is well above the corresponding 4.3% and 9.6% unemployment and underemployment rates nationwide.
Like many states with lagging economies, Pennsylvania is more reliant on manufacturing than the country as a whole. Pennsylvania’s manufacturing sector was a drag on economic growth in the last year.
[in-text-ad-2]
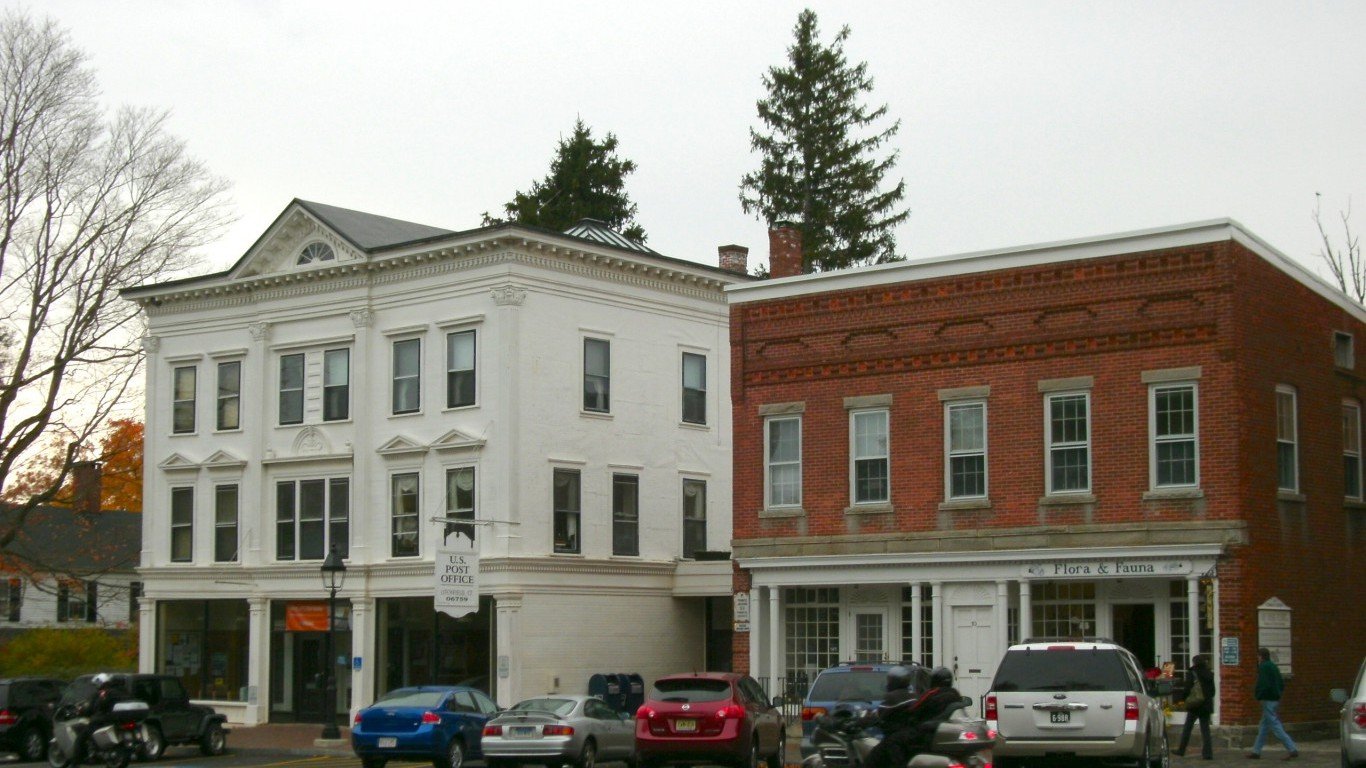
36. Connecticut
> 2016 GDP: $230.72 billion (23rd largest)
> 5 yr. GDP annual growth rate: 0.2% (the smallest growth)
> Unemployment: 4.9% (7th highest)
> 5 yr. annual employment growth: 0.7% (4th slowest growth)
While Connecticut is one of the wealthiest and most well-educated states, outbound migration and high unemployment have weakened the state’s economy in recent years. Since 2011, the number of jobs in Connecticut has increased by only 0.7% each year on average, the sixth slowest employment growth of any state. The BLS estimates that 10.8% of Connecticut workers are unemployed, discouraged from seeking employment, or working a part-time job after failing to find full-time employment, the eighth highest underemployment rate of any state.
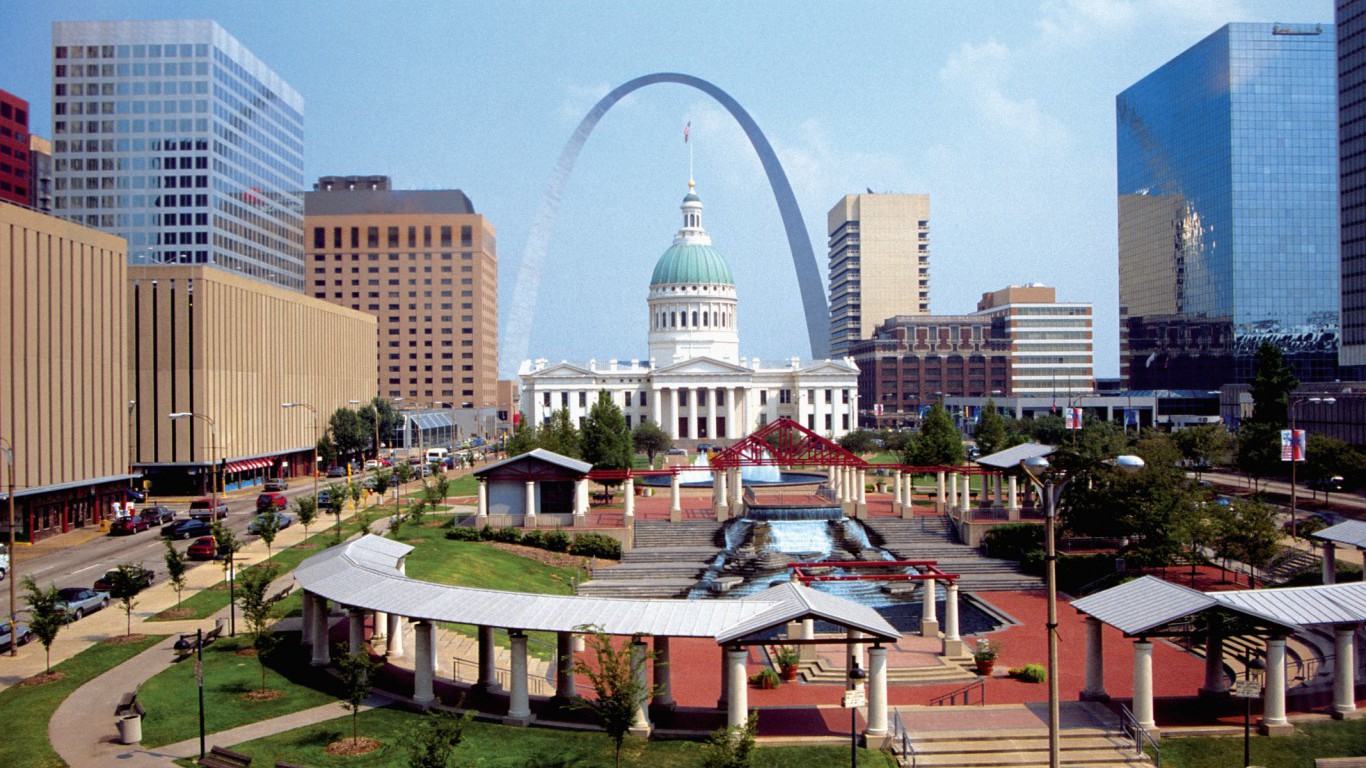
35. Missouri
> 2016 GDP: $263.93 billion (22nd largest)
> 5 yr. GDP annual growth rate: 1.1% (17th smallest growth)
> Unemployment: 3.9% (20th lowest)
> 5 yr. annual employment growth: 1.3% (20th slowest growth)
Like neighboring Kansas, Missouri has experienced sluggish economic growth in recent years. The number of jobs in the the state has increased by 1.3% on average annually since 2011, slower than the 1.9% national employment growth rate. Over the same period, the state’s GDP grew by just 1.1% on average annually, roughly half the 2.0% national growth rate. Missouri’s economy somewhat mirrors the industrial composition of the nation as a whole, and like the U.S. overall, mining and manufacturing curbed growth more than any other sector in 2016.
[in-text-ad]
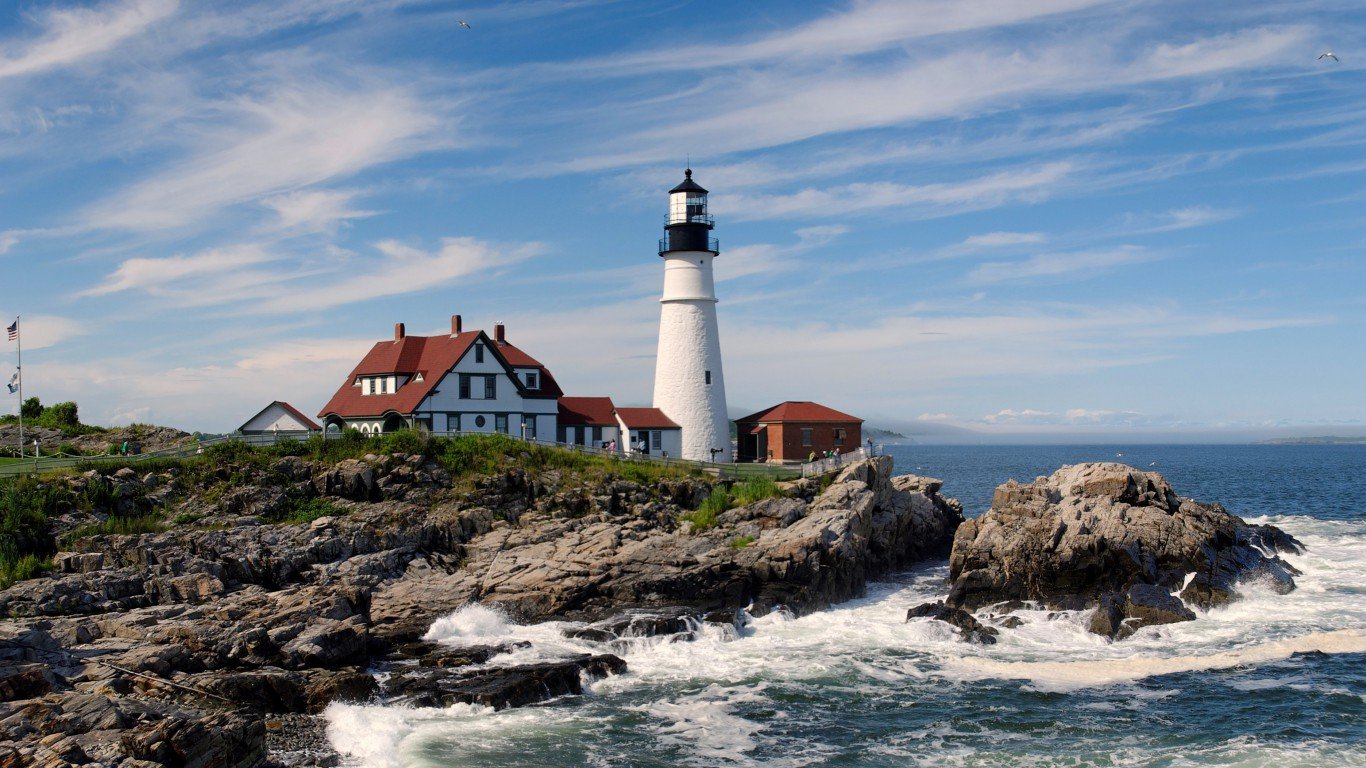
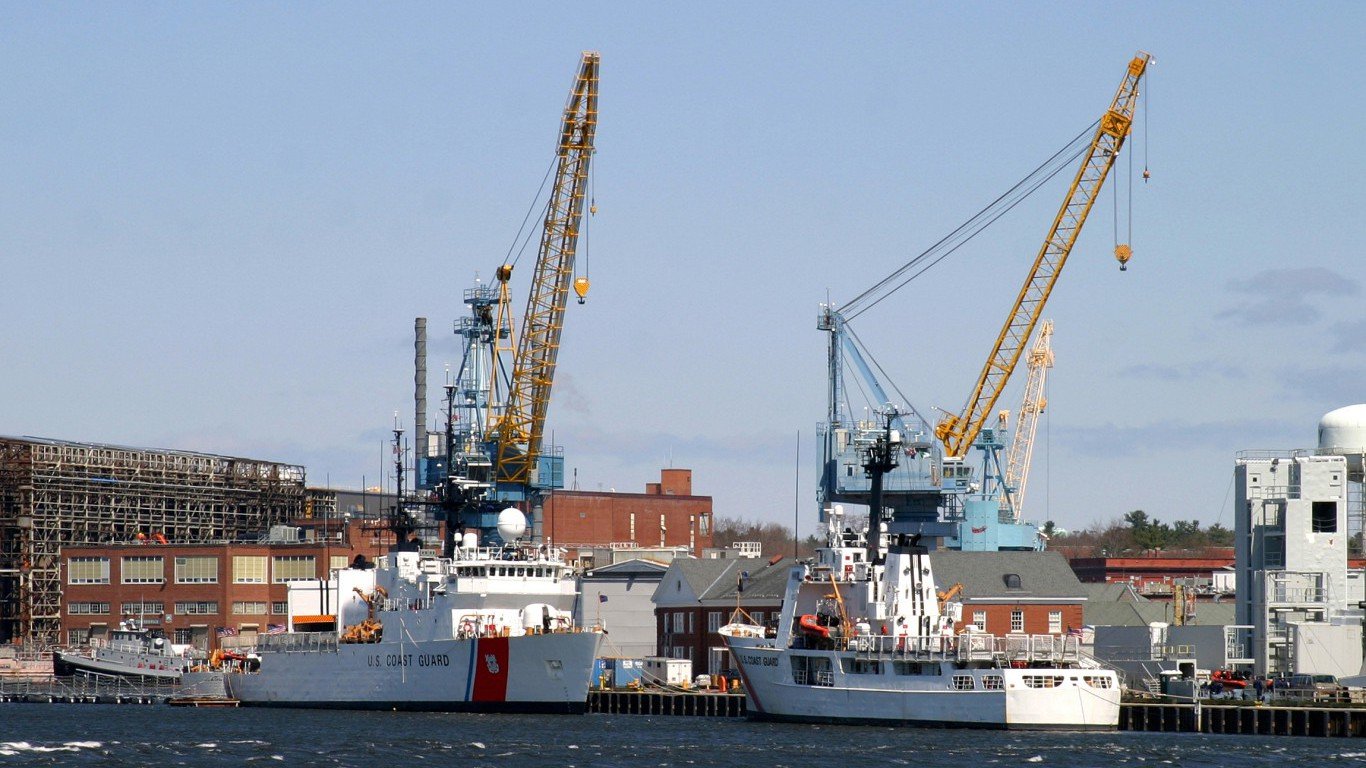
34. Maine
> 2016 GDP: $51.82 billion (8th smallest)
> 5 yr. GDP annual growth rate: 0.6% (5th smallest growth)
> Unemployment: 3.2% (13th lowest)
> 5 yr. annual employment growth: 0.8% (6th slowest growth)
Maine’s economy expanded by an annual rate of 0.6% over each of the last five years — a relatively sluggish pace compared to the 2.0% annual U.S. GDP growth. Recently, economic growth in the state has been stymied in large part by manufacturing, an industry suffering from increasing automation and outsourcing. However, some of those losses were balanced out by growth in the construction industry. New housing starts in Maine are up 12.9% over the previous year, much higher than the comparable 1.0% nationwide growth.
[recirclink id=400089]
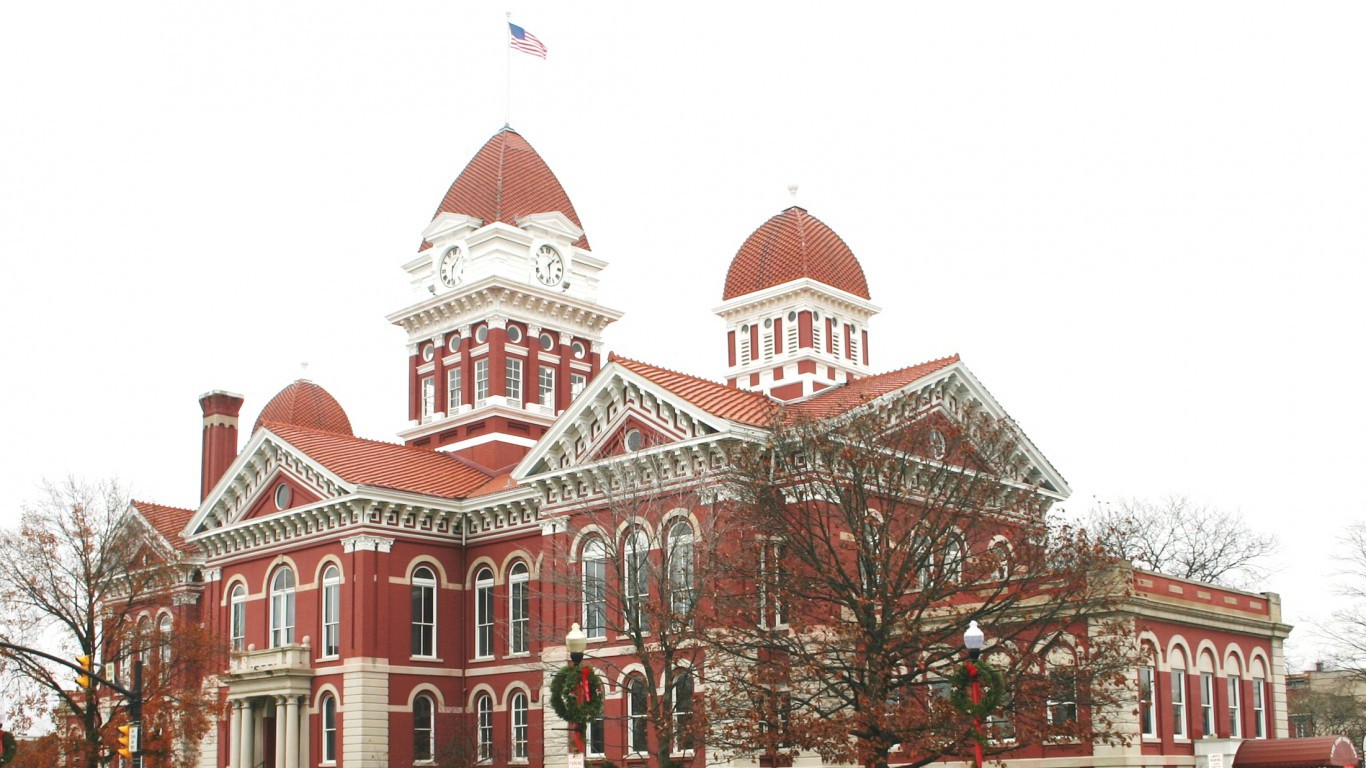
33. Indiana
> 2016 GDP: $300.59 billion (16th largest)
> 5 yr. GDP annual growth rate: 1.4% (tied–23rd largest growth)
> Unemployment: 3.2% (13th lowest)
> 5 yr. annual employment growth: 1.6% (21st fastest growth)
Indiana’s GDP has grown at an annual rate of 1.4% annually since 2011, far slower than the 2.0% national rate. One reason for the slow economic growth is the state’s industrial composition. Relatively few workers in the state are employed in fast-growing industries like information and professional services, while 17.5% of jobs in Indiana are in manufacturing — the largest share of any state. Indiana’s potential for economic growth is further stymied by the state’s shallow talent pool. Just 24.9% of adults in the state have a bachelor’s degree, the ninth smallest share of all states.

32. Tennessee
> 2016 GDP: $287.78 billion (19th largest)
> 5 yr. GDP annual growth rate: 2.3% (9th largest growth)
> Unemployment: 4.0% (21st lowest)
> 5 yr. annual employment growth: 2.1% (14th fastest growth)
Faring far better than many neighboring states, Tennessee’s economy grew at an annual rate of 2.3% over the last five years. While manufacturing was a drag on many state economies, the durable goods manufacturing sector was a boon for Tennessee’s economy, contributing 0.36 percentage points to overall GDP growth last year.
Despite strong economic growth, many Tennessee residents face serious financial hardship. Some 16.7% of the state’s population lives below the poverty line, the 10th highest poverty rate of any state.
[in-text-ad-2]

31. North Carolina
> 2016 GDP: $449.75 billion (10th largest)
> 5 yr. GDP annual growth rate: 1.5% (tied–21st largest growth)
> Unemployment: 4.5% (17th highest)
> 5 yr. annual employment growth: 2.1% (13th fastest growth)
While North Carolina’s large metro areas, such as Charlotte, Raleigh, and Durham, have experienced substantial economic growth in high-tech industries in recent years, the rural, manufacturing-dependent parts of the state have slowed the state’s overall economic growth. Indeed, manufacturing comprises a relatively large 10.9% of employment in the state, as does the information sector, accounting for 1.8% of total employment. In 2016, nondurable goods manufacturing curbed GDP growth more than any other sector. Overall, the state’s economy has grown 1.5% annually since 2011, slower than the 2.0% national rate.

30. Illinois
> 2016 GDP: $692.45 billion (5th largest)
> 5 yr. GDP annual growth rate: 1.0% (tied–16th smallest growth)
> Unemployment: 4.6% (16th highest)
> 5 yr. annual employment growth: 1.1% (16th slowest growth)
Dragged down recently by the government and manufacturing sectors, GDP growth in Illinois has been sluggish. The government sector is bogged down in gridlock, unable to pass a budget since 2015, while manufacturing in the state has been affected by the familiar forces of automation and outsourcing. The total value of goods and services in the state grew by only about 1.0% in each of the last five years, about half the national GDP growth rate. Total employment increased at a similarly slow pace. Partially as a result, 4.6% of workers in Illinois are looking for a job, a slightly larger share than the 4.3% U.S. unemployment rate.
[in-text-ad]

29. Georgia
> 2016 GDP: $461.11 billion (9th largest)
> 5 yr. GDP annual growth rate: 2.2% (10th largest growth)
> Unemployment: 4.9% (7th highest)
> 5 yr. annual employment growth: 2.4% (11th fastest growth)
Though economic conditions are better in Georgia than they are across most states in the Southeast, the Peach State still lags behind much of the country in a number of measures. Though employment has gone up annually in Georgia by a relatively rapid 2.4% over the last five years, some 4.9% of the workforce remains jobless, one of the higher unemployment rates of any state. Additionally, 17.0% of people in Georgia live in poverty, higher than the nationwide poverty rate of 14.7%.
[recirclink id=398427]
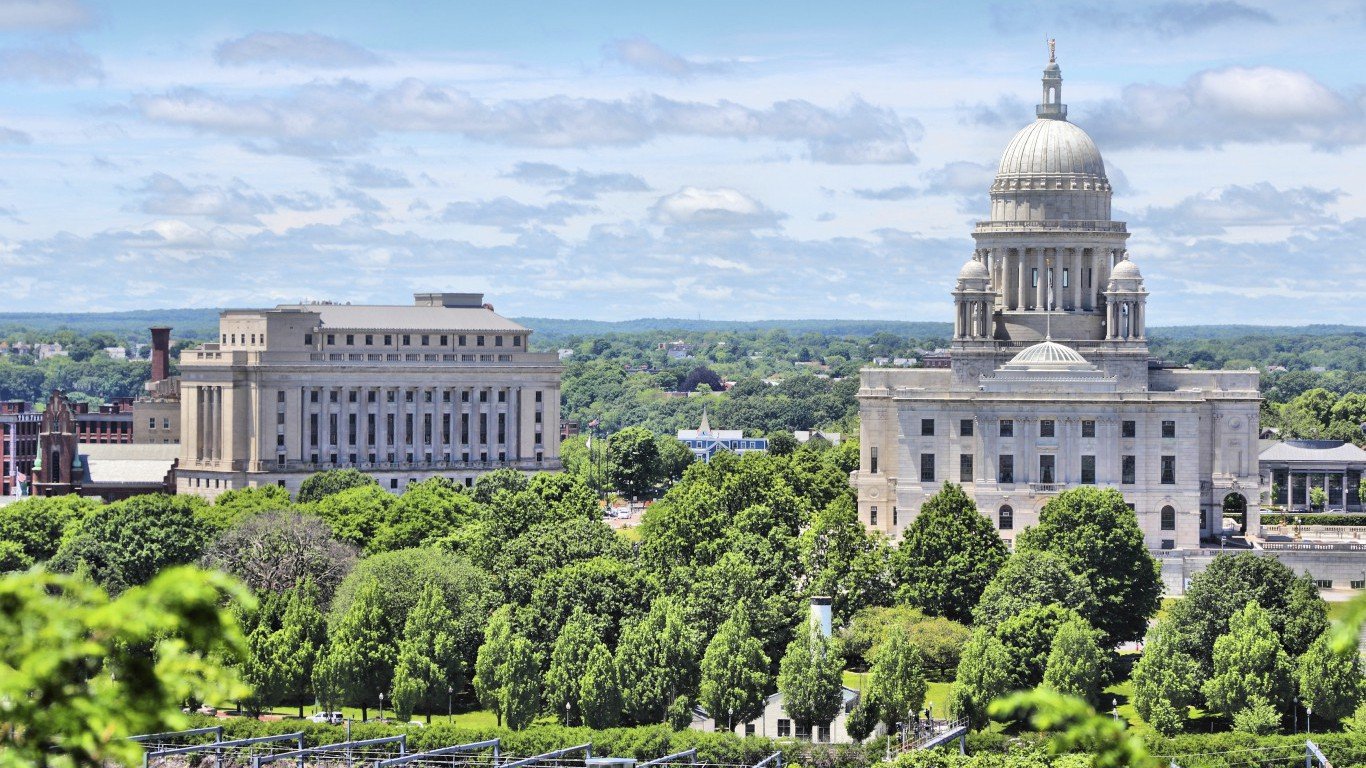
28. Rhode Island
> 2016 GDP: $50.33 billion (7th smallest)
> 5 yr. GDP annual growth rate: 0.8% (8th smallest growth)
> Unemployment: 4.1% (25th lowest)
> 5 yr. annual employment growth: 1.1% (12th slowest growth)
Economic growth in Rhode Island has been relatively sluggish in recent years. The state’s GDP grew at a 0.8% annual rate over the last five years, well below the 2.0% annual U.S. GDP growth rate over the same period. Annual employment growth during that time was also below comparable measures in most states.
As was the case in many states, Rhode Island’s manufacturing sector stymied growth. However, strong growth in Rhode Island’s construction sector was more than enough to balance out economic contraction in manufacturing. New housing starts were up over 20% in Rhode Island 2016, one of the largest increases of any state.
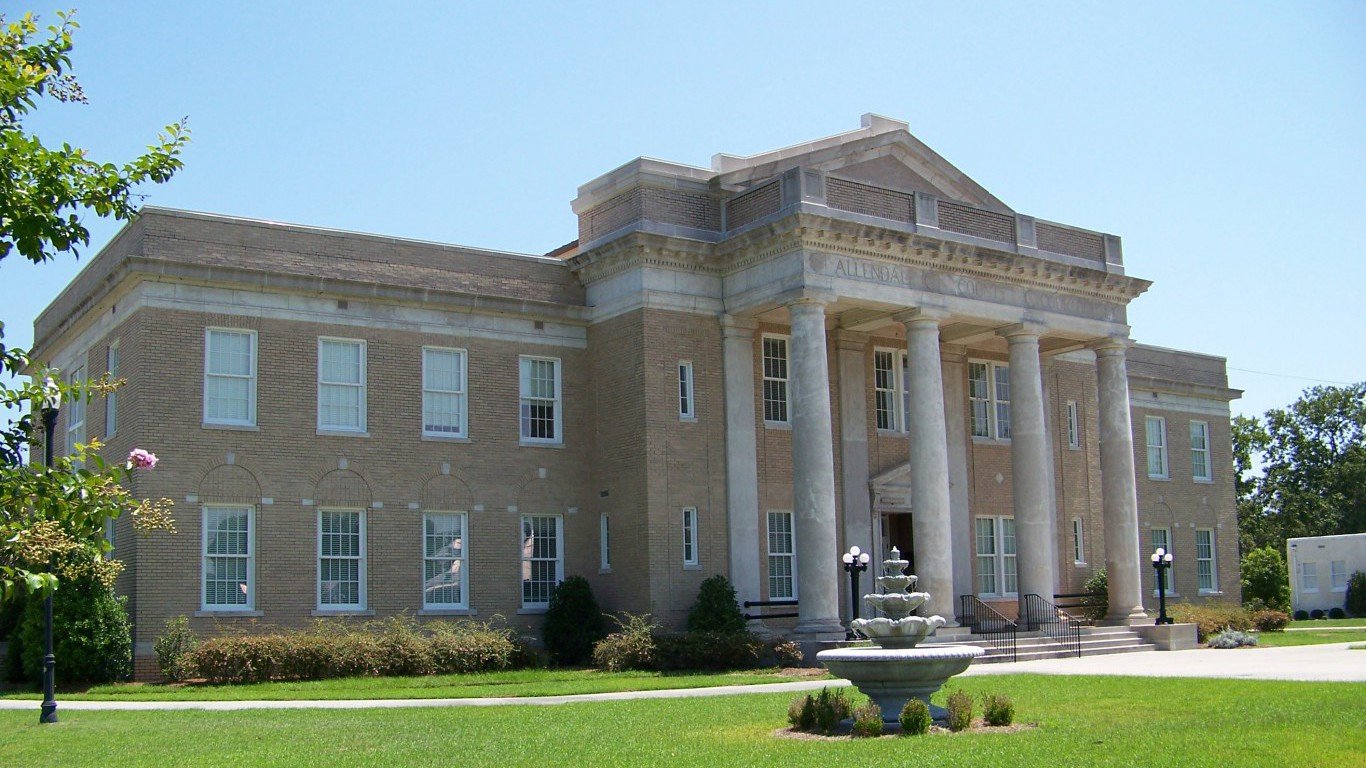
27. South Carolina
> 2016 GDP: $183.87 billion (25th smallest)
> 5 yr. GDP annual growth rate: 2.0% (11th largest growth)
> Unemployment: 4.1% (25th lowest)
> 5 yr. annual employment growth: 2.3% (12th fastest growth)
While inbound migration in recent years has kept South Carolina’s economic growth on par with the country as a whole, the state is still among the poorest in the nation. South Carolina’s GDP has increased at a compound annual rate of 2.0% annually since 2011, in line with national growth.
Still, the industries that led growth in the state over the past year — construction and professional services — are relatively low paying in South Carolina, and the annual average wage of $42,879 for all industries is the ninth lowest of all states. An estimated 16.6% of South Carolina residents live in poverty, far more than the 14.7% national poverty rate.
[in-text-ad-2]
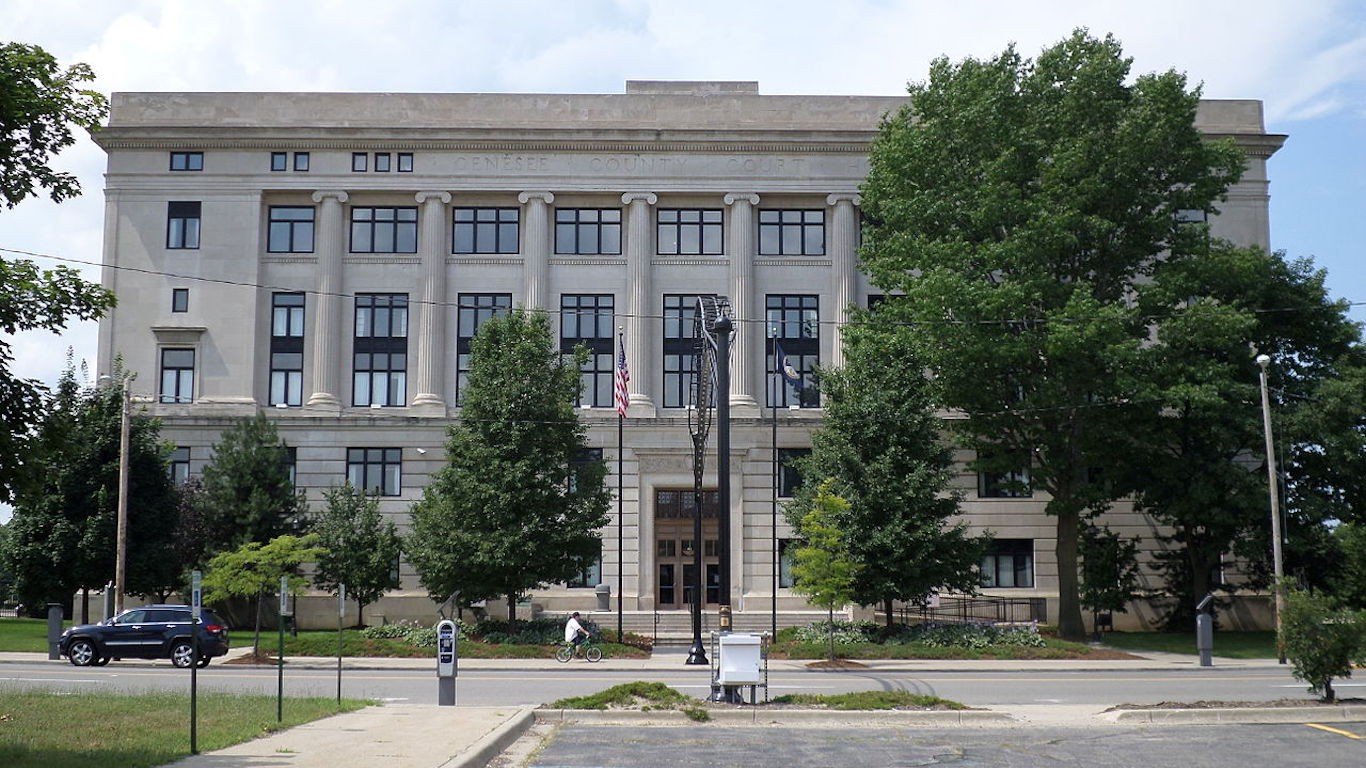
26. Michigan
> 2016 GDP: $430.61 billion (13th largest)
> 5 yr. GDP annual growth rate: 1.9% (tied–13th largest growth)
> Unemployment: 4.2% (23rd highest)
> 5 yr. annual employment growth: 1.9% (15th fastest growth)
While perhaps no U.S. city has suffered from a more dramatic economic decline than Detroit, economic conditions in Michigan closely match those across the nation as a whole. Over the last five years, the state’s annualized employment and GDP growth rates — each at 1.9% — were within a 10th of a percentage point of the corresponding national rate. Additionally, 4.2% of Michigan’s workers are out of a job, just below the 4.3% U.S. unemployment rate. However, adults in Michigan are less likely to have a bachelor’s degree than adults nationwide — putting the state at a disadvantage for attracting high growth industries in the coming years.
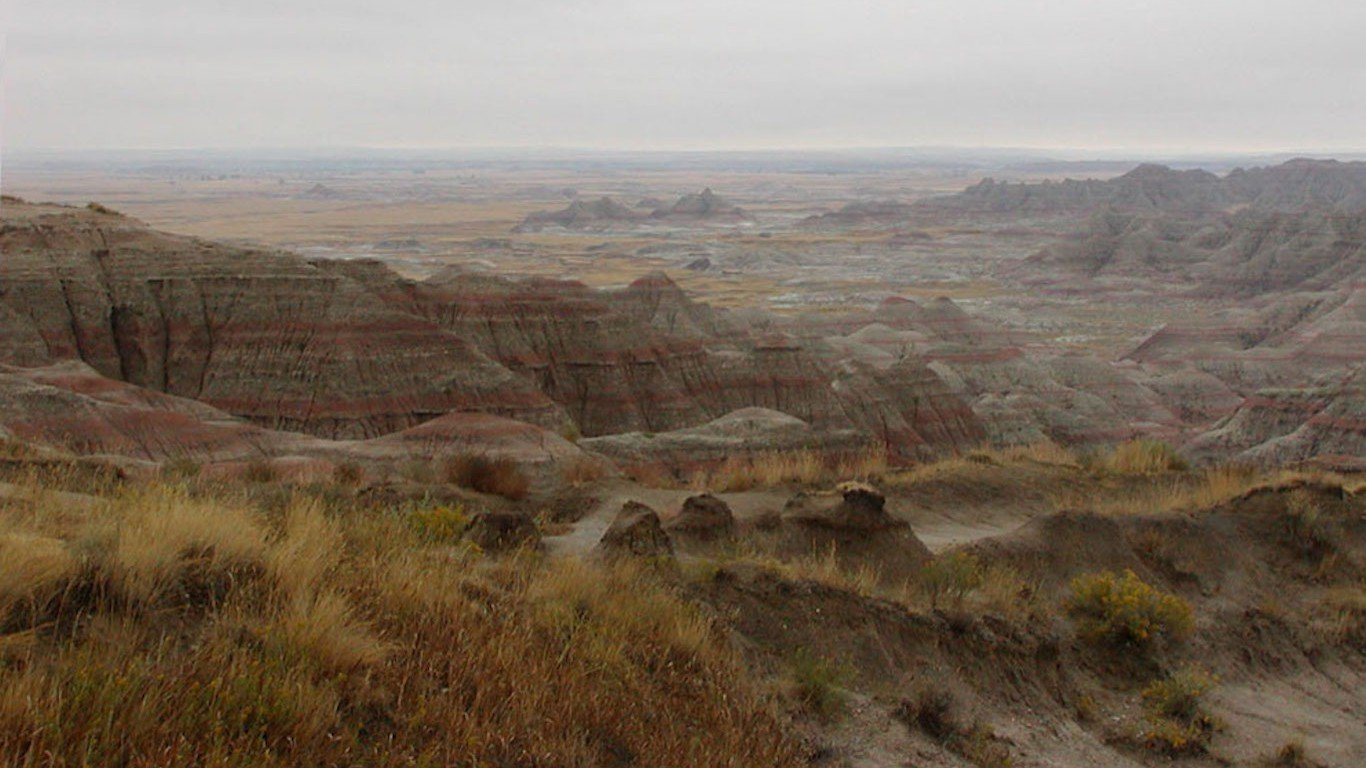
25. South Dakota
> 2016 GDP: $41.61 billion (4th smallest)
> 5 yr. GDP annual growth rate: 1.0% (tied–16th smallest growth)
> Unemployment: 2.9% (6th lowest)
> 5 yr. annual employment growth: 1.3% (21st slowest growth)
Employment in South Dakota grew at a 1.3% annual pace over the five years since 2011, slightly below 1.9% employment growth nationwide. Still, only 2.9% of the state’s workforce are out of a job, one of the lowest unemployment rates of any state. Similarly, only 5.2% of workers in the state are underemployed, the smallest share of any state.
Construction was a major driver of GDP growth in 2016, as new housing starts were up 26.7% that year compared to 2015, the second largest increase of any state.
[in-text-ad]

24. Delaware
> 2016 GDP: $60.61 billion (10th smallest)
> 5 yr. GDP annual growth rate: 0.9% (tied–12th smallest growth)
> Unemployment: 4.7% (13th highest)
> 5 yr. annual employment growth: 1.7% (19th fastest growth)
Delaware is one of many northeastern states where sluggish population growth and a struggling business services sector has hindered economic activity. While the national professional services sector was the second largest contributor to U.S. GDP growth in 2016, the industry detracted more from Delaware’s economic growth than any other sector.
Delaware’s manufacturing sector has also struggled. Chrysler closed its manufacturing plant in the state in 2008 and General Motors followed in 2009. In 2016, manufacturing detracted more from GDP growth than any sector other than professional services. Still, the state has a lower poverty rate and higher bachelor’s degree attainment rate than the nation as a whole.
[recirclink id=400089]
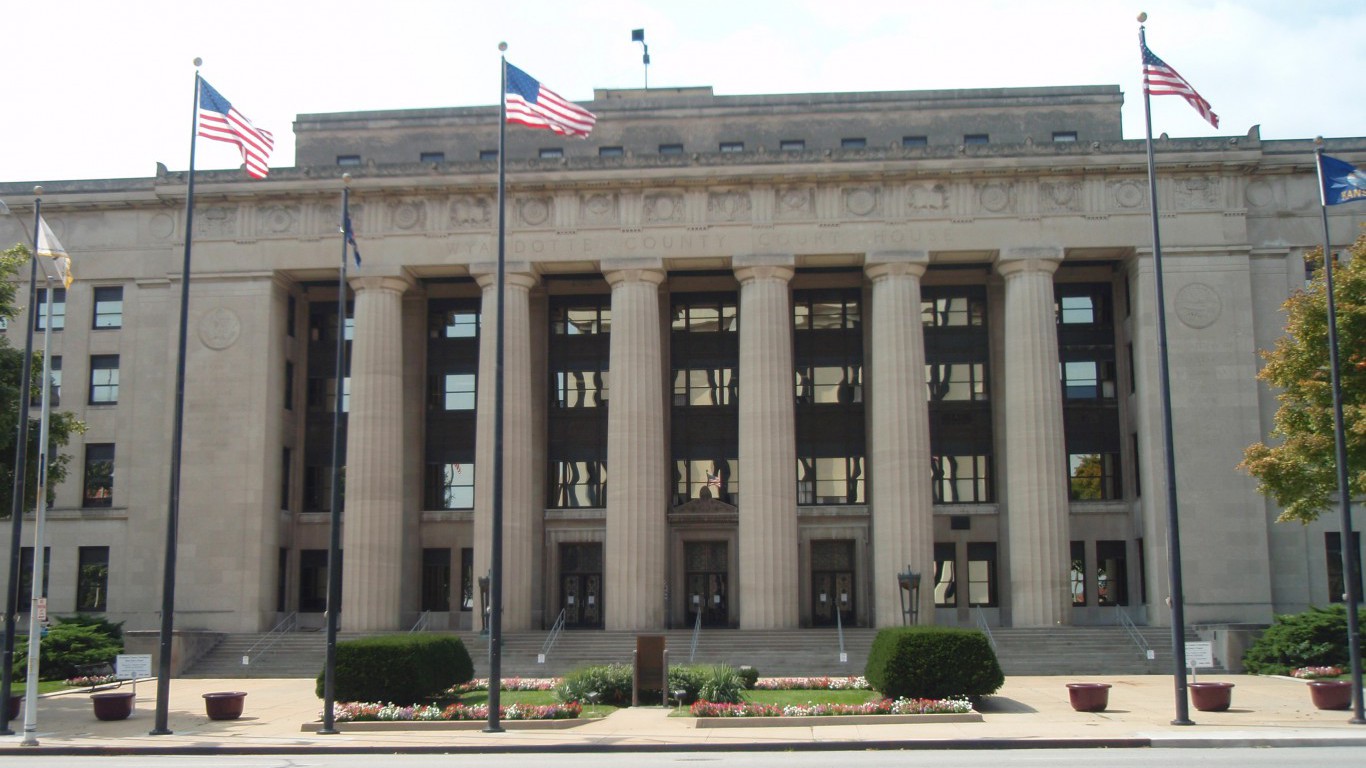
23. Kansas
> 2016 GDP: $136.59 billion (20th smallest)
> 5 yr. GDP annual growth rate: 0.9% (tied–12th smallest growth)
> Unemployment: 3.7% (17th lowest)
> 5 yr. annual employment growth: 1.0% (11th slowest growth)
An educated population often translates to a more talented and capable talent pool for employers. Across Kansas, 90.3% of adults have graduated high school, and 31.7% of adults have at least a bachelor’s degree, each higher than the corresponding shares nationwide. Economic outcomes also tend to be better in Kansas than in many other states. Only 3.7% of the state’s workforce are out of a job, and 13.0% of the population lives in poverty, slightly below the nationwide 4.3% unemployment rate and 14.7% poverty rate.
Still, annual GDP and employment growth have been relatively slow in Kansas over the last five years.

22. Montana
> 2016 GDP: $41.03 billion (3rd smallest)
> 5 yr. GDP annual growth rate: 1.3% (tied–22nd smallest growth)
> Unemployment: 3.9% (20th lowest)
> 5 yr. annual employment growth: 1.5% (23rd fastest growth)
While relatively few workers in Montana are employed in fast-growing, high-wage industries such as information, financial activities, and professional services, 2.6% of the state’s workforce is employed in mining — twice the national share. Like the nation as a whole, Montana’s mining sector was the largest drag on GDP growth in 2016. Overall, Montana’s annualized GDP growth rate of 1.3% since 2011 was far slower than the 2.0% national rate.
Despite the slower economic growth, relatively few state residents struggle with poverty and unemployment. An estimated 14.6% of the state’s population lives in poverty, and 3.9% of the labor force is unemployed — below the 14.7% national poverty rate and the 4.3% unemployment rate.
[in-text-ad-2]

21. New York
> 2016 GDP: $1.28 trillion (3rd largest)
> 5 yr. GDP annual growth rate: 1.3% (tied–22nd smallest growth)
> Unemployment: 4.4% (20th highest)
> 5 yr. annual employment growth: 1.6% (20th fastest growth)
New York is the fourth largest state by population and the third largest by GDP. A relatively well-educated state, some 35.0% of adults in New York have at least a bachelor’s degree, one of the higher shares among all states. Still, economic growth in the Empire State has not been especially robust in recent years. New York’s economy grew at an annual rate of 1.3% between 2011 and 2016, slightly below the 2.0% GDP growth nationwide over the same period. The state’s finance and insurance sector is one of the largest by total employment of any state — and last year, the industry posed a 0.14 percentage point drag on total GDP growth.
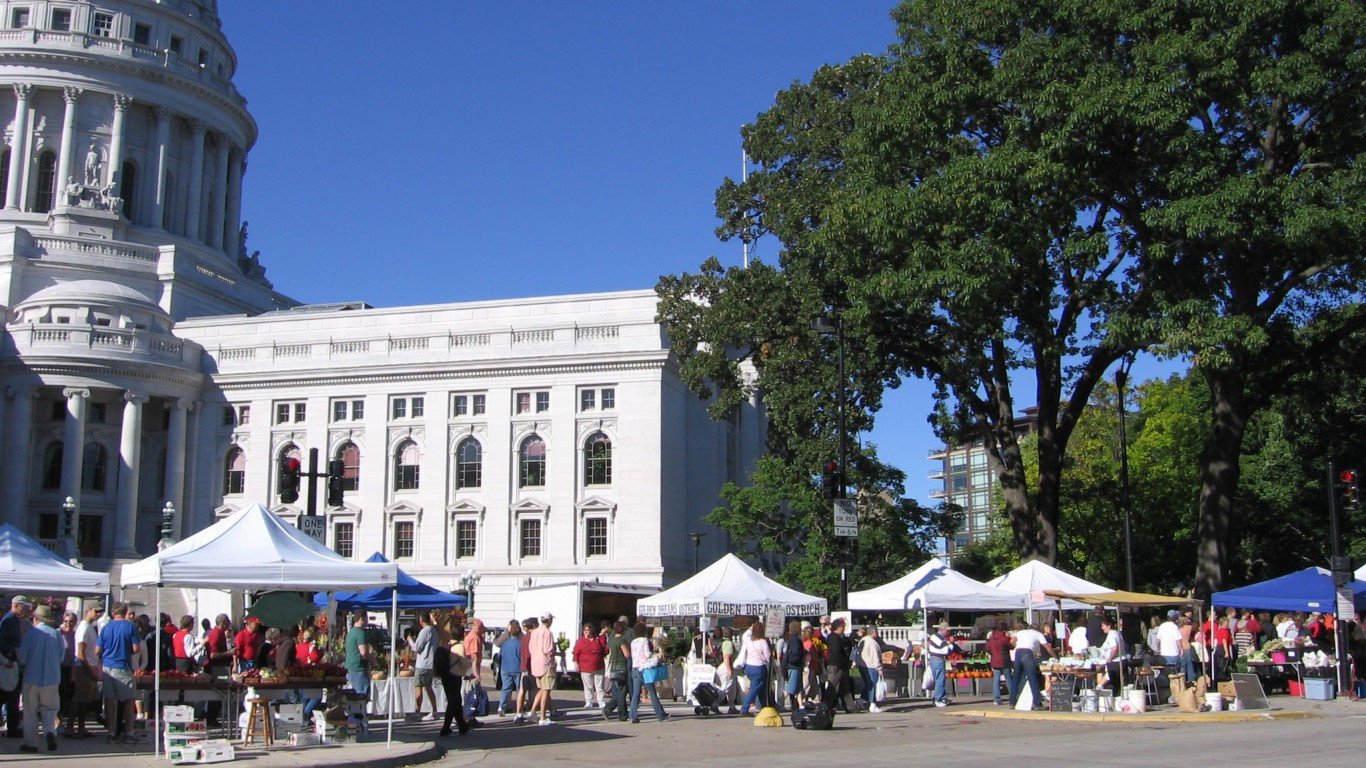
20. Wisconsin
> 2016 GDP: $273.14 billion (20th largest)
> 5 yr. GDP annual growth rate: 1.3% (tied–22nd smallest growth)
> Unemployment: 3.1% (9th lowest)
> 5 yr. annual employment growth: 1.2% (19th slowest growth)
Just 3.1% of Wisconsin’s workforce is unemployed, and only 12.1% of residents live in poverty — far less than the corresponding national rates. While relatively few residents struggle with poverty and unemployment, economic growth in Wisconsin has trailed that of the U.S. economy since 2011. Wisconsin’s workforce is concentrated in slow-growing industries such as manufacturing and is poorly represented in fast-growing industries like professional services. Some 16.4% of workers in the state are employed in the manufacturing industry, the second largest share of all states. The industry curbed the state’s economic growth more than any other sector in 2016.
[in-text-ad]
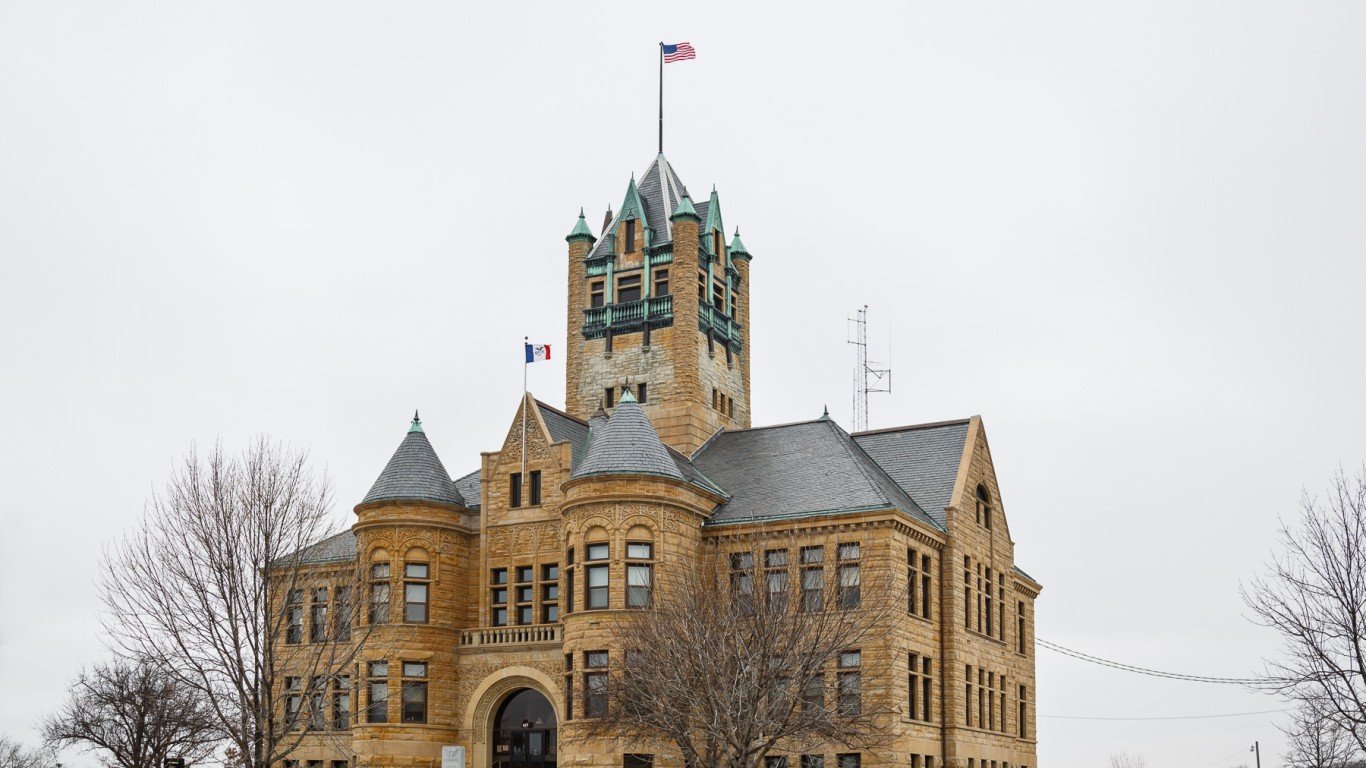
19. Iowa
> 2016 GDP: $157.72 billion (21st smallest)
> 5 yr. GDP annual growth rate: 2.0% (11th largest growth)
> Unemployment: 3.1% (9th lowest)
> 5 yr. annual employment growth: 1.2% (17th slowest growth)
Iowa’s 2.0% annual GDP growth rate between 2011 and 2016 is exactly in line with economic growth nationwide. As was the case in many states, the manufacturing sector presented the largest drag on Iowa’s economy in 2016. However, major gains in agriculture and finance were more than enough to offset economic losses attributable to manufacturing.
With an unemployment rate of only 3.1%, joblessness is not a major problem in Iowa. Only six states have a lower unemployment rate than Iowa.
[recirclink id=398277]
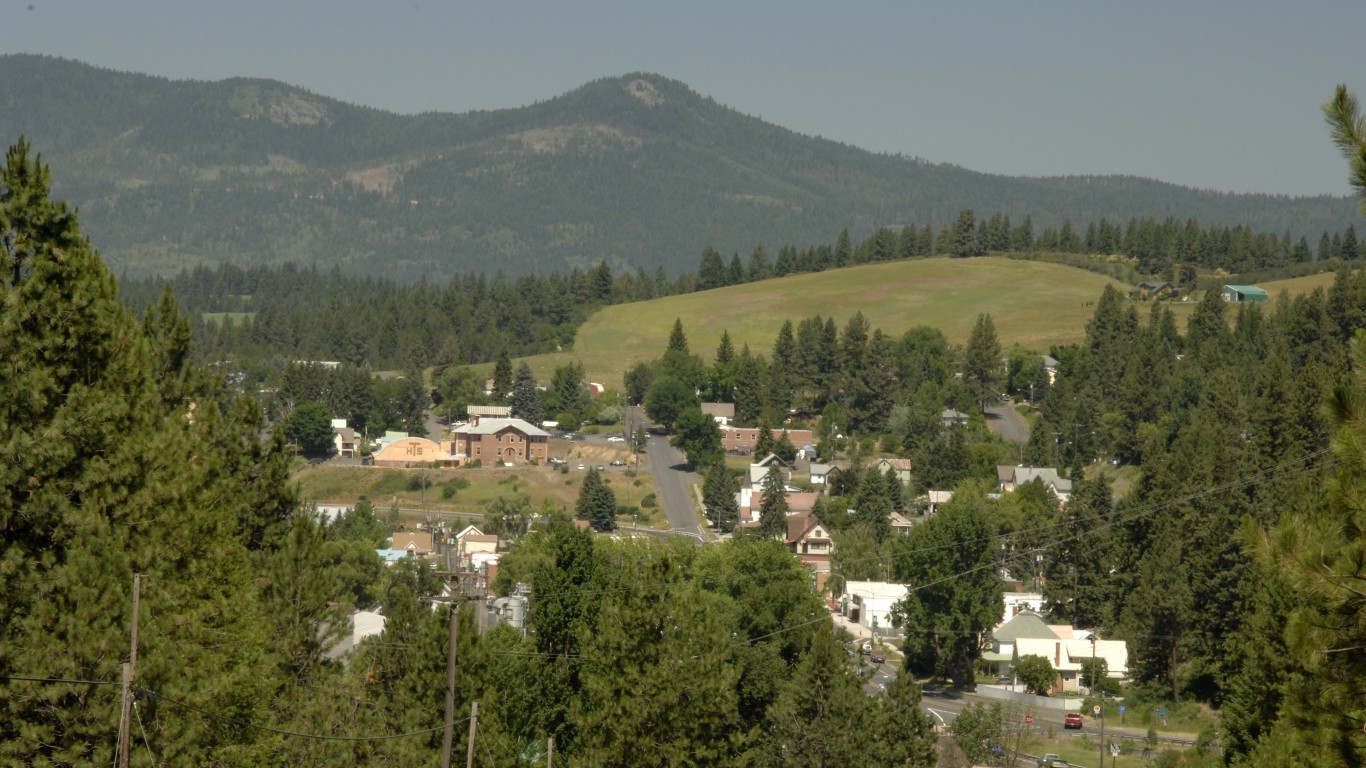
18. Idaho
> 2016 GDP: $59.69 billion (9th smallest)
> 5 yr. GDP annual growth rate: 1.9% (tied–13th largest growth)
> Unemployment: 3.2% (13th lowest)
> 5 yr. annual employment growth: 2.5% (8th fastest growth)
Idaho’s annual compound employment growth rate of 2.5% between 2011 and 2016 is among the highest of any state. Due in part to rapid employment growth, only 3.2% of the state’s labor force is jobless, well below the 4.3% U.S. unemployment rate.
In 2016, the construction sector contributed 0.59 percentage points to total GDP growth in Idaho, the highest such share of any state. The uptick in construction was likely driven in large part by new home construction. New housing starts are up 22.5% in Idaho from the year prior, one of the largest increases of any state.

17. Texas
> 2016 GDP: $1.50 trillion (2nd largest)
> 5 yr. GDP annual growth rate: 3.9% (2nd largest growth)
> Unemployment: 4.8% (12th highest)
> 5 yr. annual employment growth: 2.5% (7th fastest growth)
Texas is the second largest state by population and land area, and the second largest economy. The size of the state’s economy is due in no small part to its immense crude oil and natural gas reserves. No U.S. state produces more energy than Texas. The industry also pays well in Texas. The average resources and mining worker earns $110,430 a year, approximately twice the industry average nationwide and the second highest average annual wage for the industry of all states.
The state’s unemployment rate of 4.8% and poverty rate of 15.9% are each higher than the corresponding national rates, which indicates the state’s economy may not be as favorable to residents as its growth rate and size would suggest.
[in-text-ad-2]
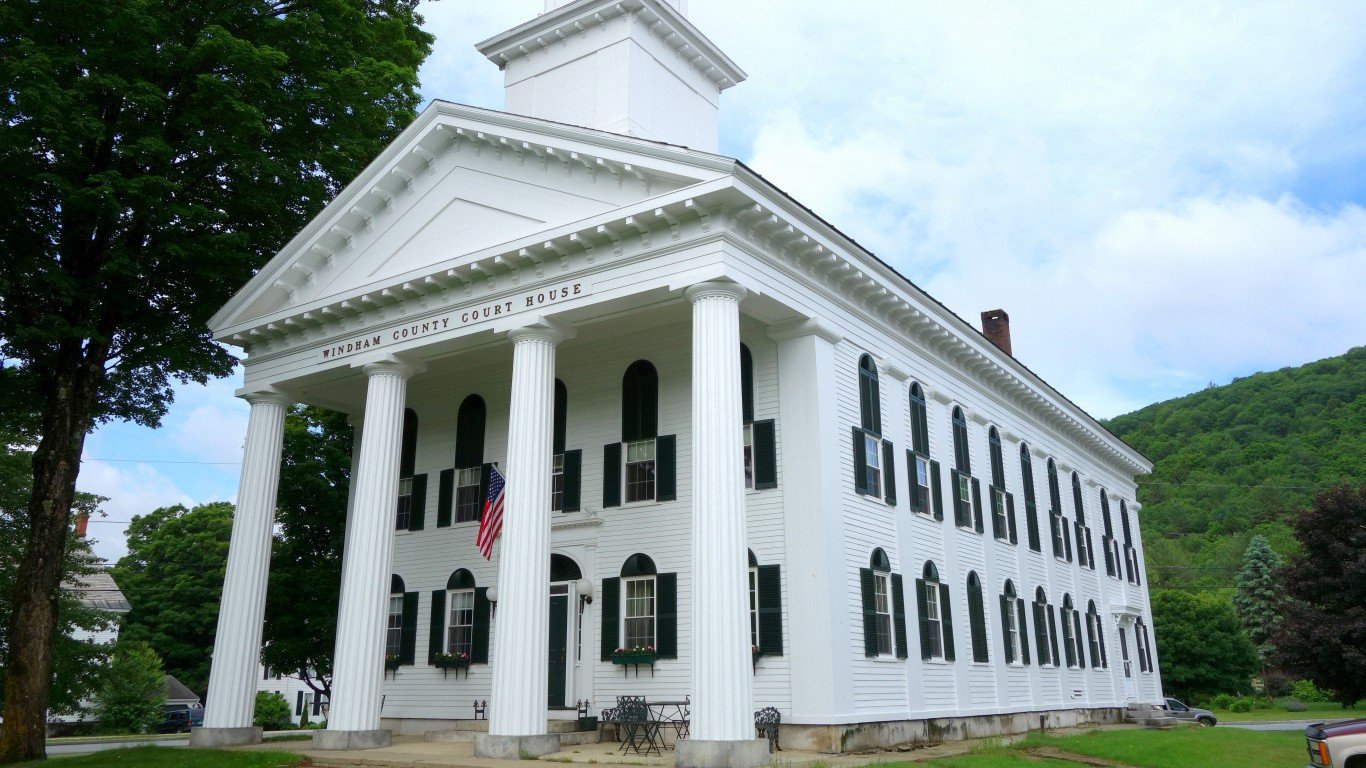
16. Vermont
> 2016 GDP: $27.45 billion (the smallest)
> 5 yr. GDP annual growth rate: 0.3% (2nd smallest growth)
> Unemployment: 3.1% (9th lowest)
> 5 yr. annual employment growth: 0.8% (7th slowest growth)
The percentage of Vermont adults who have a bachelor’s degree, at 36.9%, is seventh highest of all states. The high level of education likely helps to maintain a relatively low unemployment rate in the state, which at 3.1% in May was the seventh lowest nationwide. While Vermont’s economy is small and growing slowly, a relatively small share of residents in the state struggle with financial hardship. For example, the state’s poverty rate of 10.2% is third lowest of U.S. states.
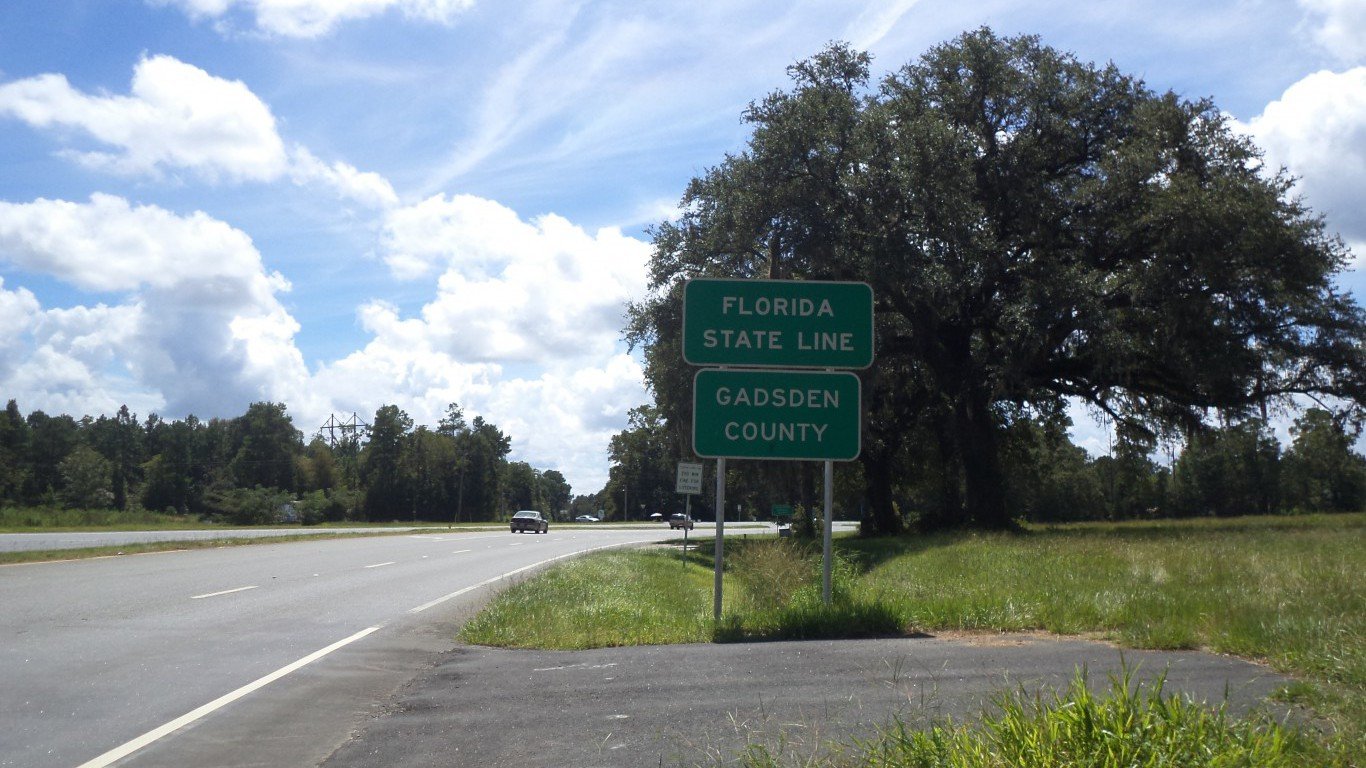
15. Florida
> 2016 GDP: $815.07 billion (4th largest)
> 5 yr. GDP annual growth rate: 2.4% (8th largest growth)
> Unemployment: 4.3% (21st highest)
> 5 yr. annual employment growth: 2.9% (2nd fastest growth)
Jobs are arguably the most critical component of any economy, and employment growth is one of the clearest indications that an economy is performing well. The compound annual job growth rate in Florida, the nation’s fourth largest state economy, was 2.9% over the five years through 2016. This was the fastest employment growth rate of any state other than Utah.
While Florida’s economic growth has outpaced the nation as a whole in recent years, many of the state’s residents still struggle with financial hardship. An estimated 15.7% of Florida residents live in poverty, a larger share than the 14.7% national poverty rate.
[in-text-ad]
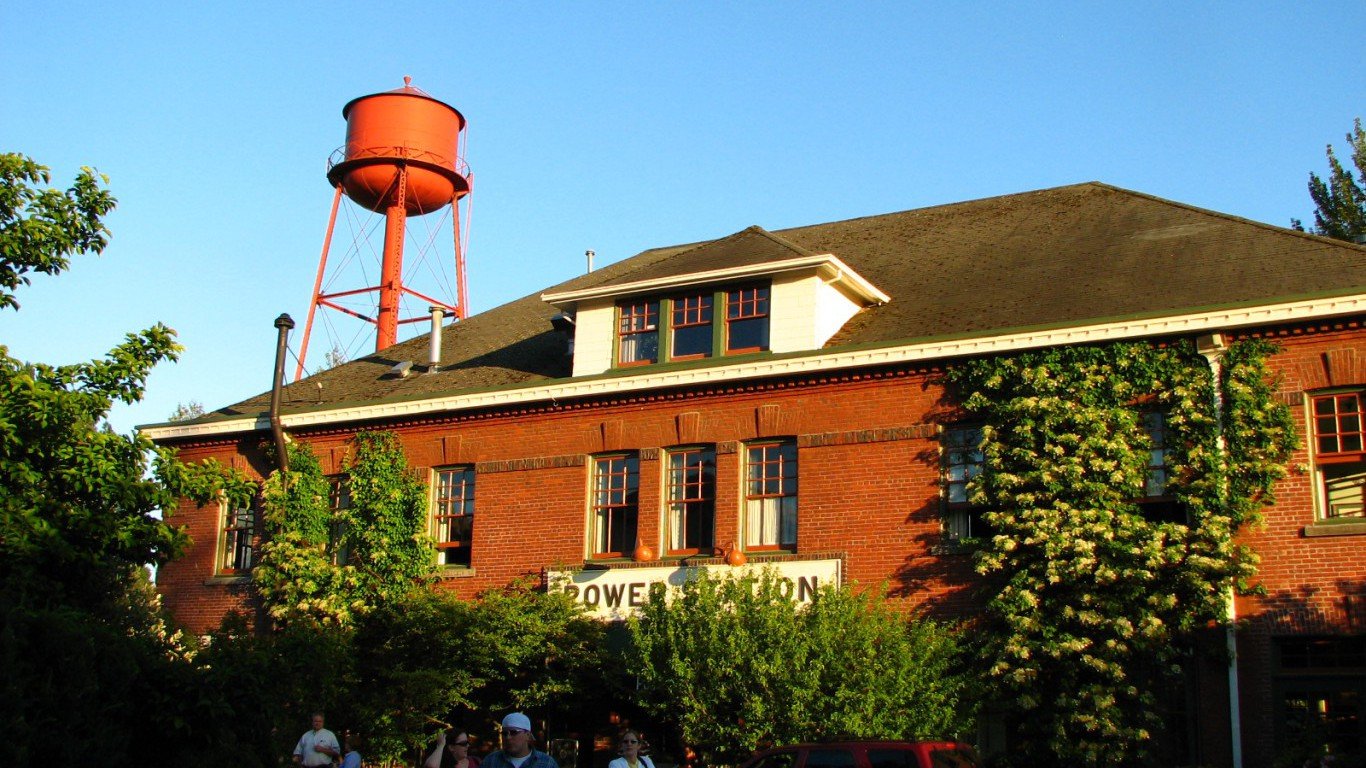
14. Oregon
> 2016 GDP: $207.06 billion (24th largest)
> 5 yr. GDP annual growth rate: 0.9% (12th smallest growth)
> Unemployment: 3.6% (15th lowest)
> 5 yr. annual employment growth: 2.6% (6th fastest growth)
While Oregon’s five-year annual economic growth rate of just 0.9% trails that of most states, the state’s employment growth over that period of 2.6% annually was sixth fastest nationwide. Additionally, looking at a longer, 10-year period, Oregon’s economic growth outpaced the nation as a whole, largely as a result of its manufacturing industry. The state’s durable goods manufacturing sector remains the largest contributor to economic growth in Oregon. While the headquarters of computer chip manufacturer Intel are in California, the company is expanding its operations in Oregon.
[recirclink id=400089]
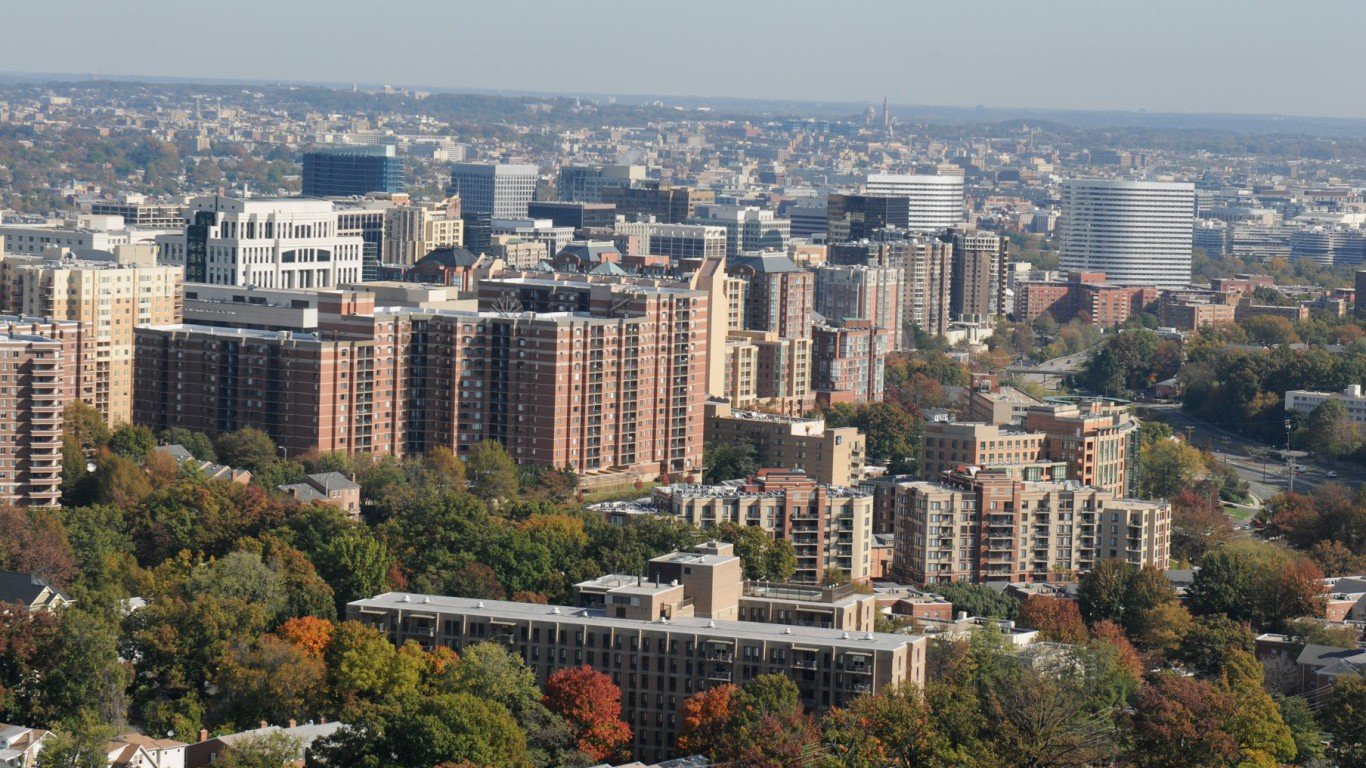
13. Virginia
> 2016 GDP: $435.19 billion (12th largest)
> 5 yr. GDP annual growth rate: 0.7% (6th smallest growth)
> Unemployment: 3.8% (18th lowest)
> 5 yr. annual employment growth: 1.1% (15th slowest growth)
An estimated 37% of adults in Virginia have a bachelor’s degree, the sixth largest share of any state. Virginia’s workforce is one of the most qualified of any state and is concentrated in high-paying, fast-growing industries such as professional services and information. Despite the state workforce’s concentration in fast-growing industries, Virginia’s economic growth has trailed the nation as a whole in recent years. The state’s annual compound GDP growth rate of just 0.7% since 2011 is less than half the 2.0% national rate. One reason for the lackluster growth is the state’s dependence on federal spending, which has declined over the past several years.

12. Nebraska
> 2016 GDP: $101.29 billion (16th smallest)
> 5 yr. GDP annual growth rate: 1.4% (tied–23rd largest growth)
> Unemployment: 2.9% (6th lowest)
> 5 yr. annual employment growth: 1.4% (24th fastest growth)
Nebraska, like many of the states in Midwest, has a low jobless rate. Just 2.9% of Nebraska’s workforce is unemployed, tied with New Hampshire and nearby South Dakota as the fourth lowest unemployment rate of any state. Relative to area incomes, Nebraska’s housing is the second most affordable in the country. Inexpensive housing is not necessarily a boon for a region’s economy, as it can point to shortages of available capital among potential homebuyers as well as other serious social and economic problems that might drive down prices. Based on the state’s low poverty and unemployment rates, as well as steady economic growth, this is likely not the case in Nebraska.
[in-text-ad-2]

11. New Jersey
> 2016 GDP: $510,586 (8th highest)
> 5 yr. GDP growth: 1.2% (23rd lowest)
> Unemployment: 4.1% (22nd highest)
> 5 yr. annual employment growth: 1.1% (16th lowest)
Many high-growth industry jobs going forward will require at least a college degree. With 37.6% of adults with at least a bachelor’s degree, New Jersey is among the best educated states in the country. Currently, about 6.5% of workers in the state are employed in STEM jobs, one of the larger shares of any state.
Both New Jersey’s unemployment and poverty rates are relatively low. Only 4.1% of the state’s workforce is out of a job, and 10.8% of the population lives below the poverty line — well below the 4.3% and 14.7% respective national figures.

10. Maryland
> 2016 GDP: $333.34 billion (15th largest)
> 5 yr. GDP annual growth rate: 1.0% (tied–16th smallest growth)
> Unemployment: 4.2% (23rd highest)
> 5 yr. annual employment growth: 1.2% (18th slowest growth)
A low poverty rate is usually a sign the economy is in good shape, as residents are more likely to find high-paying employment opportunities, and to have disposable incomes to spend on goods and services. With a poverty rate of just 9.7%, Maryland is one of just two states, along with New Hampshire, in which the poverty rate is below 10%. The U.S. poverty rate is 14.7%.
Maryland’s economy is also likely made stronger by the population’s high educational attainment — approximately 39% of the state’s adults have a bachelor’s degree, the third largest share of any state. College-educated adults are more likely to earn high incomes and are more likely to maintain steady employment during economic downturns.
[in-text-ad]

9. California
> 2016 GDP: $2.30 trillion (the largest)
> 5 yr. GDP annual growth rate: 3.2% (3rd largest growth)
> Unemployment: 4.7% (13th highest)
> 5 yr. annual employment growth: 2.8% (5th fastest growth)
Consumers, businesses, and the government in California spent trillions of dollars in 2016, helping to make the state’s economy larger than most countries and the largest of all states in the U.S. California’s economy grew at a 3.2% annual rate over the five years through 2016, the third fastest growth rate of any state economy. While jobs were also added over that time at an annual rate of 2.8%, the fifth fastest growth of any state, 4.7% of California’s labor force was unemployed as of May, one of the higher jobless rates in the country.
[recirclink id=397880]
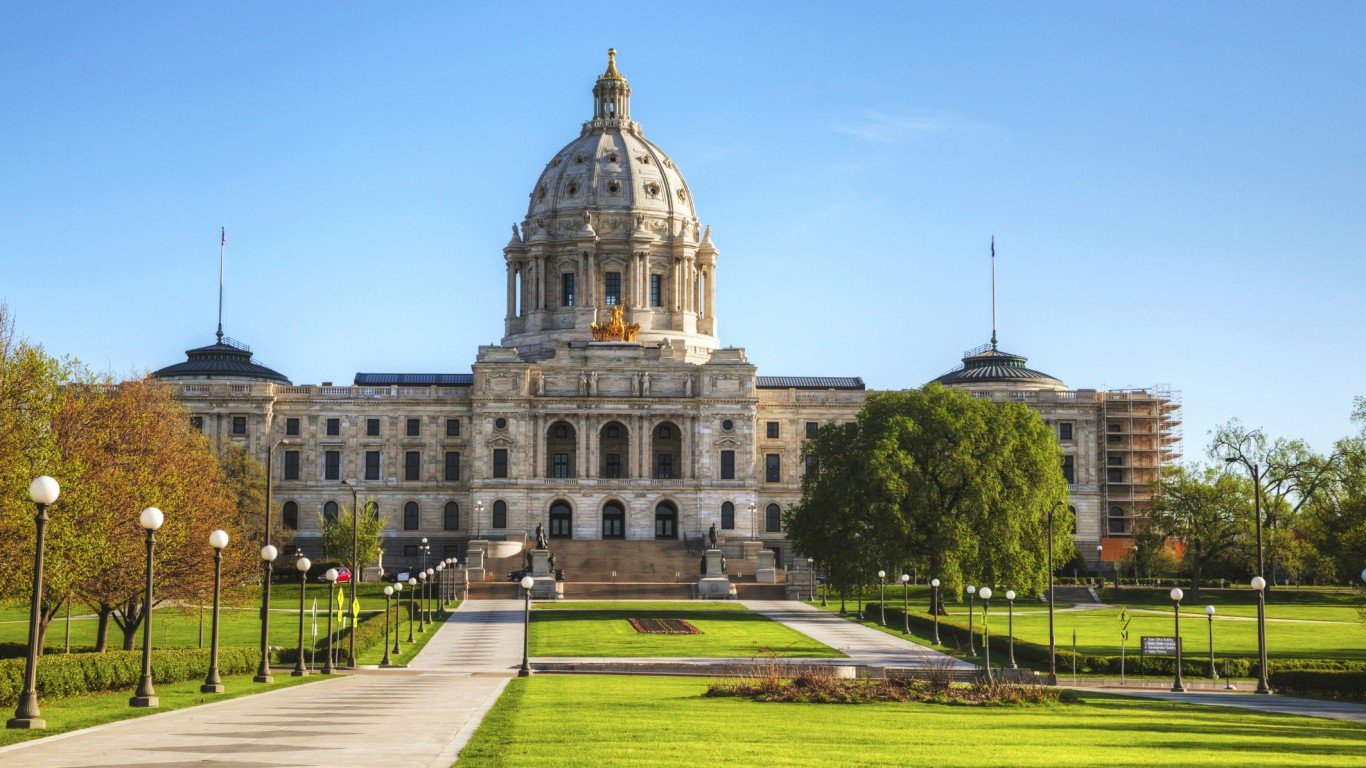
8. Minnesota
> 2016 GDP: $296.44 billion (17th largest)
> 5 yr. GDP annual growth rate: 1.7% (17th largest growth)
> Unemployment: 3.7% (17th lowest)
> 5 yr. annual employment growth: 1.6% (22nd fastest growth)
STEM jobs often drive innovation, and they are projected to grow faster than most other professions in the coming years. Such jobs typically require educated workers, and 34.7% of adults in Minnesota have at least a bachelor’s degree, compared to only 30.6% of adults nationwide. Currently, 6.9% of Minnesota’s workforce are employed in STEM jobs, one of the larger shares of any state. Growth in the state’s scientific and technical services sector was more than enough to offset economic declines in the manufacturing, construction, and resource extraction sectors in 2016, and Minnesota’s GDP grew at a pace roughly in line with the U.S. as a whole.
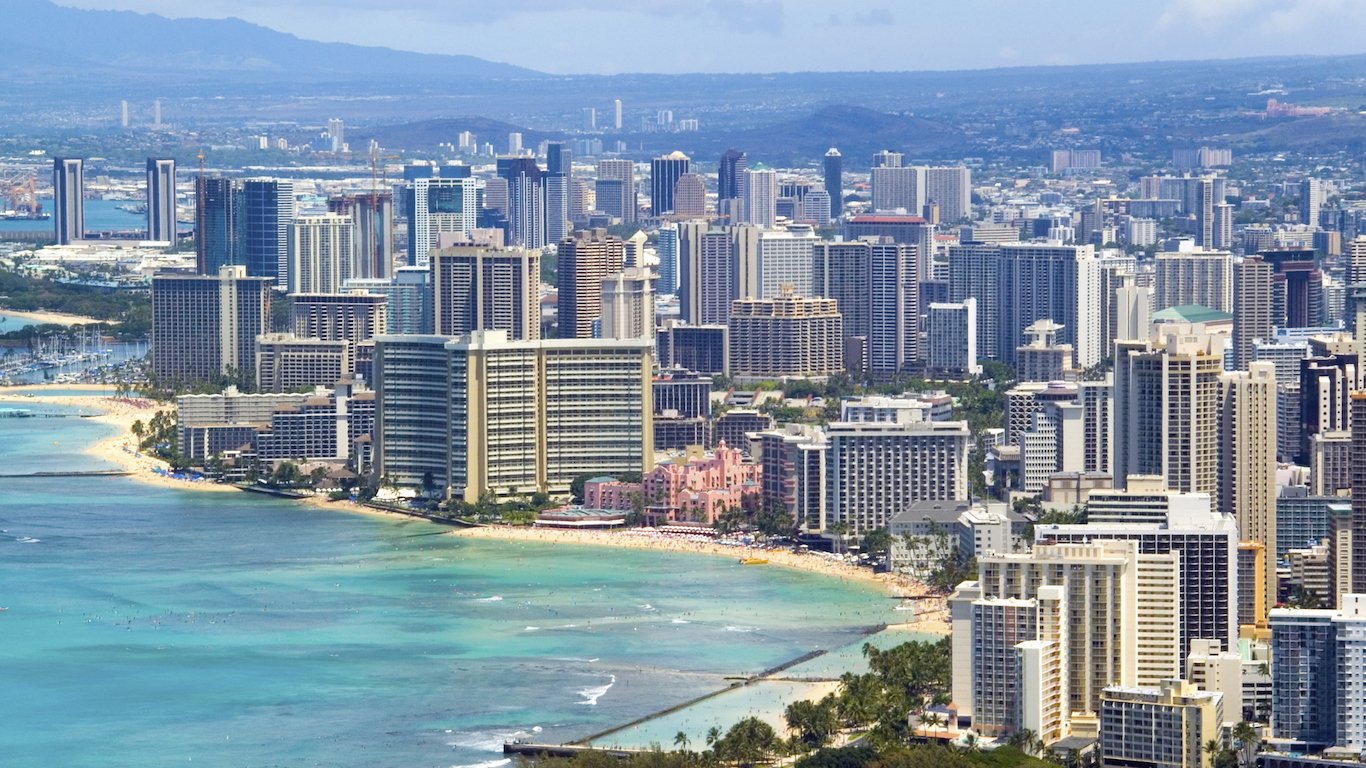
7. Hawaii
> 2016 GDP: $73.25 billion (13th smallest)
> 5 yr. GDP annual growth rate: 1.5% (tied–21st largest growth)
> Unemployment: 2.7% (3rd lowest)
> 5 yr. annual employment growth: 1.7% (18th fastest growth)
The highly desirable real estate in Hawaii is by far the most expensive in the country. The typical home in the state is valued at $566,900, compared to the national median home value of $194,500. Even with the second highest median household income of $73,486, housing in Hawaii is the least affordable in the United States.
While this means the benefits of Hawaii’s strong economy could be concentrated among a relatively small share of wealthy households, the broader population still enjoys nearly the lowest unemployment rate in the country. In May, just 2.7% of the labor force was unemployed, the third lowest unemployment rate of any state.
[in-text-ad-2]
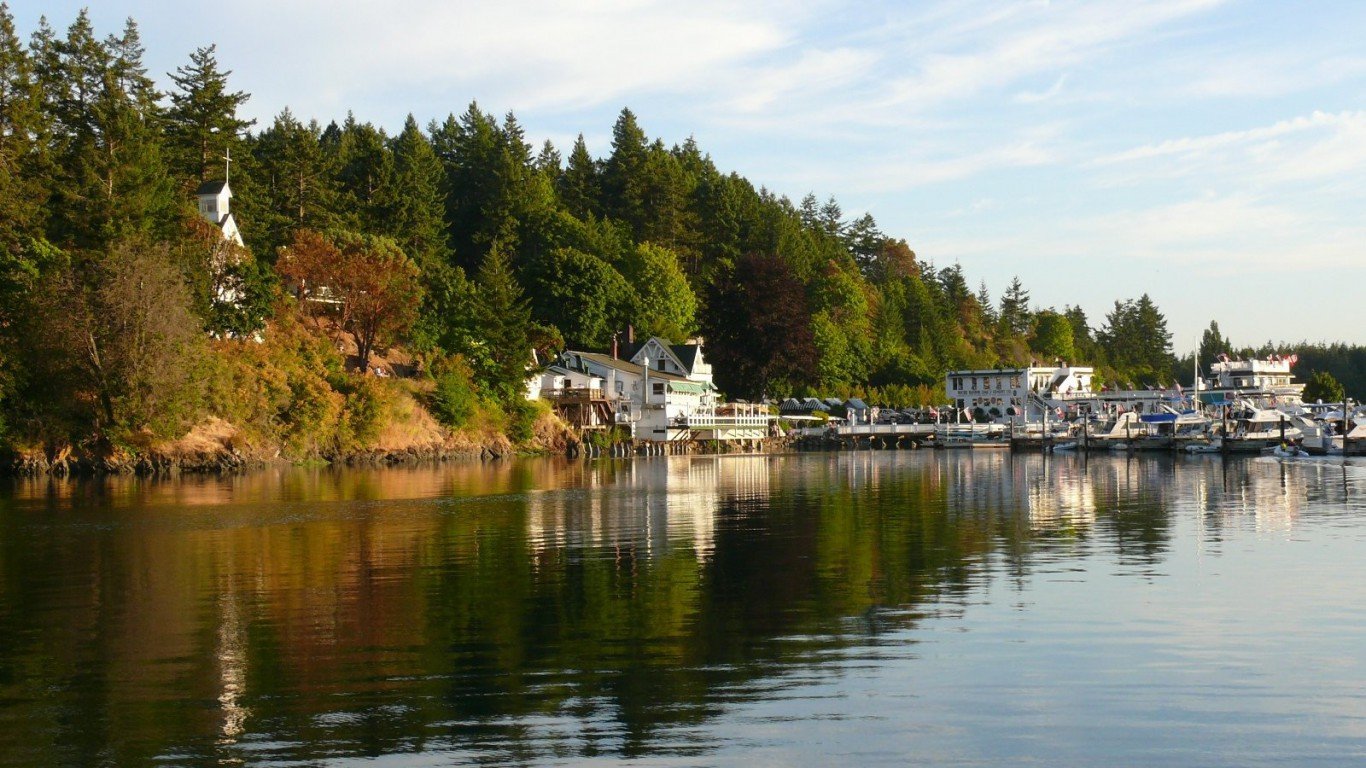
6. Washington
> 2016 GDP: $414.18 billion (14th largest)
> 5 yr. GDP annual growth rate: 2.9% (tied–6th largest growth)
> Unemployment: 4.5% (17th highest)
> 5 yr. annual employment growth: 2.5% (9th fastest growth)
Driven by the likes of manufacturing giant Boeing, retail and shipping behemoth Amazon, and software company Microsoft, Washington’s economy is one of the most productive in the country. The state’s exports, which at close to $80 billion in 2016 were valued third highest of all states, accounted for 19.2% of the state’s economy, the second largest such share of all states.
Washington’s economic growth is outpacing the nation as a whole. The state’s five-year GDP and employment growth rates, at 2.9% and 2.5% respectively, rank within the top 10 out of all states.

5. Massachusetts
> 2016 GDP: $446.48 billion (11th largest)
> 5 yr. GDP annual growth rate: 1.8% (tied–15th largest growth)
> Unemployment: 4.2% (23rd highest)
> 5 yr. annual employment growth: 1.8% (17th fastest growth)
Massachusetts is the only state in which more than 40% of adults have a bachelor’s degree. The well-educated workforce attracts high-paying, advanced industries to the state. Some 2.6% of workers in Massachusetts are employed in the information industry, 6.2% in financial activities, and 15.8% in professional services — each some of the largest shares in the country. Despite the state’s wealth and solid growth potential, outbound migration has limited economic growth in recent years. The state’s annual GDP growth rate of 1.8% between 2011 and 2016 was slightly slower than the 2.0% national rate.
[in-text-ad]
4. New Hampshire
> 2016 GDP: $69.14 billion (12th smallest)
> 5 yr. GDP annual growth rate: 1.6% (tied–18th largest growth)
> Unemployment: 2.9% (6th lowest)
> 5 yr. annual employment growth: 1.3% (22nd slowest growth)
New Hampshire does not have the annual GDP growth rate that some of the other states that rank this high do. In many other regards, however, New Hampshire’s economy is one of the healthiest. For example, the state’s 8.2% poverty rate is by far the lowest of any state and nearly half the national poverty rate. By other measures, the state’s appears to have a stable middle class, an important attribute of a healthy economy. The state ranks among the best in the country in college attainment rates, and it has the fourth lowest unemployment rate.
[recirclink id=400089]
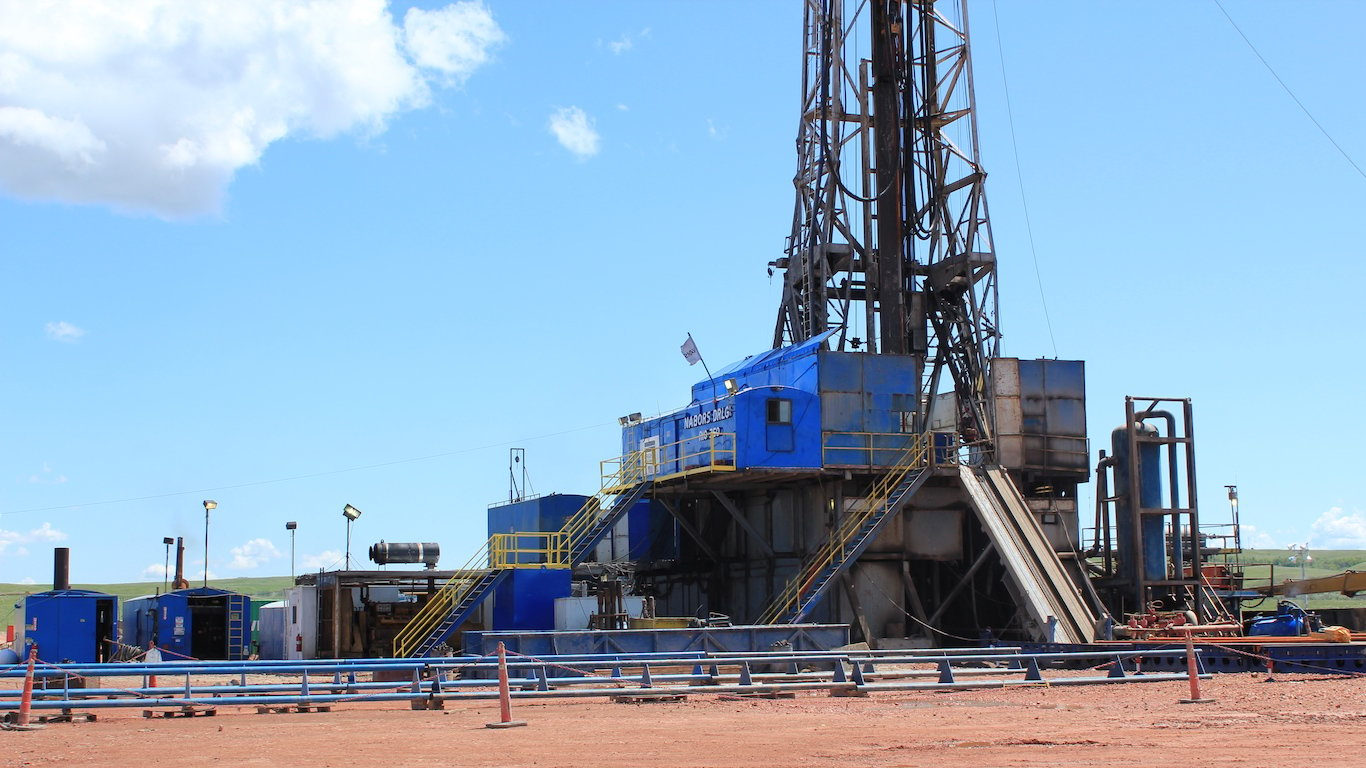
3. North Dakota
> 2016 GDP: $47.63 billion (6th smallest)
> 5 yr. GDP annual growth rate: 4.0% (the largest growth)
> Unemployment: 2.5% (2nd lowest)
> 5 yr. annual employment growth: 1.9% (16th fastest growth)
The 2006 discovery of the Parshall Oil Field in North Dakota’s Bakken formation sparked a modern day gold rush in the state and contributed to years of nation-leading economic growth that has only recently begun to slow down. Despite the state’s 6.5% GDP contraction in 2016, North Dakota’s annual economic growth rate was still double the nation’s compound annual growth rate since 2011 overall.
While just 29.1% of adults in the state have a bachelor’s degree, many of the jobs in the state’s highest-paying industry — mining — do not require a college education. Just 2.5% of North Dakota’s labor force is unemployed, the second lowest unemployment rate of any state.

2. Utah
> 2016 GDP: $136.19 billion (19th smallest)
> 5 yr. GDP annual growth rate: 2.9% (tied–6th largest growth)
> Unemployment: 3.2% (13th lowest)
> 5 yr. annual employment growth: 3.4% (the fastest growth)
Utah’s 3.4% annual employment growth rate between 2011 and 2016 was the most substantial of any state. The state’s GDP grew at an annualized rate of 2.9% over the same period, faster than all but five other states. This economic improvement in recent years has led to one of the lowest unemployment rates in the country.
Driven in large part by a 20.5% year-over-year increase in new housing starts, one of the largest such increases of any state, the construction industry contributed more to Utah’s GDP growth than any sector other than information.
[in-text-ad-2]

1. Colorado
> 2016 GDP: $292.51 billion (18th largest)
> 5 yr. GDP annual growth rate: 3.0% (tied–4th largest growth)
> Unemployment: 2.3% (the lowest)
> 5 yr. annual employment growth: 2.9% (3rd fastest growth)
Many of the jobs in the fastest growing industries in the coming years will require a college education, and in Colorado, 39.2% of adults have at least a bachelor’s degree, the second largest share of any state. Currently, some 8.4% of all workers in the state are employed in STEM jobs, one of the largest shares of any state.
Likely as a result, Colorado’s economy has expanded rapidly in recent years. The annual employment and GDP growth rates of 2.9% and 3.0%, respectively, between 2011 and 2016 are the third and fourth highest among all states. The information and scientific and technology sectors were the largest contributors to GDP growth in Colorado last year.
Detailed Findings and Methodology:
Residents of top-ranked state economies tend to be relatively affluent, while the chances of financial distress increase in poorly-ranked states. The median household income, which was not used to rank states, exceeds the national median in all 10 of the best state economies. A population with greater disposable income may be more able to purchase goods and services, which helps ensure the success of local business.
However, an affluent population is by no means synonymous with a strong economy. In fact, two of the 10 states with the worst economies — Wyoming and Alaska — have among the highest median household incomes of any state.
Among the top 10 states, only California’s poverty rate exceeds the national rate. Among the bottom 10, eight states have poverty rates that exceed the national rate.
Jobs in many high-paying industries require college education. And areas with a well-educated labor force often attract businesses in such industries. According to the Bureau of Labor Statistics, occupations that are expected to grow the most over the next several decades are also the ones that tend to require more education. In that sense, the educational attainment of a population can be a useful forward-looking factor when considering an economy.
In an email to 24/7 Wall St., BLS senior regional economist Martin Kohli wrote, “The demand for jobs with higher levels of education reflects in part the growth of the healthcare industry (driving the demand for nurses and other health care professionals) and IT spending (driving the demand for computer occupations and some management analysts).”
The presence of valuable natural resources in a state can also be a major advantage to a state’s economy, although this is not always the case. “States have different endowments of natural resources, and the extent to which these are advantageous to states can change with prices” of the resources, Kohli wrote.
Perhaps the most notable example of a state benefiting from its natural resources is North Dakota’s, where the energy sector accounts for the state’s nation-leading five-year average GDP growth rate of 4% per year.
North Dakota’s GDP contracted last year, however, demonstrating in one case that abundant natural resources are by no means a guarantee of economic growth, let alone of the other benefits expected of a healthy economy, such as steady jobs. In fact, top ranked economies with robust energy sectors seem to be the exception rather than the rule.
The natural resources and mining industries in eight of the 10 states with the worst economies employ above-average shares of the state workforce. For example, 7.9% of workers in Wyoming, the state with the sixth worst ranked economy, are employed in the sector, the highest percentage.
To identify the states with the best and worst economies, 24/7 Wall St. reviewed for each state average GDP growth rates between 2011 and 2016 from the Bureau of Economic Analysis, the poverty rate from the U.S. Census Bureau’s 2015 American Community Survey, the unemployment rate in May 2017 from the Bureau of Labor Statistics, average employment growth rates between 2011 and 2016, and the percentage of adults (age 25+) with at least a bachelor’s degree. These five metrics were scaled using the min-max normalization method, then linked to an index value by taking the geometric mean.
In addition to the components of the ranking, we considered the following state data. GDP in 2016 and industry contribution to each state economy came from the BEA. Exports as a percentage of GDP, the homeownership rate, the median household income, median home value, and uninsured rate came from the U.S. Census Bureau’s 2015 American Community Survey. The affordability ratio of median home value to median household income is a 24/7 Wall St. calculation using ACS data. Data on employment by industry, wage by industry, and the U-6 unemployment rate, or underemployment rate, came from the BLS and are annual averages for 2016.
Contact [email protected] for any questions or corrections.