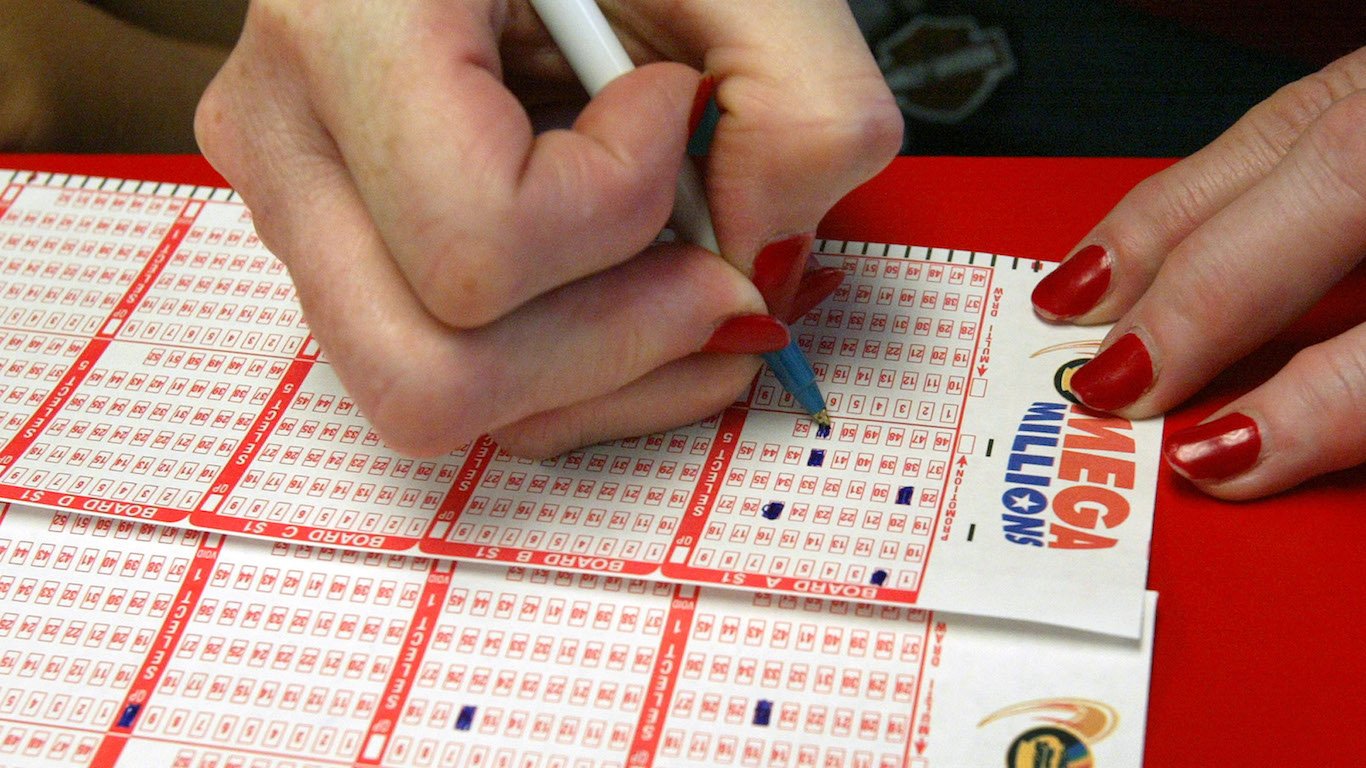
[cnxvideo id=”655412″ placement=”ros”]Lotteries are hugely popular in the United States. In 2015, American adults spent $66.8 billion on lottery tickets, amounting to about $270 per adult.
It’s not clear what drives such interest on a national scale — whether it’s because of innate optimism or economic desperation. What is clear is that the odds are against the players: in total, state lotteries pay out just over 60% of what they take in. Prizes awarded by state lotteries in 2015 totalled just under $43 billion.
Not every state participates in the lottery — 44 have a statewide system. Alabama, Alaska, Hawaii, Mississippi, Nevada, and Utah are the current exceptions, although bills have been proposed in the legislatures of several of these to change this. Wyoming recently introduced a lottery of its own, but data is not yet available for ticket sales or payouts for the state.
Click here to see the states that spend the most on lottery tickets.
Click here to read our detailed findings and methodology.

43. North Dakota
> Lottery spending per adult: $44.11
> Total lottery ticket sales: $26 million (the least)
> Adult population: 756,928
> Median household income: $60,557 (9th highest)
> Prizes won per adult: $23.86 (the lowest)
[in-text-ad]

42. Oklahoma
> Lottery spending per adult: $58.20
> Total lottery ticket sales: $172 million (7th least)
> Adult population: 3,911,338
> Median household income: $48,568 (12th lowest)
> Prizes won per adult: $29.77 (2nd lowest)
[recirclink id=406733]

41. Montana
> Lottery spending per adult: $68.74
> Total lottery ticket sales: $55 million (2nd least)
> Adult population: 1,032,949
> Median household income: $49,509 (23rd lowest)
> Prizes won per adult: $36.26 (3rd lowest)

40. New Mexico
> Lottery spending per adult: $86.46
> Total lottery ticket sales: $137 million (4th least)
> Adult population: 2,085,109
> Median household income: $45,382 (16th highest)
> Prizes won per adult: $47.70 (5th lowest)
[in-text-ad-2]

39. Nebraska
> Lottery spending per adult: $105.01
> Total lottery ticket sales: $150 million (6th least)
> Adult population: 1,896,190
> Median household income: $54,996 (7th lowest)
> Prizes won per adult: $66.41 (7th lowest)

38. Kansas
> Lottery spending per adult: $105.48
> Total lottery ticket sales: $231 million (9th least)
> Adult population: 2,911,641
> Median household income: $53,906 (24th highest)
> Prizes won per adult: $63.28 (6th lowest)
[in-text-ad]

37. Washington
> Lottery spending per adult: $118.56
> Total lottery ticket sales: $659 million (21st least)
> Adult population: 7,170,351
> Median household income: $64,129 (7th highest)
> Prizes won per adult: $77.90 (12th lowest)
[recirclink id=412843]

36. Colorado
> Lottery spending per adult: $118.58
> Total lottery ticket sales: $498 million (16th least)
> Adult population: 5,456,574
> Median household income: $63,909 (15th lowest)
> Prizes won per adult: $78.90 (13th lowest)
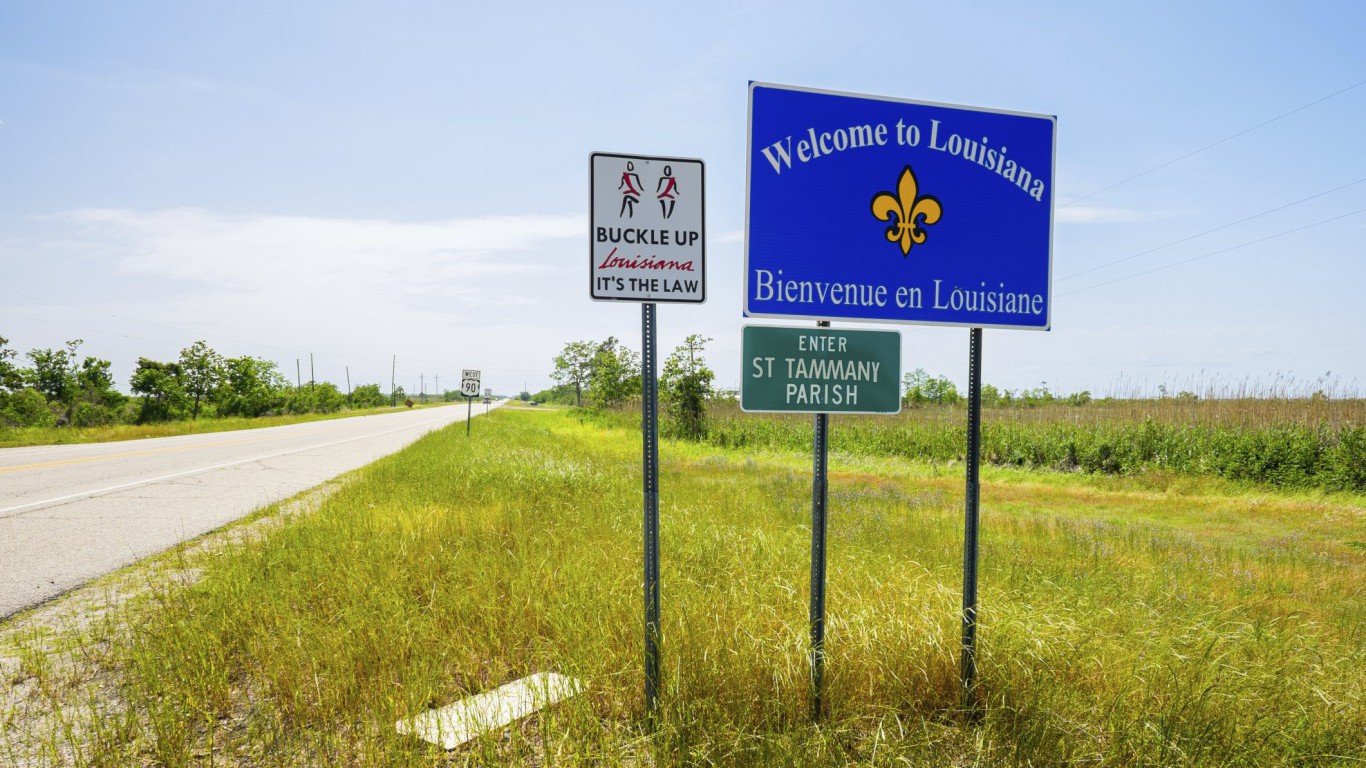
35. Louisiana
> Lottery spending per adult: $120.18
> Total lottery ticket sales: $427 million (15th least)
> Adult population: 4,670,724
> Median household income: $45,727 (14th lowest)
> Prizes won per adult: $67.30 (9th lowest)
[in-text-ad-2]

34. Minnesota
> Lottery spending per adult: $122.24
> Total lottery ticket sales: $514 million (17th least)
> Adult population: 5,489,594
> Median household income: $63,488 (5th lowest)
> Prizes won per adult: $83.63 (15th lowest)
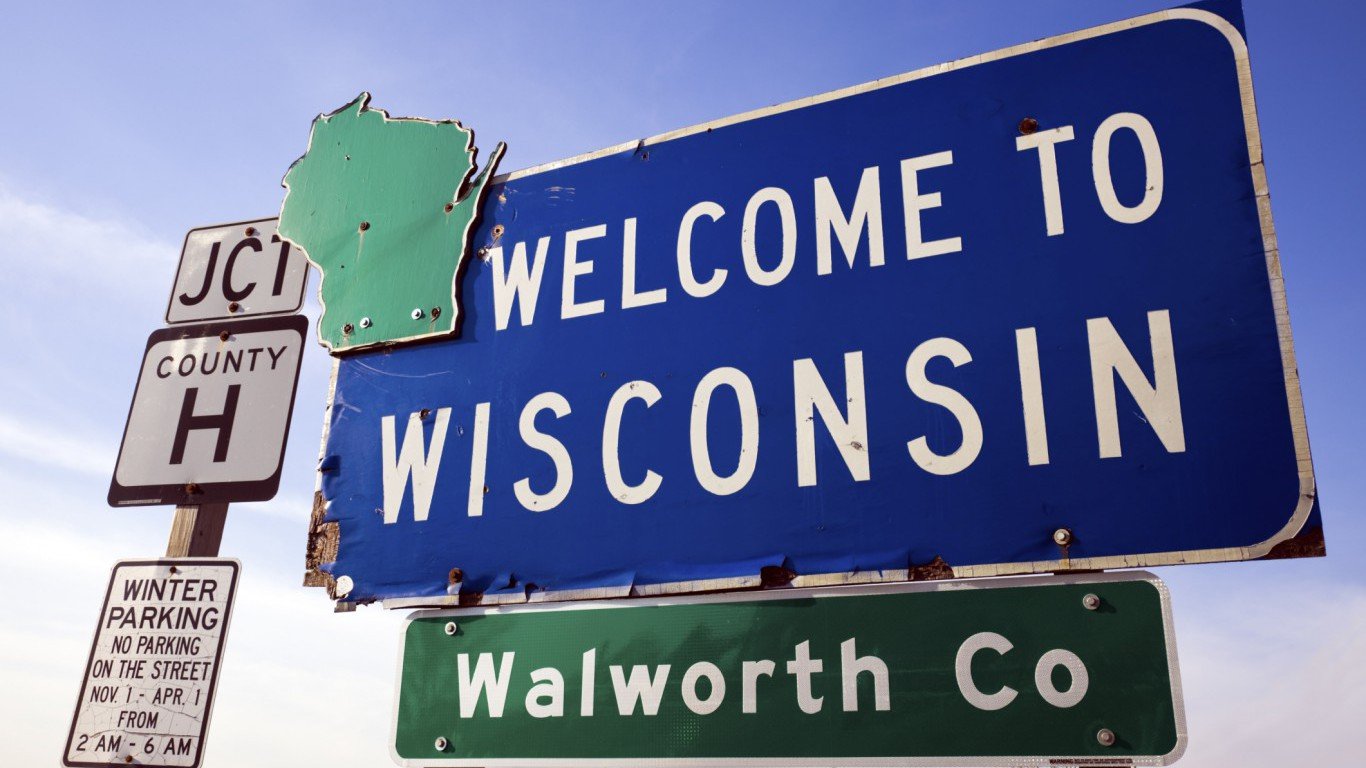
33. Wisconsin
> Lottery spending per adult: $128.31
> Total lottery ticket sales: $575 million (19th least)
> Adult population: 5,771,337
> Median household income: $55,638 (12th highest)
> Prizes won per adult: $76.46 (11th lowest)
[in-text-ad]

32. Arizona
> Lottery spending per adult: $134.16
> Total lottery ticket sales: $699 million (22nd least)
> Adult population: 6,828,065
> Median household income: $51,492 (3rd lowest)
> Prizes won per adult: $93.41 (16th lowest)
[recirclink id=405297]

31. Iowa
> Lottery spending per adult: $135.54
> Total lottery ticket sales: $325 million (12th least)
> Adult population: 3,123,899
> Median household income: $54,736 (25th highest)
> Prizes won per adult: $82.17 (14th lowest)

30. Idaho
> Lottery spending per adult: $158.49
> Total lottery ticket sales: $194 million (8th least)
> Adult population: 1,654,930
> Median household income: $48,275 (24th lowest)
> Prizes won per adult: $111.83 (17th lowest)
[in-text-ad-2]

29. Arkansas
> Lottery spending per adult: $169.61
> Total lottery ticket sales: $385 million (13th least)
> Adult population: 2,978,204
> Median household income: $41,995 (6th lowest)
> Prizes won per adult: $123.42 (19th lowest)

28. California
> Lottery spending per adult: $184.01
> Total lottery ticket sales: $5.53 billion (2nd most)
> Adult population: 39,144,818
> Median household income: $64,500 (17th lowest)
> Prizes won per adult: $116.63 (18th lowest)
[in-text-ad]

27. Indiana
> Lottery spending per adult: $192.66
> Total lottery ticket sales: $971 million (19th most)
> Adult population: 6,619,680
> Median household income: $50,532 (25th lowest)
> Prizes won per adult: $133.20 (20th lowest)
[recirclink id=412843]

26. Vermont
> Lottery spending per adult: $207.30
> Total lottery ticket sales: $105 million (3rd least)
> Adult population: 626,042
> Median household income: $56,990 (22nd highest)
> Prizes won per adult: $143.74 (22nd lowest)

25. Texas
> Lottery spending per adult: $211.18
> Total lottery ticket sales: $4.28 billion (5th most)
> Adult population: 27,469,114
> Median household income: $55,653 (16th lowest)
> Prizes won per adult: $141.00 (21st lowest)
[in-text-ad-2]

24. Maine
> Lottery spending per adult: $219.89
> Total lottery ticket sales: $236 million (10th least)
> Adult population: 1,329,328
> Median household income: $51,494 (11th lowest)
> Prizes won per adult: $155.17 (19th highest)

23. South Dakota
> Lottery spending per adult: $227.94
> Total lottery ticket sales: $148 million (5th least)
> Adult population: 858,469
> Median household income: $53,017 (2nd lowest)
> Prizes won per adult: $45.83 (4th lowest)
[in-text-ad]

22. Missouri
> Lottery spending per adult: $236.01
> Total lottery ticket sales: $1.11 billion (17th most)
> Adult population: 6,083,672
> Median household income: $50,238 (11th highest)
> Prizes won per adult: $161.05 (17th highest)
[recirclink id=404837]

21. North Carolina
> Lottery spending per adult: $236.61
> Total lottery ticket sales: $1.83 billion (13th most)
> Adult population: 10,042,802
> Median household income: $47,830 (10th highest)
> Prizes won per adult: $158.81 (18th highest)

20. Kentucky
> Lottery spending per adult: $243.28
> Total lottery ticket sales: $831 million (21st most)
> Adult population: 4,425,092
> Median household income: $45,215 (23rd highest)
> Prizes won per adult: $162.84 (16th highest)
[in-text-ad-2]

19. New Hampshire
> Lottery spending per adult: $263.44
> Total lottery ticket sales: $281 million (11th least)
> Adult population: 1,330,608
> Median household income: $70,303 (18th lowest)
> Prizes won per adult: $165.31 (15th highest)

18. Virginia
> Lottery spending per adult: $267.13
> Total lottery ticket sales: $1.74 billion (14th most)
> Adult population: 8,382,993
> Median household income: $66,262 (13th lowest)
> Prizes won per adult: $171.43 (14th highest)
[in-text-ad]

17. Tennessee
> Lottery spending per adult: $269.93
> Total lottery ticket sales: $1.38 billion (15th most)
> Adult population: 6,600,299
> Median household income: $47,275 (20th lowest)
> Prizes won per adult: $151.56 (20th highest)
[recirclink id=412843]

16. Oregon
> Lottery spending per adult: $284.75
> Total lottery ticket sales: $902 million (20th most)
> Adult population: 4,028,977
> Median household income: $54,148 (9th lowest)
> Prizes won per adult: $66.77 (8th lowest)

15. Illinois
> Lottery spending per adult: $286.58
> Total lottery ticket sales: $2.84 billion (8th most)
> Adult population: 12,859,995
> Median household income: $59,588 (18th highest)
> Prizes won per adult: $183.54 (12th highest)
[in-text-ad-2]

14. Ohio
> Lottery spending per adult: $301.80
> Total lottery ticket sales: $2.71 billion (10th most)
> Adult population: 11,613,423
> Median household income: $51,075 (20th highest)
> Prizes won per adult: $208.62 (11th highest)

13. Florida
> Lottery spending per adult: $326.26
> Total lottery ticket sales: $5.28 billion (3rd most)
> Adult population: 20,271,272
> Median household income: $49,426 (14th highest)
> Prizes won per adult: $224.27 (9th highest)
[in-text-ad]

12. Michigan
> Lottery spending per adult: $327.60
> Total lottery ticket sales: $2.53 billion (11th most)
> Adult population: 9,922,576
> Median household income: $51,084 (10th lowest)
> Prizes won per adult: $220.11 (10th highest)
[recirclink id=381356]
11. South Carolina
> Lottery spending per adult: $342.02
> Total lottery ticket sales: $1.30 billion (16th most)
> Adult population: 4,896,146
> Median household income: $47,238 (21st lowest)
> Prizes won per adult: $242.61 (6th highest)

10. Pennsylvania
> Lottery spending per adult: $350.66
> Total lottery ticket sales: $3.55 billion (7th most)
> Adult population: 12,802,503
> Median household income: $55,702 (8th highest)
> Prizes won per adult: $238.45 (7th highest)
[in-text-ad-2]

9. Connecticut
> Lottery spending per adult: $382.06
> Total lottery ticket sales: $1.08 billion (18th most)
> Adult population: 3,590,886
> Median household income: $71,346 (21st highest)
> Prizes won per adult: $250.43 (5th highest)

8. New Jersey
> Lottery spending per adult: $406.74
> Total lottery ticket sales: $2.83 billion (9th most)
> Adult population: 8,958,013
> Median household income: $72,222 (15th highest)
> Prizes won per adult: $269.14 (4th highest)
[in-text-ad]

7. West Virginia
> Lottery spending per adult: $449.92
> Total lottery ticket sales: $659 million (20th least)
> Adult population: 1,844,128
> Median household income: $42,019 (19th highest)
> Prizes won per adult: $72.72 (10th lowest)
[recirclink id=412843]

6. Maryland
> Lottery spending per adult: $457.31
> Total lottery ticket sales: $2.13 billion (12th most)
> Adult population: 6,006,401
> Median household income: $75,847 (19th lowest)
> Prizes won per adult: $225.59 (8th highest)

5. Georgia
> Lottery spending per adult: $476.39
> Total lottery ticket sales: $3.67 billion (6th most)
> Adult population: 10,214,860
> Median household income: $51,244 (the highest)
> Prizes won per adult: $327.90 (2nd highest)
[in-text-ad-2]

4. New York
> Lottery spending per adult: $505.40
> Total lottery ticket sales: $7.87 billion (the most)
> Adult population: 19,795,791
> Median household income: $60,850 (8th lowest)
> Prizes won per adult: $282.22 (3rd highest)

3. Delaware
> Lottery spending per adult: $540.24
> Total lottery ticket sales: $401 million (14th least)
> Adult population: 945,934
> Median household income: $61,255 (5th highest)
> Prizes won per adult: $146.93 (21st highest)
[in-text-ad]
2. Rhode Island
> Lottery spending per adult: $643.07
> Total lottery ticket sales: $543 million (18th least)
> Adult population: 1,056,298
> Median household income: $58,073 (4th highest)
> Prizes won per adult: $177.80 (13th highest)
[recirclink id=198411]
![]()
1. Massachusetts
> Lottery spending per adult: $925.54
> Total lottery ticket sales: $5.01 billion (4th most)
> Adult population: 6,794,422
> Median household income: $70,628 (6th highest)
> Prizes won per adult: $673.28 (the highest)
Detailed Findings and Methodology:
While many consider the lottery to be a game tailored to less educated, lower income individuals, the four states that spent the most money on lottery tickets in 2015 fly in the face of this assumption. In all four states, the adult population that has earned a college degree exceeds the national percentage. In fact, Massachusetts — the state with the highest lottery spending per adult — also has the highest level of educational attainment. A nation-leading 41.5% of Massachusetts adults have earned at least a bachelor’s degree, well above the national average of just 30.6%.
It may be that states with higher education levels have more residents who can afford to play the games. Americans with a college education are much more likely to earn higher wages and, as a result, have more disposable income to spend on lottery tickets. The typical household in Massachusetts has an annual income of over $70,000, almost $15,000 more than the national median household income.
Generally, the states in which people spend more on the lottery tend to pay out the most in total prizes. However, there are a handful of states with high ticket sales and relatively low total prize payouts. West Virginia is one of these states: In 2015 the average adult spent roughly $450 on lottery tickets but won only about $72. Rhode Island folk spent $640 on tickets on average but earned less than $180 in prizes.
Where the money from ticket revenue goes depends on the state. Proceeds can fund state-run programs such as education, veteran’s health, and parks, just to name a few. Education is often one of the primary beneficiaries: As of 2016, 15 states contribute all lottery proceeds to education.
To identify the states that spend the most money on lottery tickets, 24/7 Wall St. retrieved data from the American Community Survey’s 2015 Annual Survey of State Finances, which provides lottery ticket sales and the total amounts paid out in prizes. To determine total state spending and prizes paid per adult, we used 18 and over population figures from the Census’ Population and Housing Units Estimates. From the Census Bureau’s 2015 American Community Survey, we obtained additional demographic information, including median household income, and the share of the adult population with a bachelor’s degree. While 44 states currently host a lottery, data on one of these states — Wyoming — is not yet available, and so national totals refer to 43 states.
Contact [email protected] for any questions or corrections.