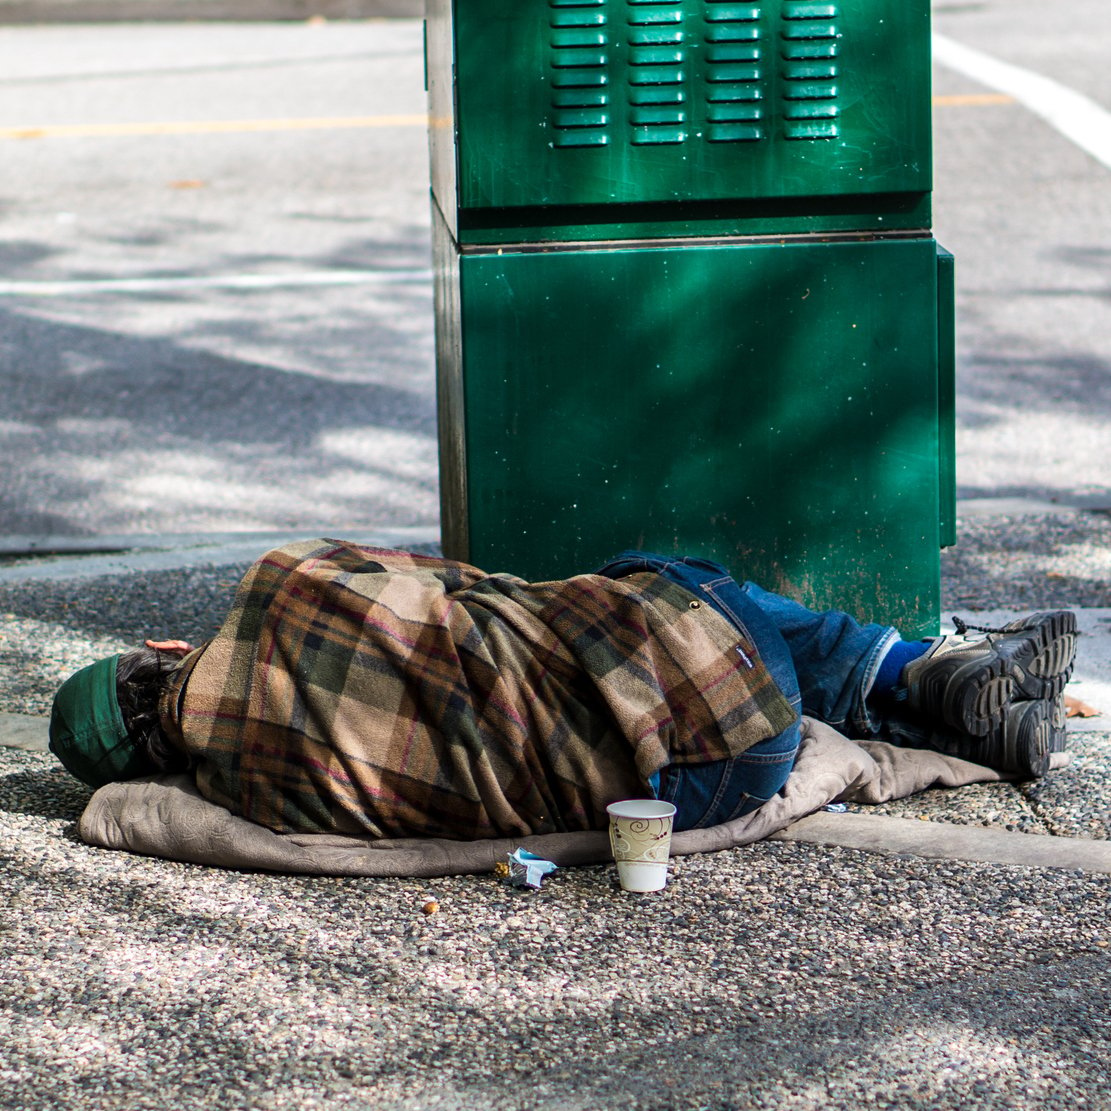
The U.S. Department of Health and Human Services set the poverty line for 2017 at an annual income of $12,060 for individuals and $24,600 for families of four. Despite numerous policies aimed at reducing or eliminating poverty — including President Lyndon Johnson’s war on poverty over half a century ago — an estimated 45.2 million Americans currently live in poverty.
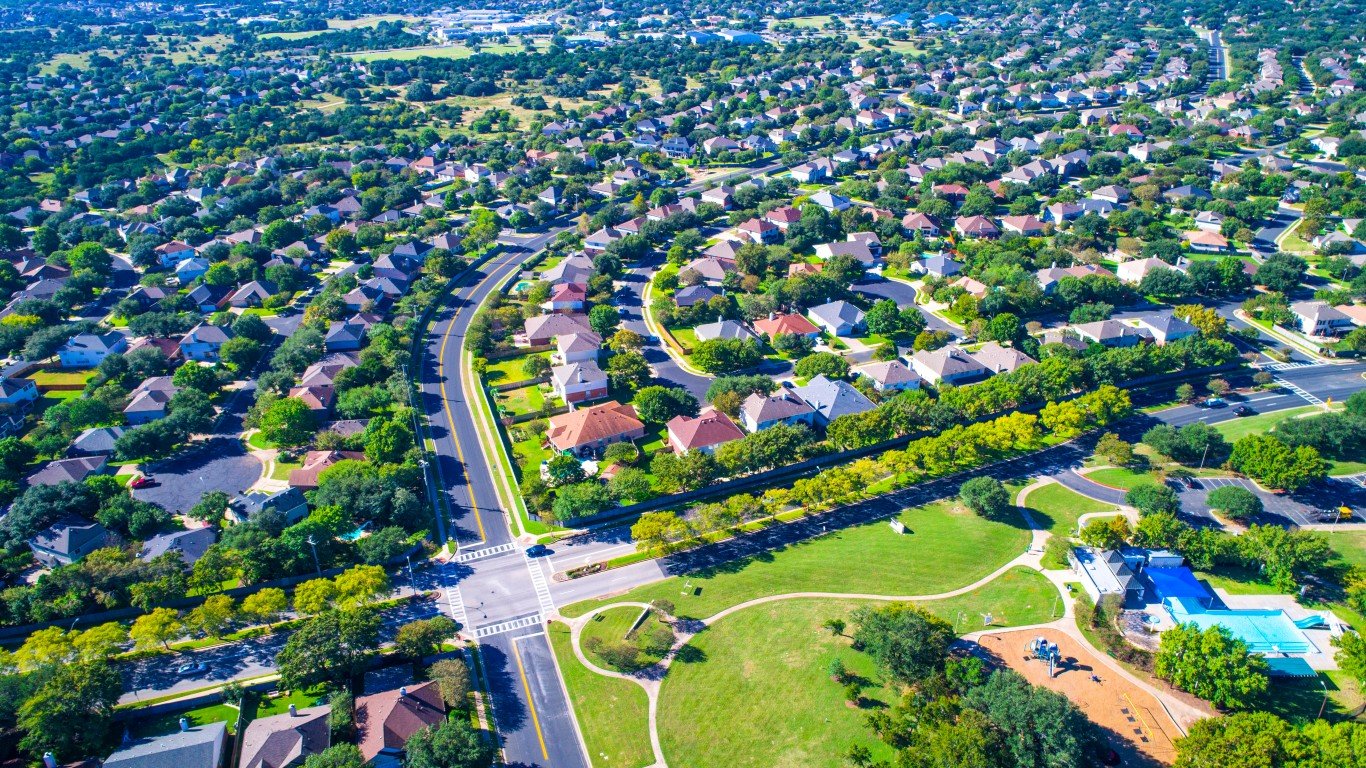
The nationwide poverty rate is 14%, but serious financial hardship is much rarer in some parts of the United States. In dozens of major metropolitan areas, fewer than 1 in 10 residents live below the poverty line. Cities with relatively low poverty rates often share other economic characteristics as well.
Based on metro area-level poverty data from the U.S. Census Bureau, these are the 49 cities where less than 10% of the population lives in poverty.
The unemployed are at greater risk of living in poverty than those with jobs that provide steady income. Cities with low poverty rates indeed tend to have relatively strong economies with low unemployment. In 40 of the 49 metro areas on this list, the 2016 unemployment rate was lower than the nationwide jobless rate of 4.9%.
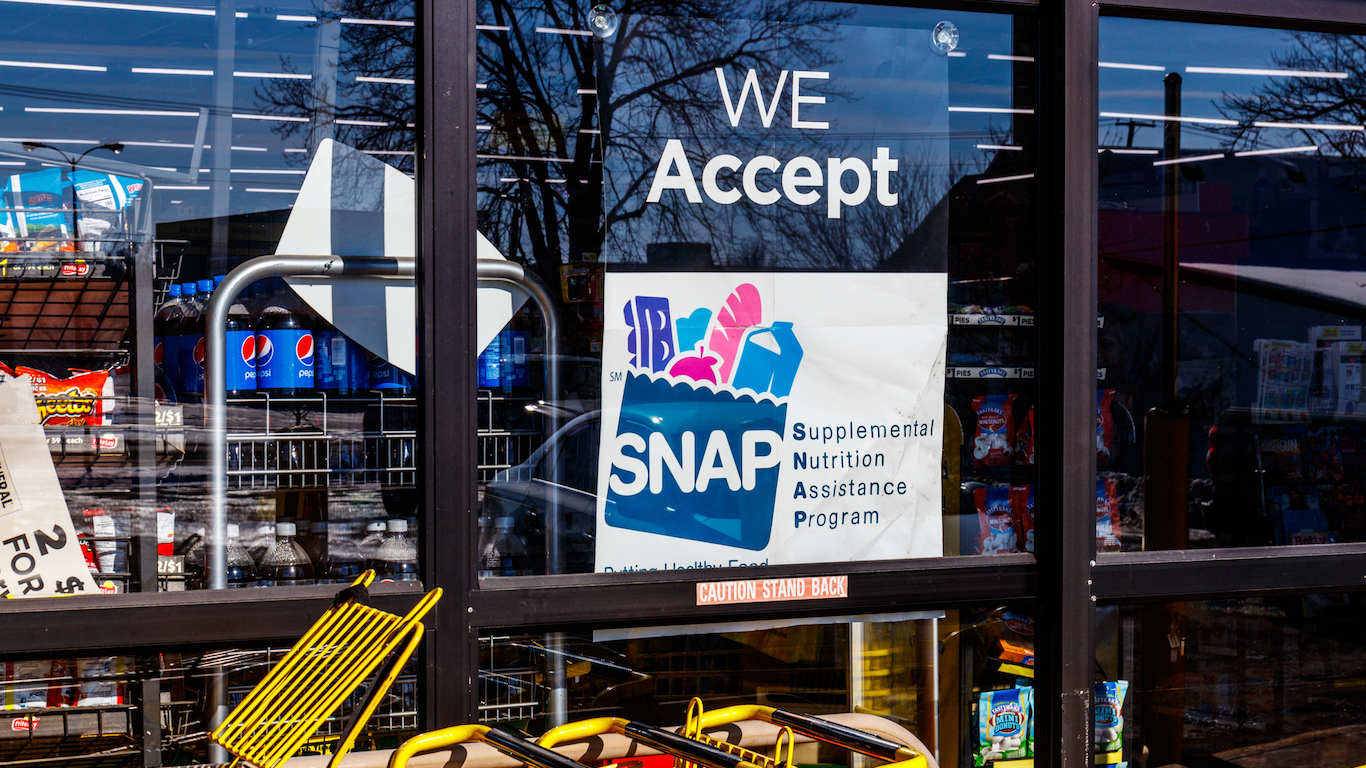
Cities with lower rates of serious financial hardship are also home to smaller shares of residents who depend on government assistance. Nationwide, 12.4% of the population receives SNAP benefits — formerly known as the Food Stamp Program — which are intended to help low-income Americans afford groceries. In only three cities on this list, a higher share of residents receive SNAP benefits than the nationwide share.
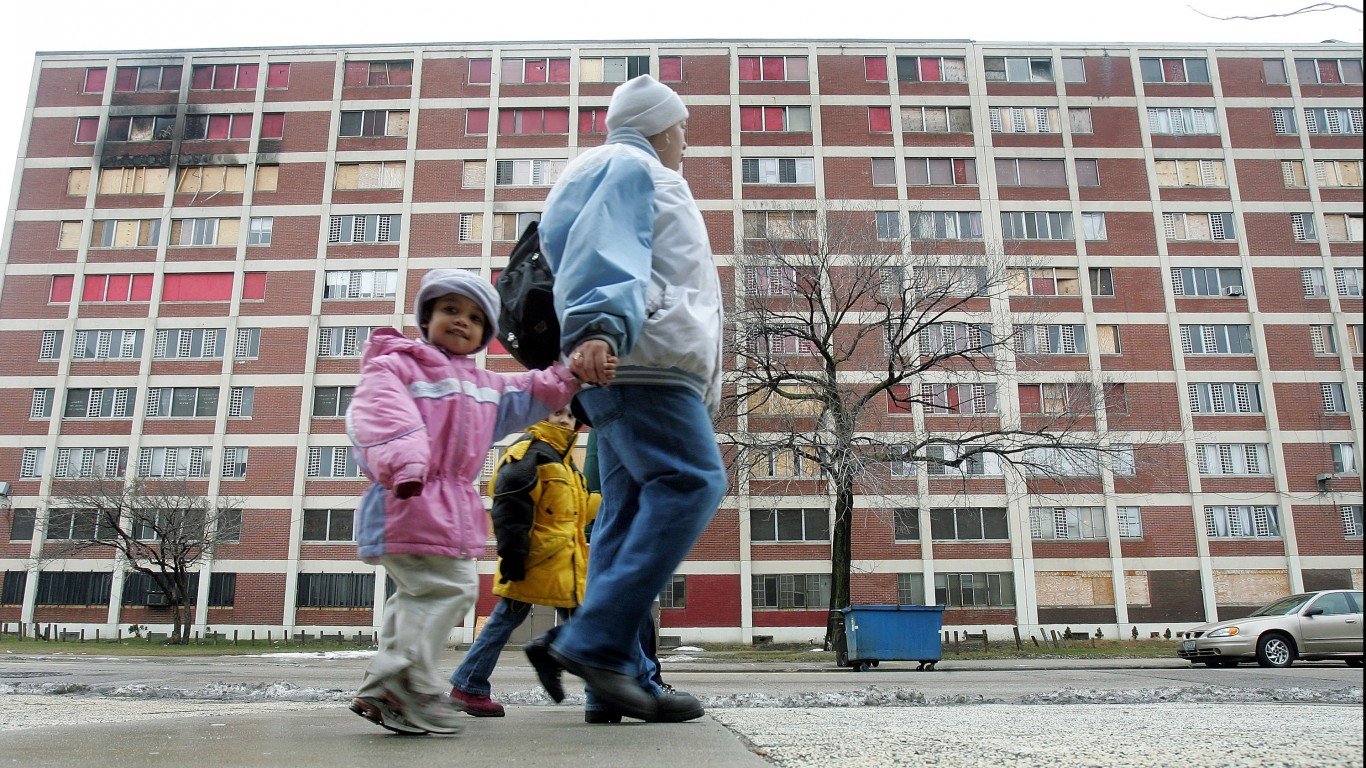
Not only do relatively fewer people live in poverty in the cities on this list, but also poverty levels are less severe and relatively fewer household live in extreme poverty. Nationwide, some 6.7% of households earn $10,000 or less a year — well below the $12,060 poverty line for an individual. In each city on this list, a smaller share of households earn $10,000 or less than is typical nationwide. In six metro areas on this list, the share of households earning $10,000 or less a year is less than half the comparable national share.
Certain U.S. regions appear to be more resistant to widespread poverty than others. For example, over half of all the metro areas on this list are either in the Midwest or the Northeast. Meanwhile, only four metro areas on this list are located in the South.
To identify the cities with the lowest poverty rates, 24/7 Wall St. reviewed the share of all residents living on poverty level income in 382 U.S. metro areas. Only those areas with poverty rates of less than 10% were included in this list. Poverty rates, as well as median household income, SNAP recipiency, and the share of households with annual incomes below $10,000 all came from from the U.S. Census Bureau’s 2016 American Community Survey. Annual unemployment figures are for 2016 and came from the Bureau of Labor Statistics.
Click here to see the cities with the lowest poverty rates.

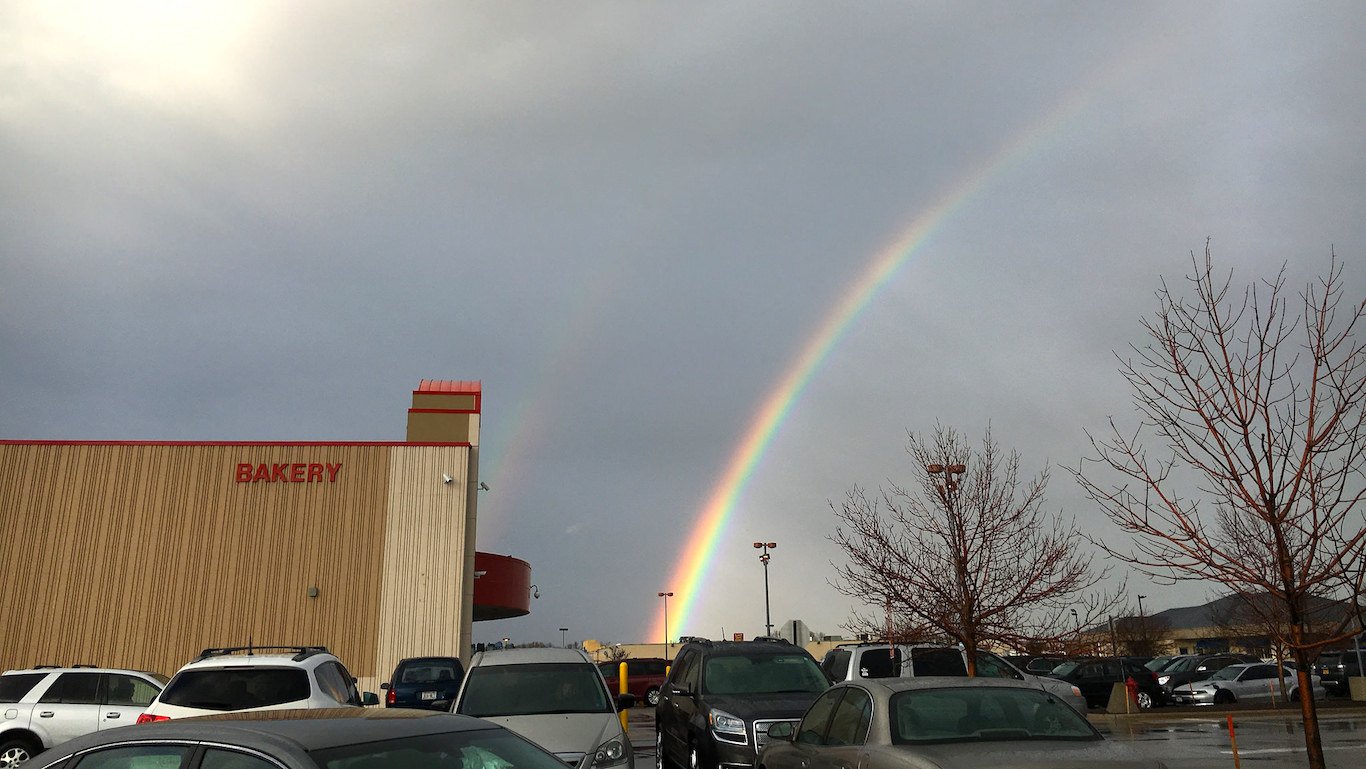
49. York-Hanover, PA
> Poverty rate: 9.9% (tied)
> 2016 unemployment rate: 4.7%
> Households receiving SNAP benefits: 12.0%
> Households with income under $10,000: 4.3%
> Median household income: $62,462
[in-text-ad]

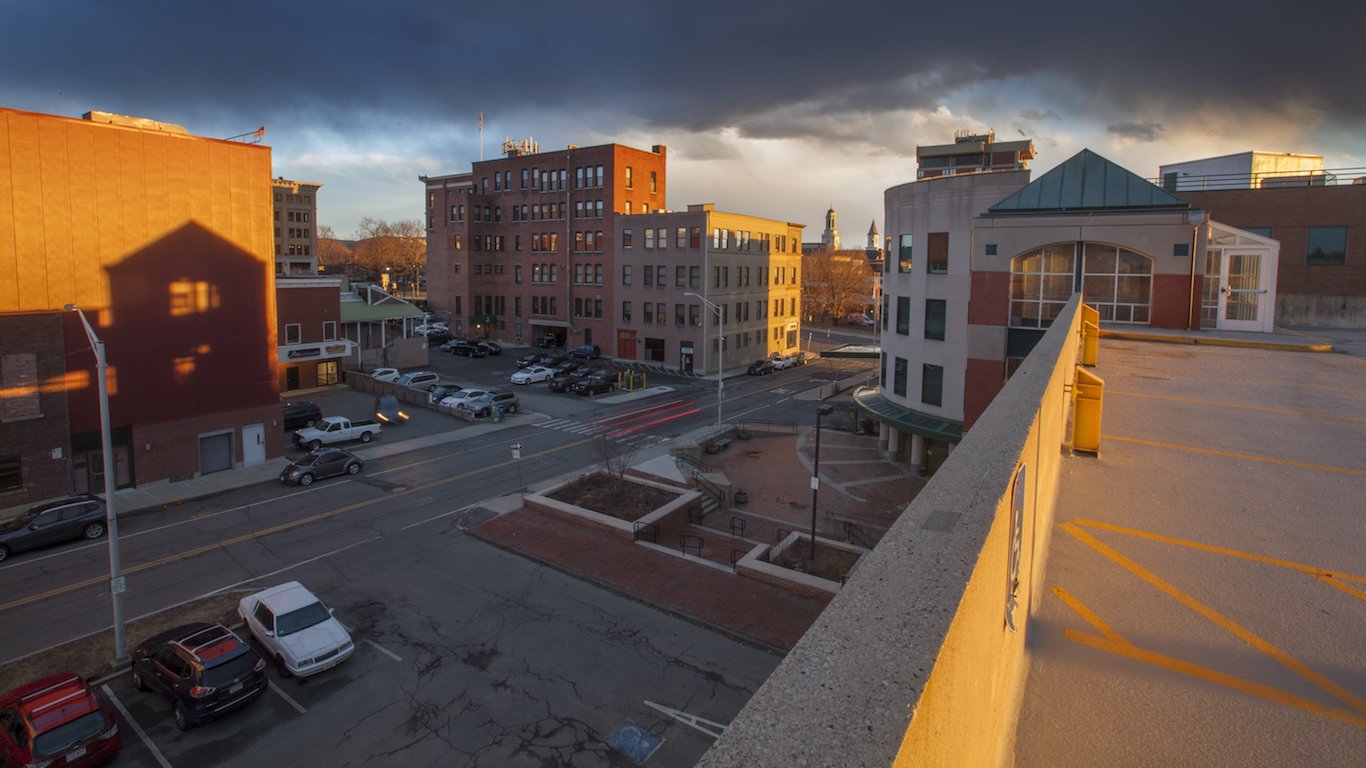
48. Worcester, MA-CT
> Poverty rate: 9.9% (tied)
> 2016 unemployment rate: 4.0%
> Households receiving SNAP benefits: 12.6%
> Households with income under $10,000: 5.4%
> Median household income: $67,763
[recirclink id=405812]
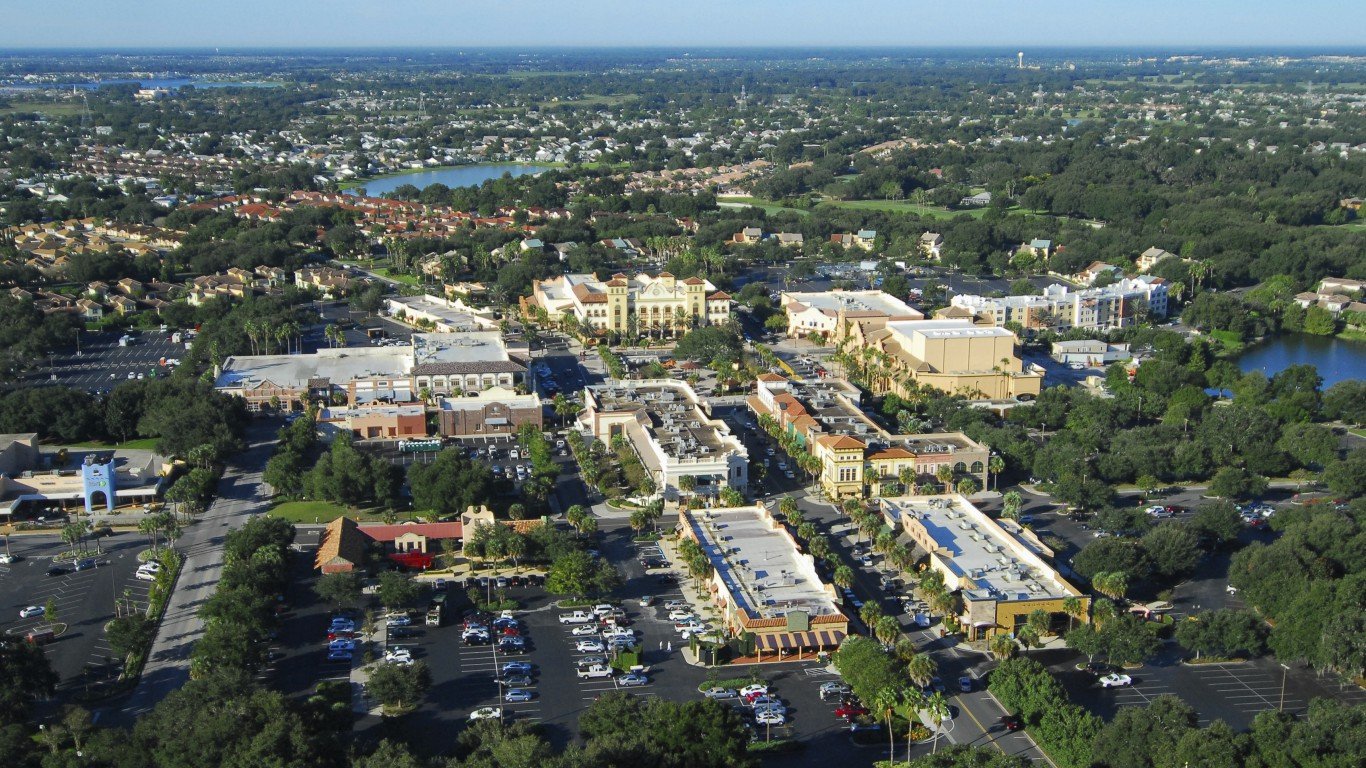
47. The Villages, FL
> Poverty rate: 9.9% (tied)
> 2016 unemployment rate: 7.0%
> Households receiving SNAP benefits: 5.1%
> Households with income under $10,000: 5.4%
> Median household income: $54,562

46. Fairbanks, AK
> Poverty rate: 9.9% (tied)
> 2016 unemployment rate: 5.7%
> Households receiving SNAP benefits: 6.0%
> Households with income under $10,000: 3.7%
> Median household income: $77,328
[in-text-ad-2]

45. Cedar Rapids, IA
> Poverty rate: 9.9% (tied)
> 2016 unemployment rate: 3.8%
> Households receiving SNAP benefits: 9.4%
> Households with income under $10,000: 4.9%
> Median household income: $63,385

44. Albany-Schenectady-Troy, NY
> Poverty rate: 9.9% (tied)
> 2016 unemployment rate: 4.1%
> Households receiving SNAP benefits: 11.2%
> Households with income under $10,000: 5.0%
> Median household income: $65,855
[in-text-ad]
43. Pittsfield, MA
> Poverty rate: 9.8%
> 2016 unemployment rate: 4.4%
> Households receiving SNAP benefits: 12.9%
> Households with income under $10,000: 5.0%
> Median household income: $58,418
[recirclink id=418319]

42. Monroe, MI
> Poverty rate: 9.7% (tied)
> 2016 unemployment rate: 4.3%
> Households receiving SNAP benefits: 11.6%
> Households with income under $10,000: 5.6%
> Median household income: $60,799

41. Cheyenne, WY
> Poverty rate: 9.7% (tied)
> 2016 unemployment rate: 4.1%
> Households receiving SNAP benefits: 6.4%
> Households with income under $10,000: 4.5%
> Median household income: $62,221
[in-text-ad-2]

40. Wenatchee, WA
> Poverty rate: 9.6% (tied)
> 2016 unemployment rate: 6.3%
> Households receiving SNAP benefits: 10.0%
> Households with income under $10,000: 5.1%
> Median household income: $52,231

39. Seattle-Tacoma-Bellevue, WA
> Poverty rate: 9.6% (tied)
> 2016 unemployment rate: 4.5%
> Households receiving SNAP benefits: 10.5%
> Households with income under $10,000: 4.6%
> Median household income: $78,612
[in-text-ad]

38. Gettysburg, PA
> Poverty rate: 9.6% (tied)
> 2016 unemployment rate: 4.0%
> Households receiving SNAP benefits: 9.4%
> Households with income under $10,000: 3.5%
> Median household income: $59,300
[recirclink id=405297]

37. Boston-Cambridge-Newton, MA-NH
> Poverty rate: 9.6% (tied)
> 2016 unemployment rate: 3.4%
> Households receiving SNAP benefits: 10.4%
> Households with income under $10,000: 5.5%
> Median household income: $82,380

36. Topeka, KS
> Poverty rate: 9.5% (tied)
> 2016 unemployment rate: 4.1%
> Households receiving SNAP benefits: 8.0%
> Households with income under $10,000: 5.1%
> Median household income: $56,548
[in-text-ad-2]

35. Oxnard-Thousand Oaks-Ventura, CA
> Poverty rate: 9.5% (tied)
> 2016 unemployment rate: 5.2%
> Households receiving SNAP benefits: 7.0%
> Households with income under $10,000: 3.3%
> Median household income: $80,135

34. Des Moines-West Des Moines, IA
> Poverty rate: 9.5% (tied)
> 2016 unemployment rate: 3.4%
> Households receiving SNAP benefits: 11.8%
> Households with income under $10,000: 4.3%
> Median household income: $65,704
[in-text-ad]
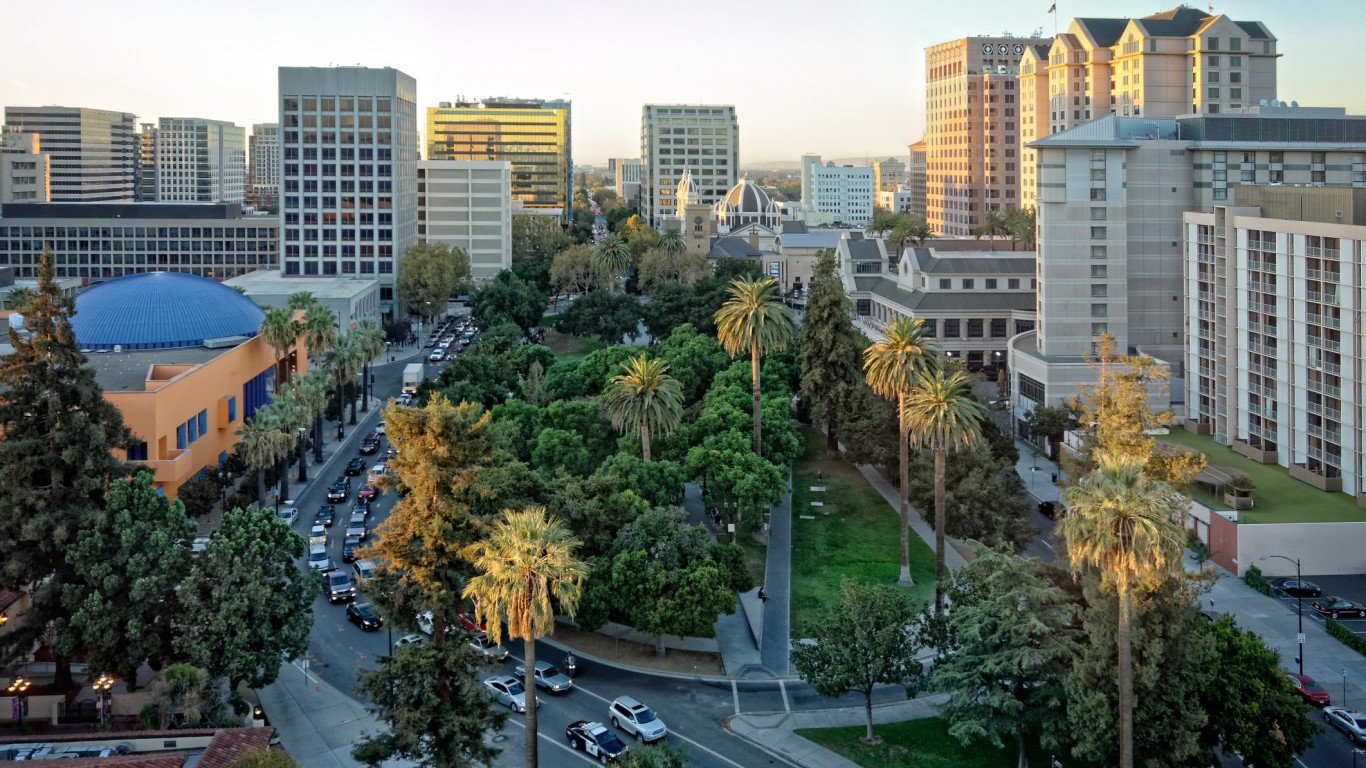
33. San Jose-Sunnyvale-Santa Clara, CA
> Poverty rate: 9.4% (tied)
> 2016 unemployment rate: 3.8%
> Households receiving SNAP benefits: 5.5%
> Households with income under $10,000: 3.4%
> Median household income: $110,040
[recirclink id=418319]

32. Rochester, MN
> Poverty rate: 9.4% (tied)
> 2016 unemployment rate: 3.2%
> Households receiving SNAP benefits: 6.5%
> Households with income under $10,000: 4.3%
> Median household income: $70,078

31. Harrisburg-Carlisle, PA
> Poverty rate: 9.4% (tied)
> 2016 unemployment rate: 4.5%
> Households receiving SNAP benefits: 9.9%
> Households with income under $10,000: 4.1%
> Median household income: $61,467
[in-text-ad-2]

30. Green Bay, WI
> Poverty rate: 9.4% (tied)
> 2016 unemployment rate: 3.8%
> Households receiving SNAP benefits: 9.0%
> Households with income under $10,000: 5.2%
> Median household income: $58,011

29. Denver-Aurora-Lakewood, CO
> Poverty rate: 9.4% (tied)
> 2016 unemployment rate: 3.1%
> Households receiving SNAP benefits: 7.0%
> Households with income under $10,000: 4.3%
> Median household income: $71,926
[in-text-ad]

28. Lebanon, PA
> Poverty rate: 9.3%
> 2016 unemployment rate: 4.5%
> Households receiving SNAP benefits: 11.3%
> Households with income under $10,000: 3.6%
> Median household income: $57,248
[recirclink id=404837]
27. Santa Rosa, CA
> Poverty rate: 9.2% (tied)
> 2016 unemployment rate: 4.0%
> Households receiving SNAP benefits: 6.8%
> Households with income under $10,000: 3.9%
> Median household income: $73,929

26. San Francisco-Oakland-Hayward, CA
> Poverty rate: 9.2% (tied)
> 2016 unemployment rate: 3.8%
> Households receiving SNAP benefits: 5.5%
> Households with income under $10,000: 4.2%
> Median household income: $96,677
[in-text-ad-2]
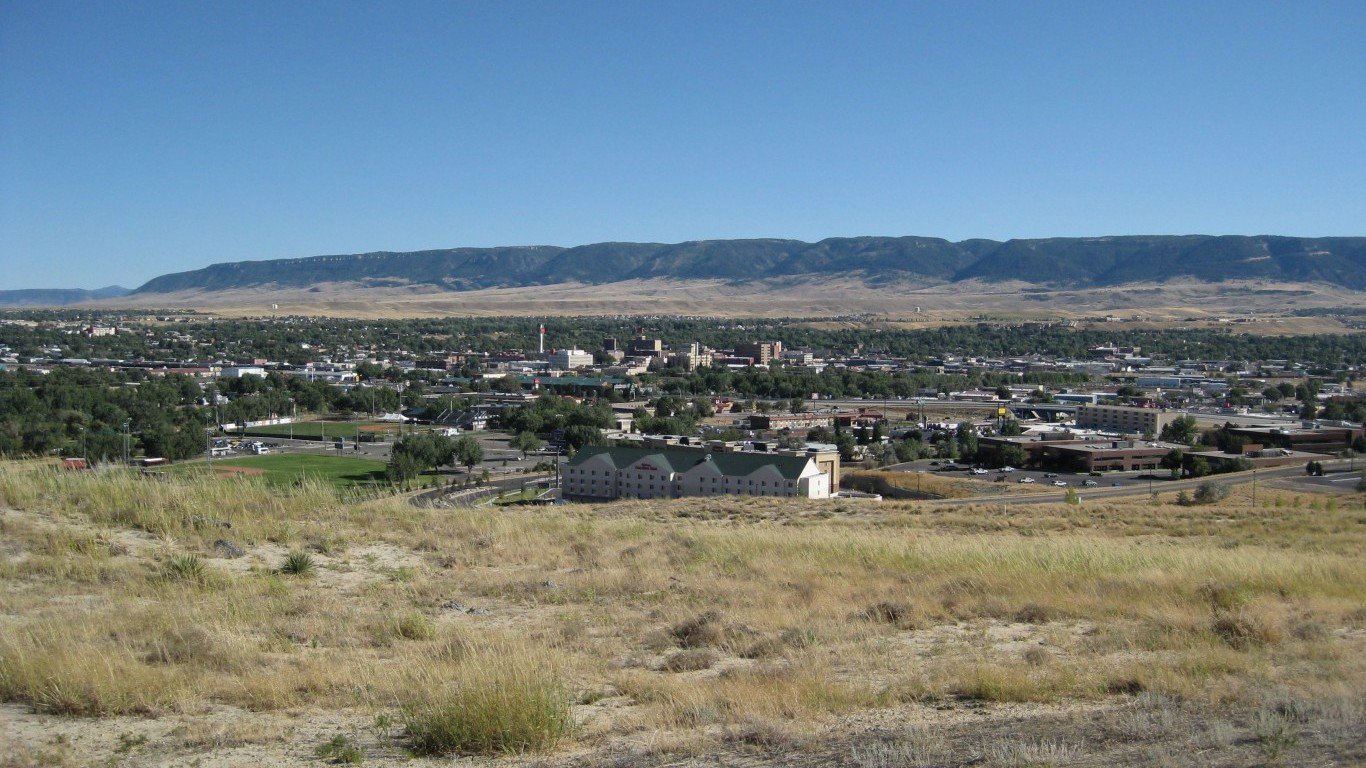
25. Casper, WY
> Poverty rate: 9.2% (tied)
> 2016 unemployment rate: 7.1%
> Households receiving SNAP benefits: 8.3%
> Households with income under $10,000: 6.4%
> Median household income: $59,474

24. Bismarck, ND
> Poverty rate: 9.2% (tied)
> 2016 unemployment rate: 2.9%
> Households receiving SNAP benefits: 4.6%
> Households with income under $10,000: 5.8%
> Median household income: $65,527
[in-text-ad]

23. Salt Lake City, UT
> Poverty rate: 9.1% (tied)
> 2016 unemployment rate: 3.2%
> Households receiving SNAP benefits: 6.9%
> Households with income under $10,000: 4.0%
> Median household income: $68,196
[recirclink id=418319]

22. Portland-South Portland, ME
> Poverty rate: 9.1% (tied)
> 2016 unemployment rate: 3.0%
> Households receiving SNAP benefits: 10.1%
> Households with income under $10,000: 5.2%
> Median household income: $63,422
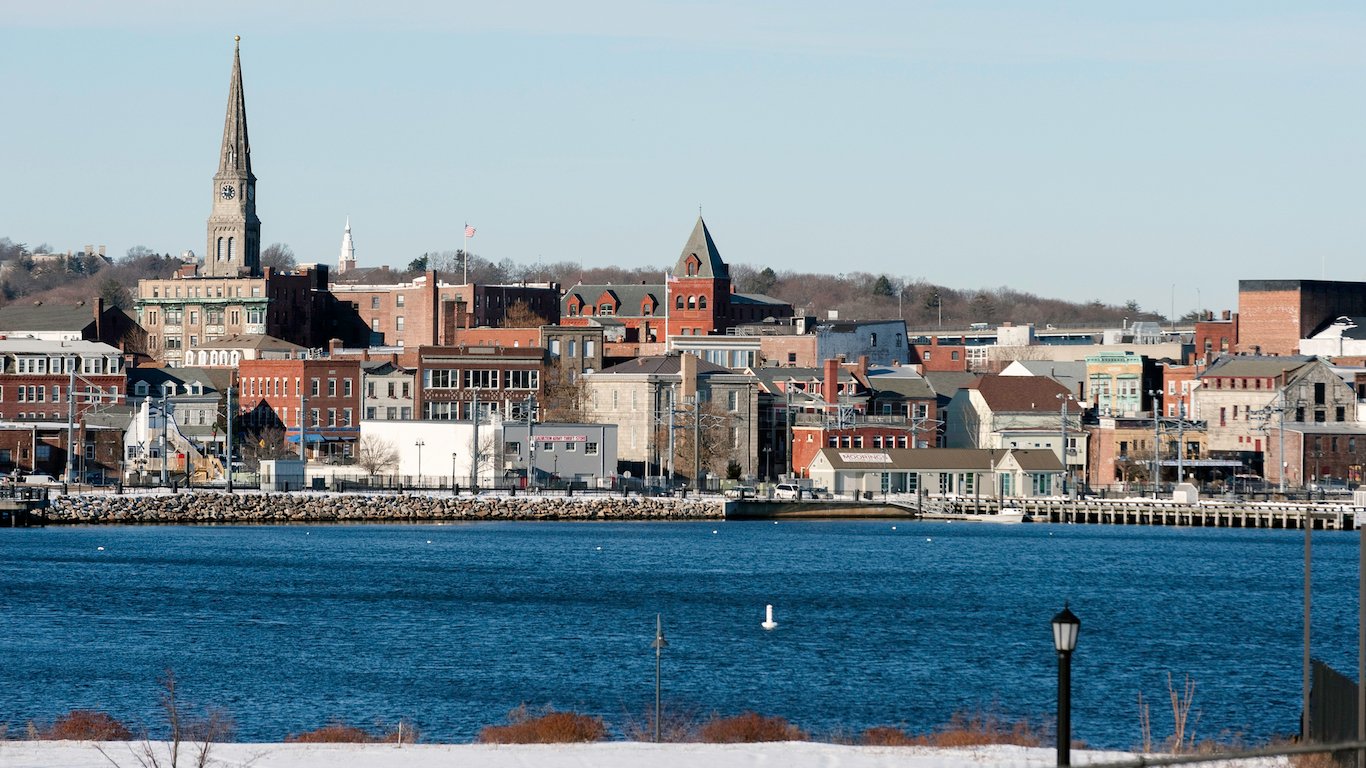
21. Norwich-New London, CT
> Poverty rate: 9.0%
> 2016 unemployment rate: 5.2%
> Households receiving SNAP benefits: 11.4%
> Households with income under $10,000: 4.7%
> Median household income: $70,699
[in-text-ad-2]

20. Sioux Falls, SD
> Poverty rate: 8.9%
> 2016 unemployment rate: 2.3%
> Households receiving SNAP benefits: 7.6%
> Households with income under $10,000: 4.5%
> Median household income: $63,931

19. Minneapolis-St. Paul-Bloomington, MN-WI
> Poverty rate: 8.8%
> 2016 unemployment rate: 3.6%
> Households receiving SNAP benefits: 7.8%
> Households with income under $10,000: 4.1%
> Median household income: $73,231
[in-text-ad]

18. Jefferson City, MO
> Poverty rate: 8.6% (tied)
> 2016 unemployment rate: 3.8%
> Households receiving SNAP benefits: 8.8%
> Households with income under $10,000: 5.5%
> Median household income: $55,031
[recirclink id=405409]
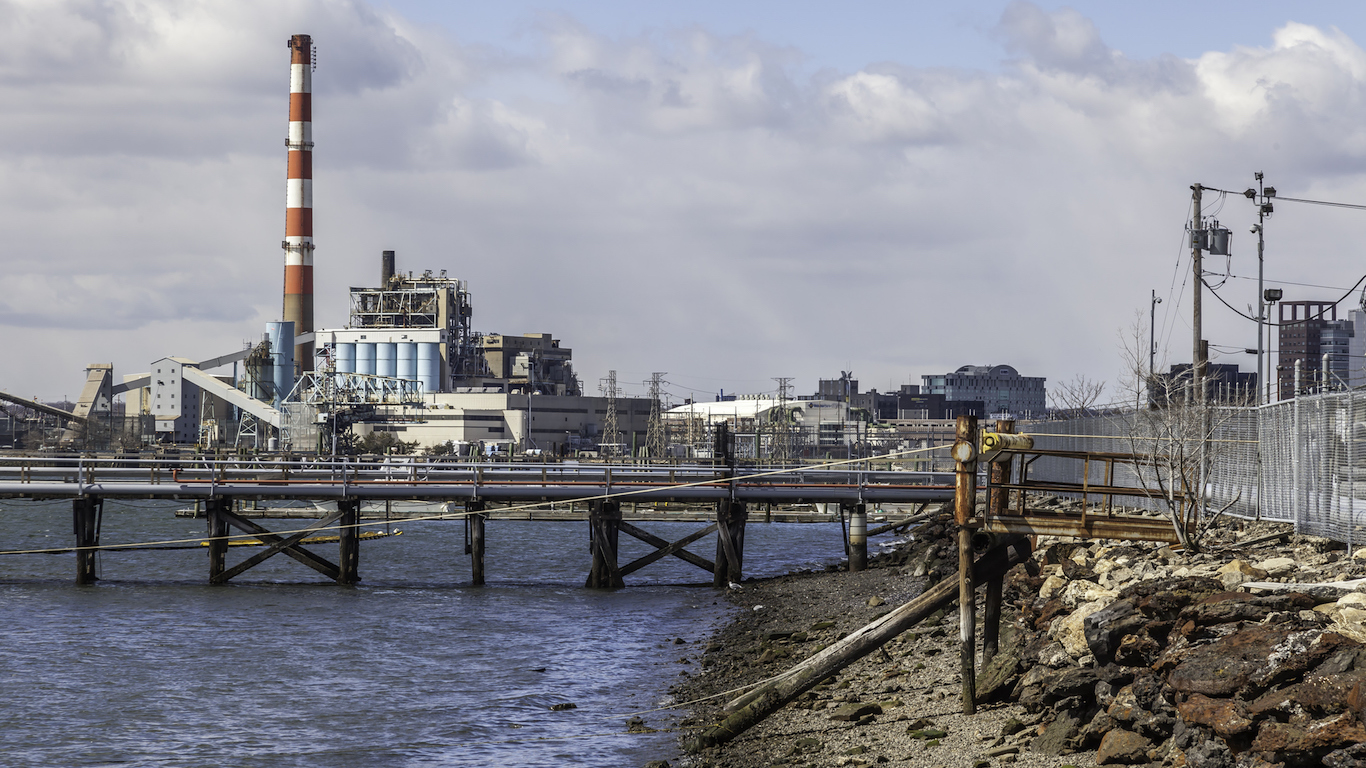
17. Bridgeport-Stamford-Norwalk, CT
> Poverty rate: 8.6% (tied)
> 2016 unemployment rate: 5.0%
> Households receiving SNAP benefits: 9.2%
> Households with income under $10,000: 4.4%
> Median household income: $90,123

16. Urban Honolulu, HI
> Poverty rate: 8.5%
> 2016 unemployment rate: 2.8%
> Households receiving SNAP benefits: 9.8%
> Households with income under $10,000: 5.2%
> Median household income: $80,513
[in-text-ad-2]

15. Washington-Arlington-Alexandria, DC-VA-MD-WV
> Poverty rate: 8.4%
> 2016 unemployment rate: 3.8%
> Households receiving SNAP benefits: 7.3%
> Households with income under $10,000: 4.6%
> Median household income: $95,843

14. Midland, TX
> Poverty rate: 8.3% (tied)
> 2016 unemployment rate: 4.4%
> Households receiving SNAP benefits: 7.8%
> Households with income under $10,000: 3.9%
> Median household income: $65,224
[in-text-ad]
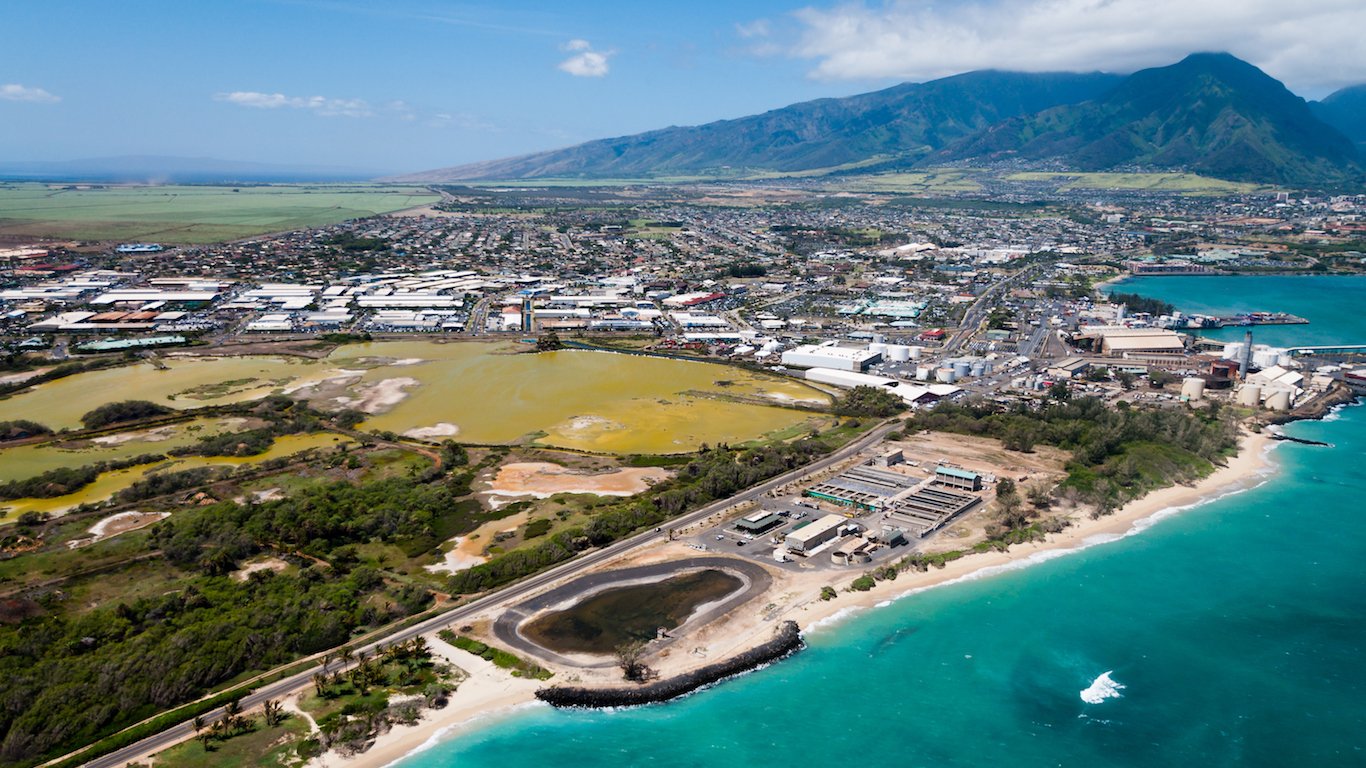
13. Kahului-Wailuku-Lahaina, HI
> Poverty rate: 8.3% (tied)
> 2016 unemployment rate: 3.2%
> Households receiving SNAP benefits: 13.2%
> Households with income under $10,000: 5.6%
> Median household income: $72,268
[recirclink id=418319]

12. Midland, MI
> Poverty rate: 8.2% (tied)
> 2016 unemployment rate: 4.5%
> Households receiving SNAP benefits: 11.3%
> Households with income under $10,000: 4.5%
> Median household income: $57,269

11. Manchester-Nashua, NH
> Poverty rate: 8.2% (tied)
> 2016 unemployment rate: 2.7%
> Households receiving SNAP benefits: 7.7%
> Households with income under $10,000: 4.4%
> Median household income: $76,254
[in-text-ad-2]

10. Winchester, VA-WV
> Poverty rate: 8.0% (tied)
> 2016 unemployment rate: 3.7%
> Households receiving SNAP benefits: 6.9%
> Households with income under $10,000: 3.2%
> Median household income: $60,962

9. Ogden-Clearfield, UT
> Poverty rate: 8.0% (tied)
> 2016 unemployment rate: 3.4%
> Households receiving SNAP benefits: 7.5%
> Households with income under $10,000: 3.9%
> Median household income: $70,227
[in-text-ad]

8. Chambersburg-Waynesboro, PA
> Poverty rate: 8.0% (tied)
> 2016 unemployment rate: 5.2%
> Households receiving SNAP benefits: 9.1%
> Households with income under $10,000: 3.5%
> Median household income: $60,559
[recirclink id=405048]
7. Appleton, WI
> Poverty rate: 7.6%
> 2016 unemployment rate: 3.6%
> Households receiving SNAP benefits: 7.4%
> Households with income under $10,000: 2.8%
> Median household income: $63,902
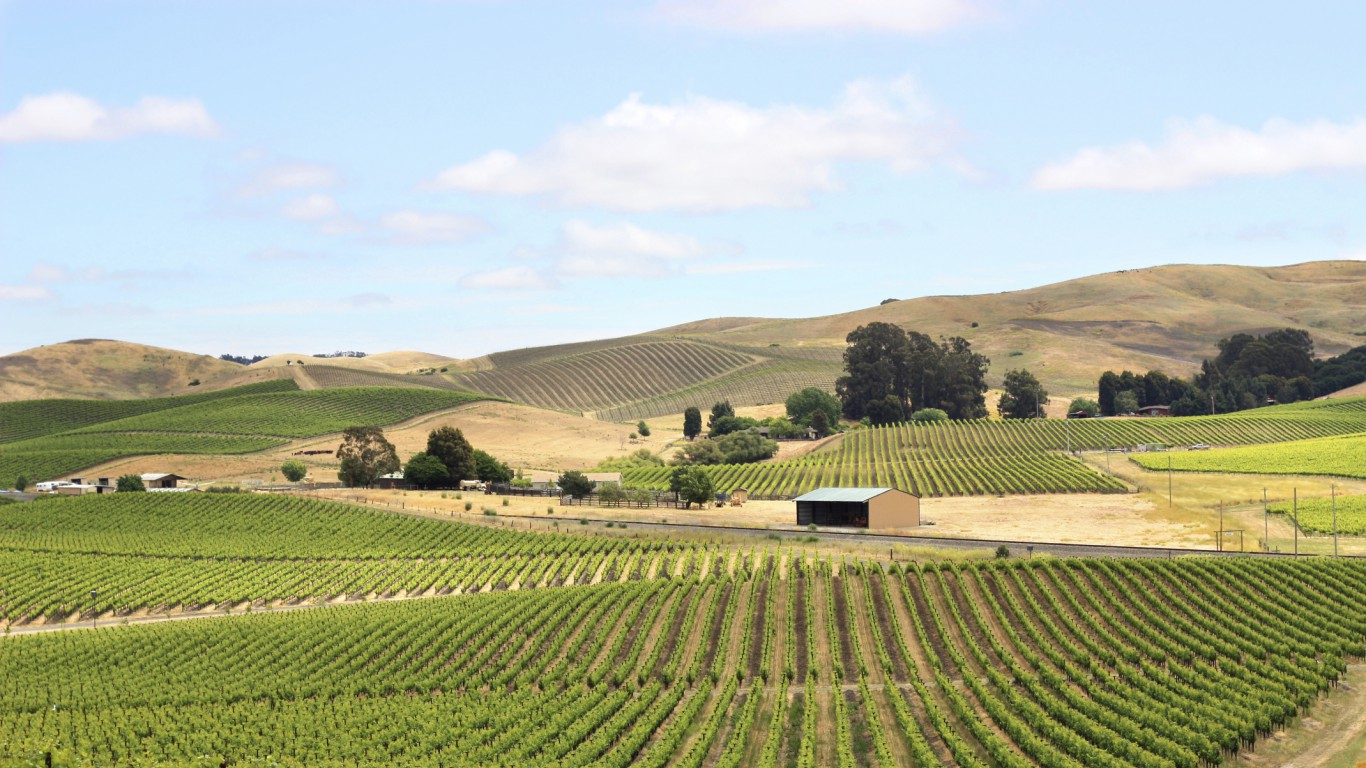
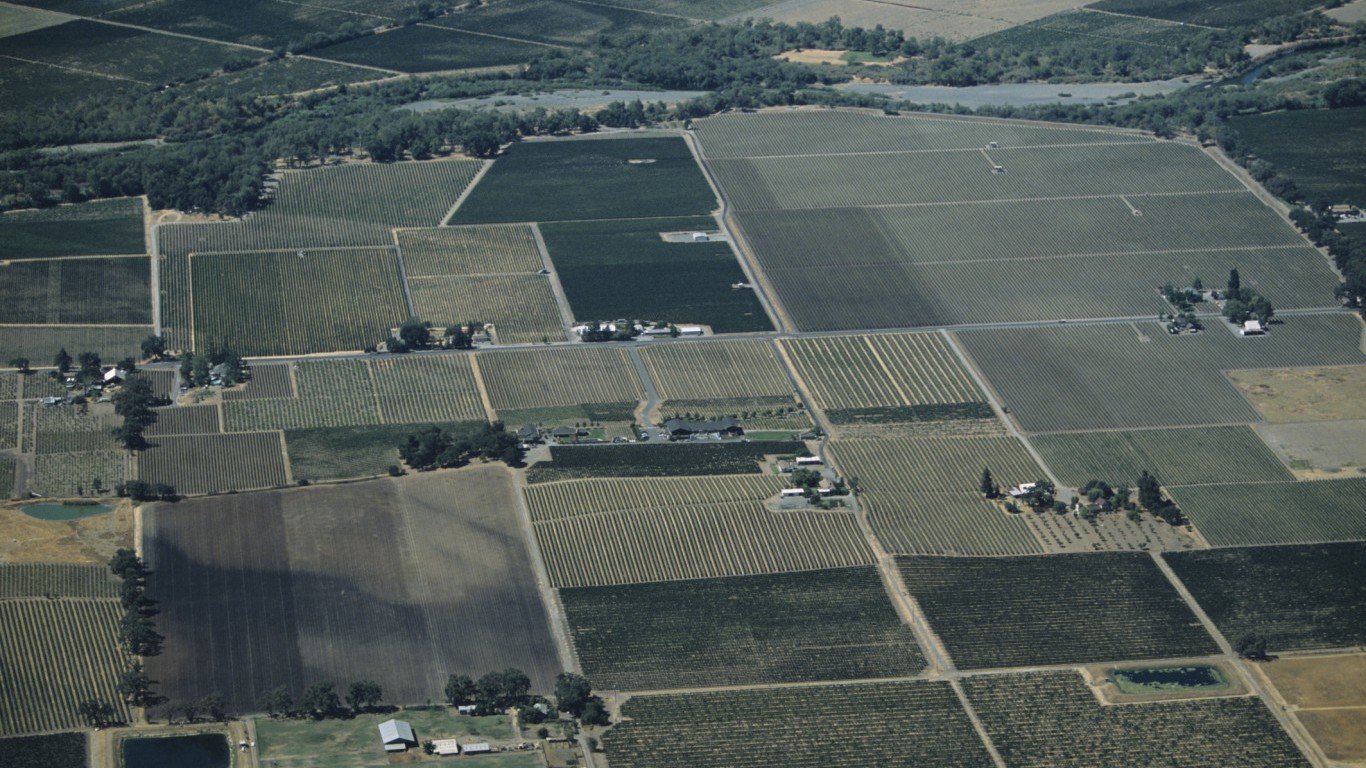
6. Napa, CA
> Poverty rate: 7.3% (tied)
> 2016 unemployment rate: 4.3%
> Households receiving SNAP benefits: 4.6%
> Households with income under $10,000: 3.9%
> Median household income: $75,077
[in-text-ad-2]
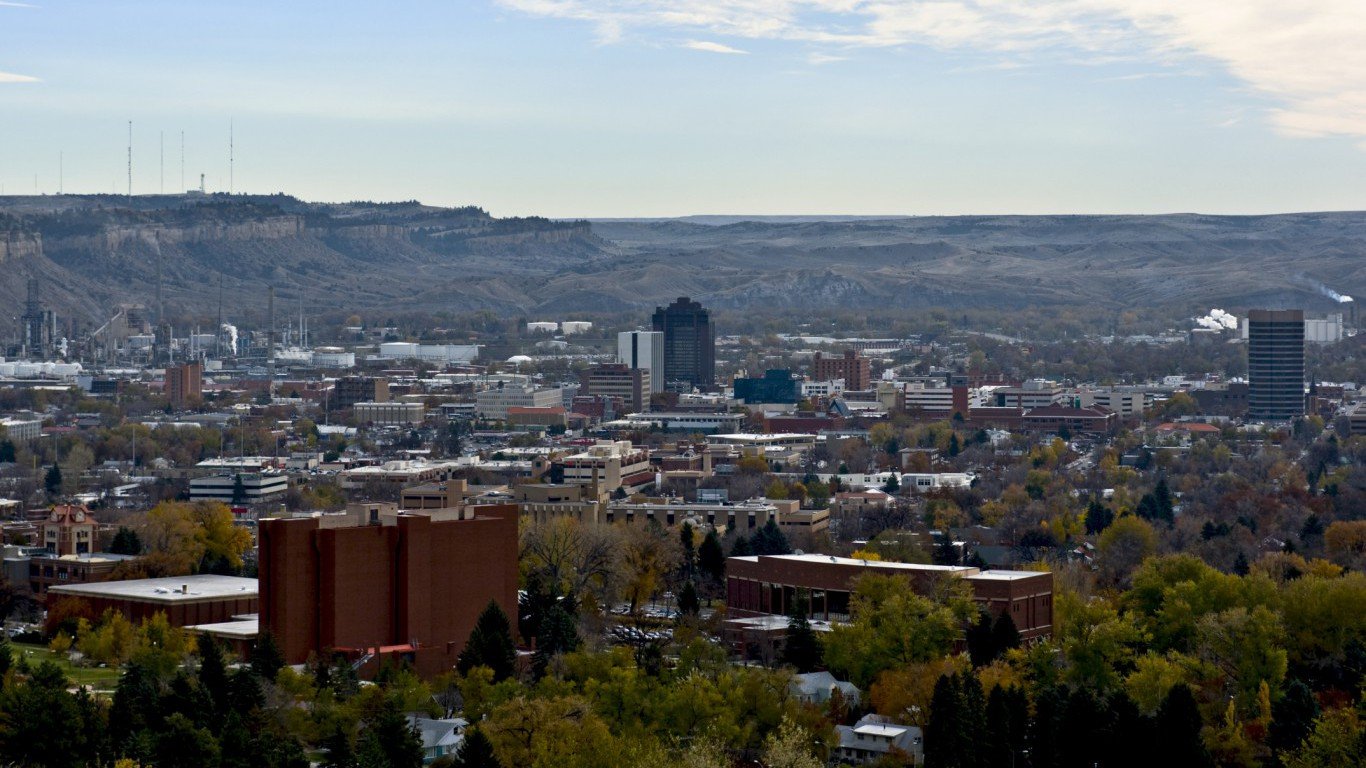
5. Billings, MT
> Poverty rate: 7.3% (tied)
> 2016 unemployment rate: 3.6%
> Households receiving SNAP benefits: 6.6%
> Households with income under $10,000: 4.1%
> Median household income: $58,037

4. Anchorage, AK
> Poverty rate: 7.2%
> 2016 unemployment rate: 5.9%
> Households receiving SNAP benefits: 8.9%
> Households with income under $10,000: 2.9%
> Median household income: $82,203
[in-text-ad]

3. Fond du Lac, WI
> Poverty rate: 6.6%
> 2016 unemployment rate: 3.6%
> Households receiving SNAP benefits: 9.5%
> Households with income under $10,000: 3.2%
> Median household income: $58,310
[recirclink id=418035]
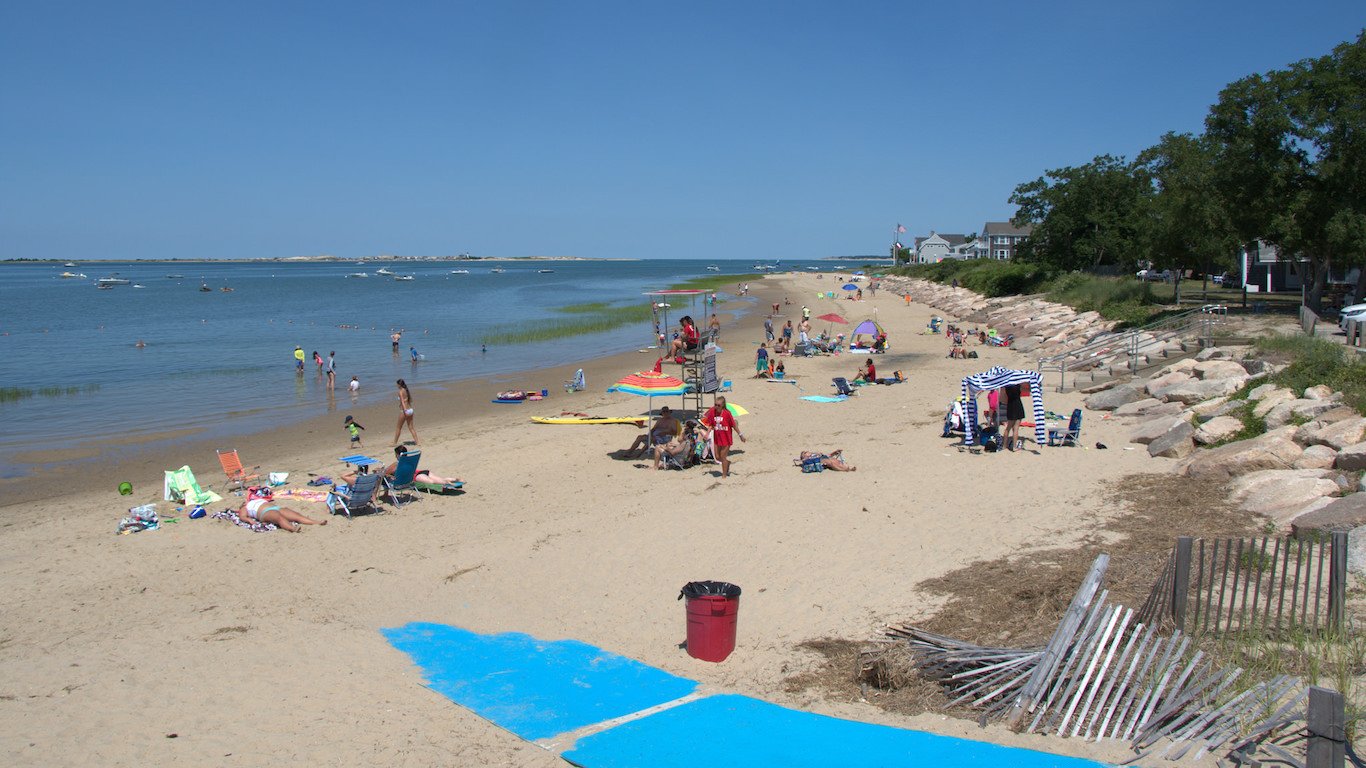
2. Barnstable Town, MA
> Poverty rate: 6.5%
> 2016 unemployment rate: 4.4%
> Households receiving SNAP benefits: 8.2%
> Households with income under $10,000: 4.3%
> Median household income: $67,898
1. Sheboygan, WI
> Poverty rate: 5.4%
> 2016 unemployment rate: 3.5%
> Households receiving SNAP benefits: 9.0%
> Households with income under $10,000: 3.3%
> Median household income: $54,059
Contact [email protected] for any questions or corrections.