[cnxvideo id=”655236″ placement=”ros”]The typical American household earned $55,322 in 2016, roughly $4,000 higher than 2009’s median income of $51,425. While incomes have risen for the majority of households since the Great Recession, some parts of the United States have become poorer over the last decade — mostly low-income areas — as income inequality increased.
To determine America’s poorest towns, 24/7 Wall St. reviewed household income data from the U.S. Census Bureau’s American Community Survey in every American town with a population between 1,000 and 25,000. For comparison purposes, boroughs, census designated places, cities, towns, and villages were all considered.
The economic recovery from the Great Recession has been uneven, and many of the poorest households in America are even poorer than they were before the financial crisis. While the share of aggregate wealth earned by the poorest 60% of households fell from 26.9% of all income in 2010 to 25.9% in 2016, the share of wealth earned by the richest 5% of households rose from 22.2% to 23.0%. In half of the 30 poorest towns, the median household income is lower today than it was in 2009.
Click here to see the full list of America’s poorest towns.
Click here to see the full list of America’s richest towns.
Click here to see our detailed findings and methodology.
30. Kiryas Joel, New York
> Median household income: $26,341
> Median home value: $360,600
> Adults with at least a bachelor’s degree: 6.6%
> Poverty rate: 55.7%
[in-text-ad]
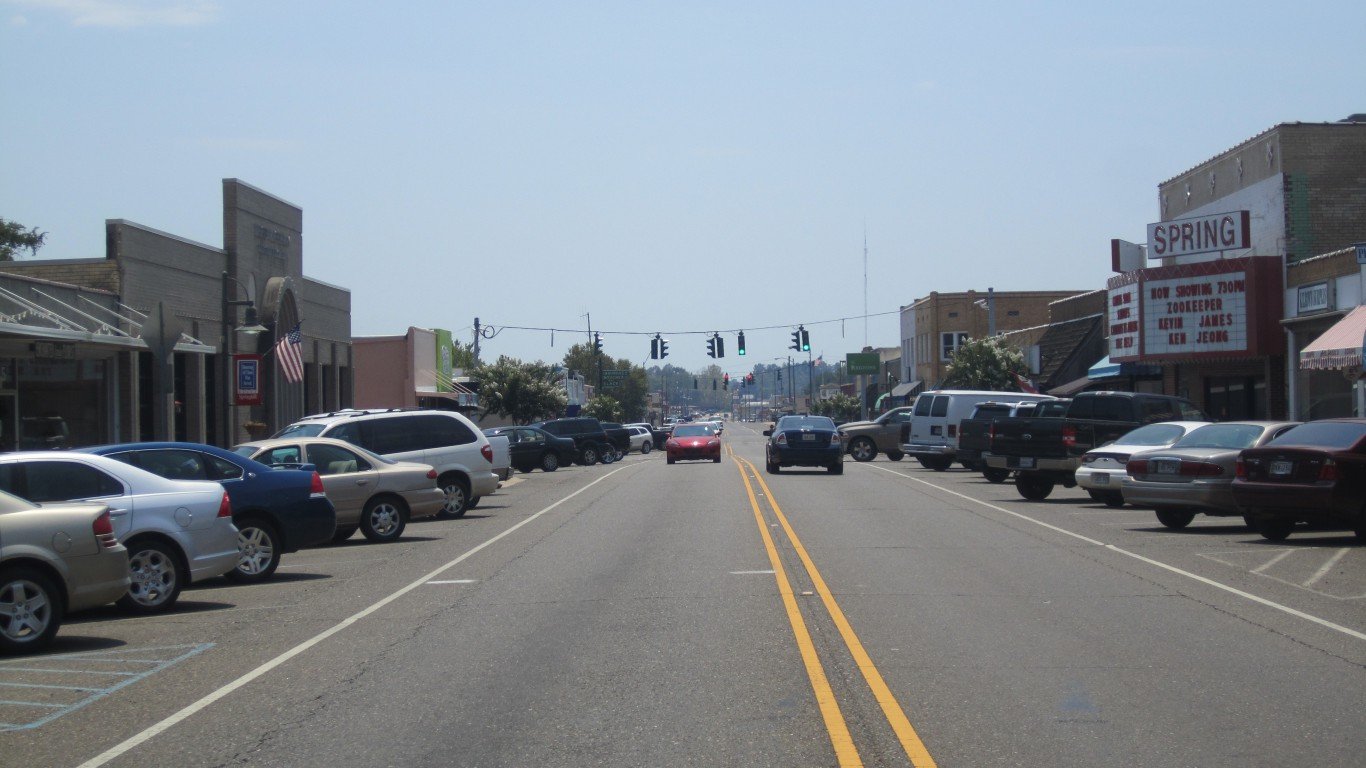
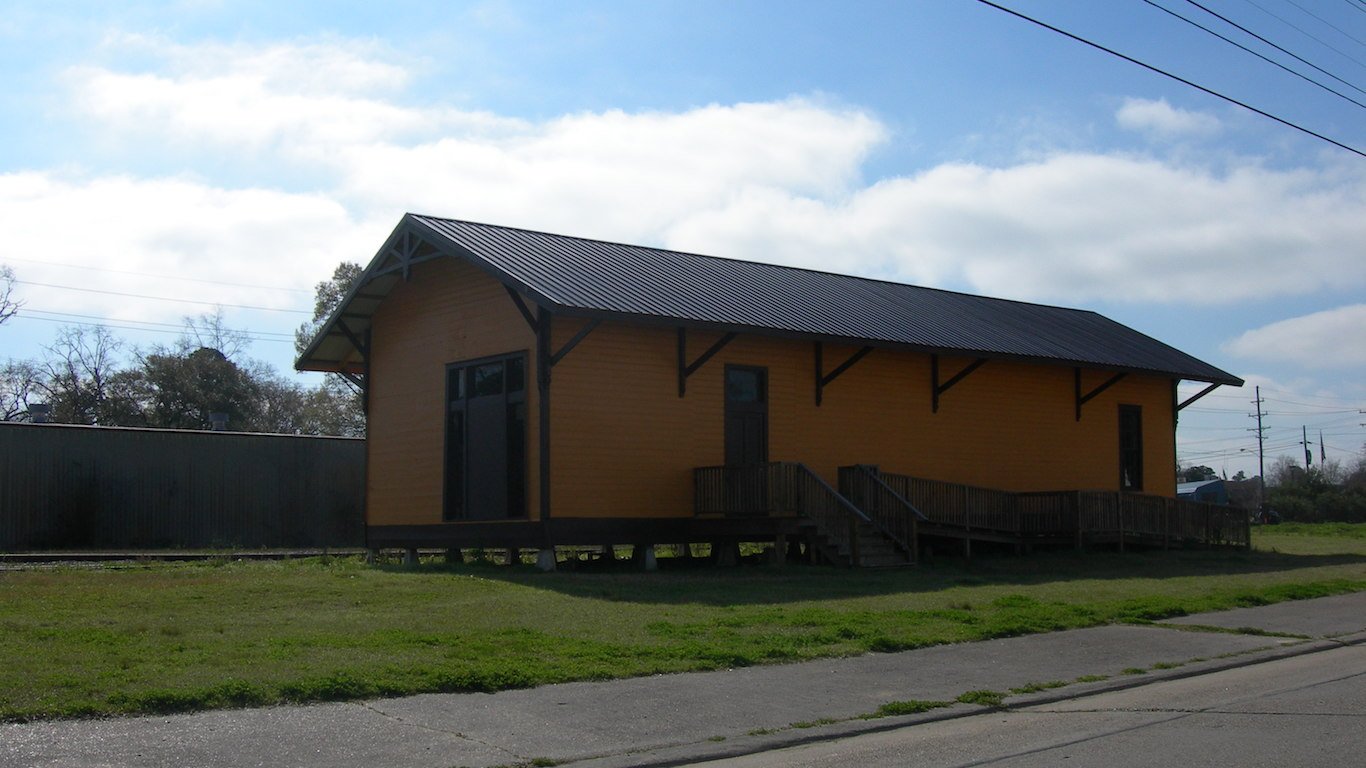
29. Springhill, Louisiana
> Median household income: $26,260
> Median home value: $73,900
> Adults with at least a bachelor’s degree: 11.8%
> Poverty rate: 36.7%
[recirclink id=444492]

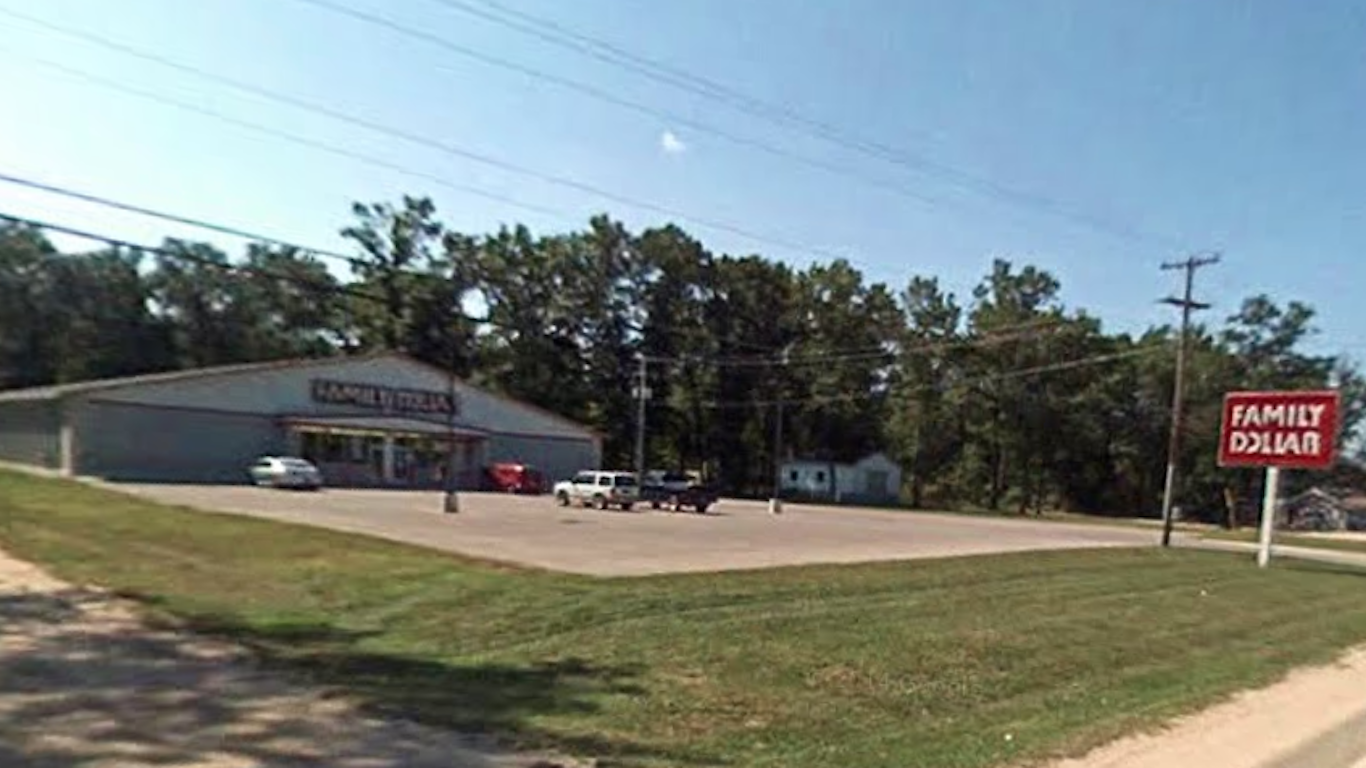
28. Mountain Grove, Missouri
> Median household income: $26,224
> Median home value: $77,000
> Adults with at least a bachelor’s degree: 9.5%
> Poverty rate: 26.3%
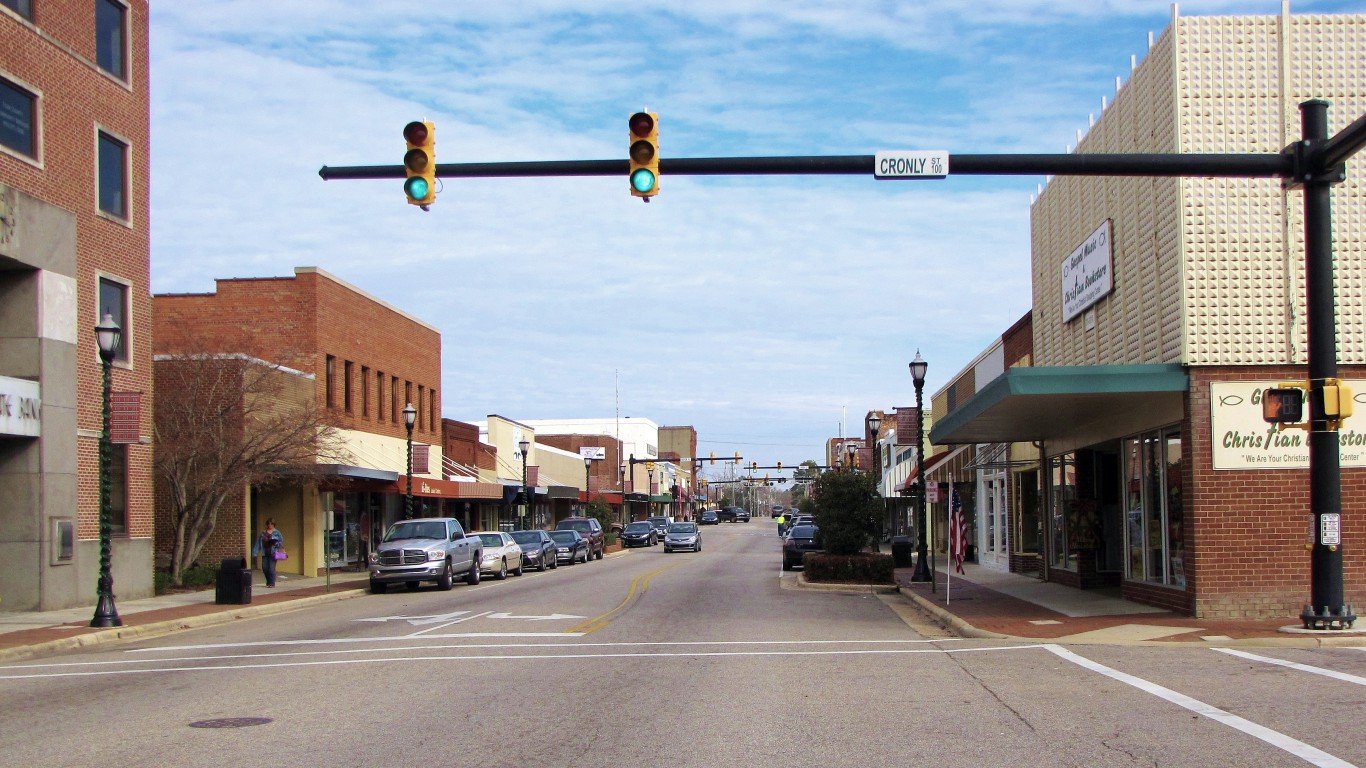
27. Laurinburg, North Carolina
> Median household income: $26,216
> Median home value: $98,200
> Adults with at least a bachelor’s degree: 19.2%
> Poverty rate: 36.6%
[in-text-ad-2]
26. Mount Olive, North Carolina
> Median household income: $26,099
> Median home value: $85,100
> Adults with at least a bachelor’s degree: 17.0%
> Poverty rate: 33.3%
25. Mendota, California
> Median household income: $26,094
> Median home value: $114,500
> Adults with at least a bachelor’s degree: 1.0%
> Poverty rate: 49.5%
[in-text-ad]
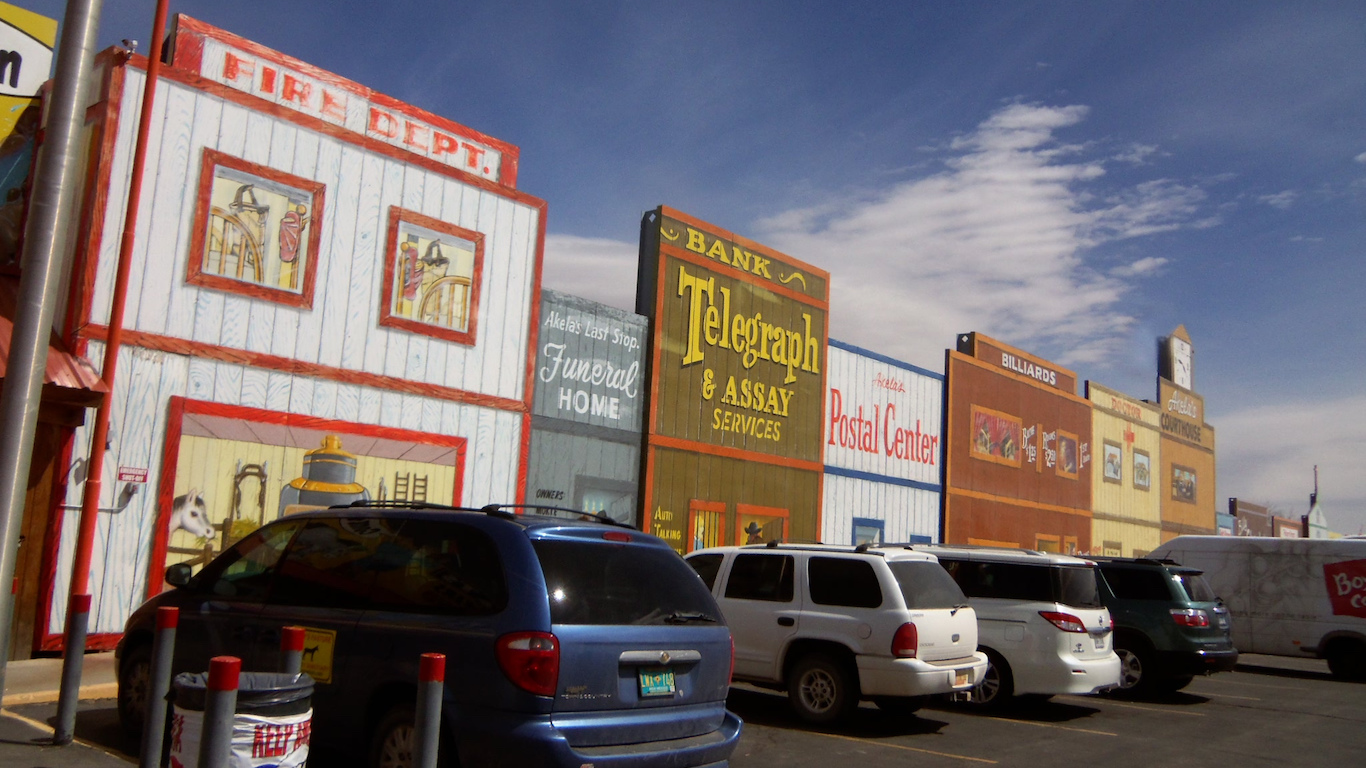
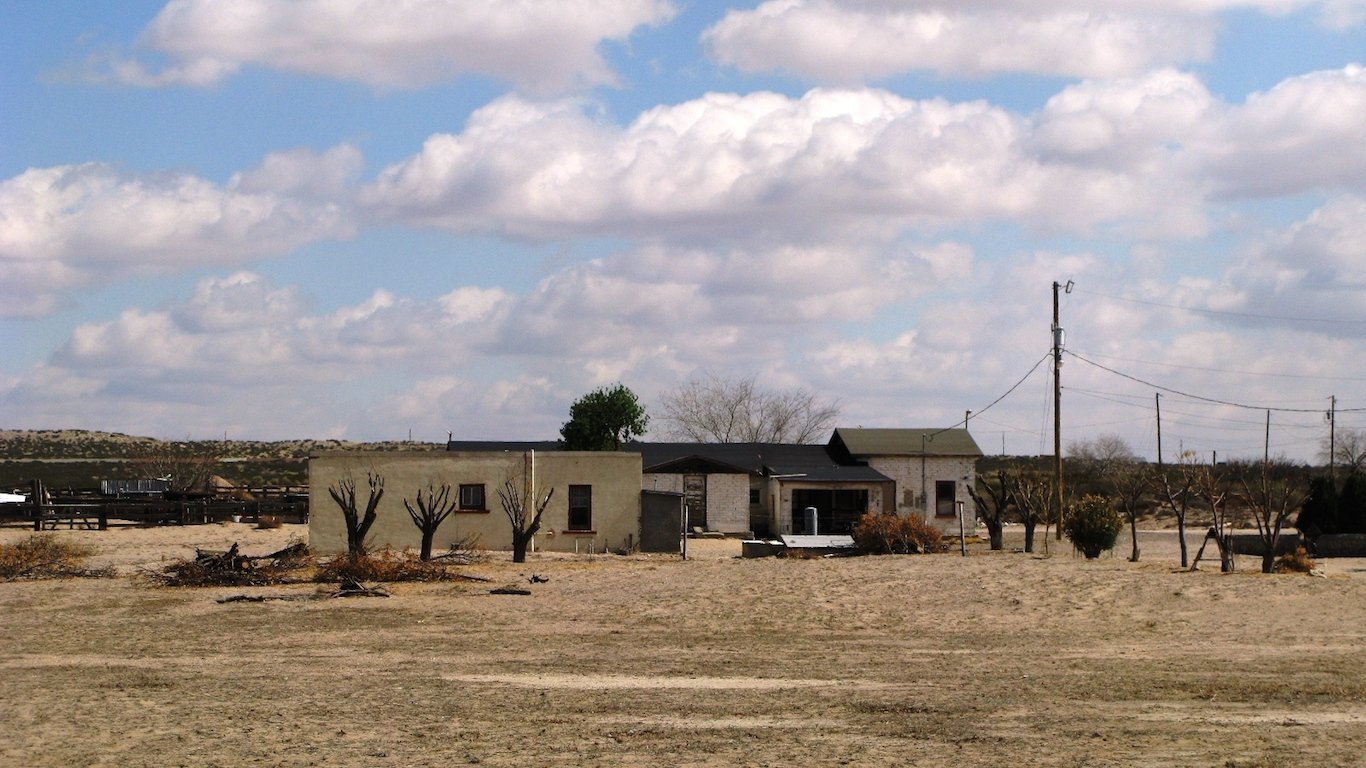
24. Deming, New Mexico
> Median household income: $26,044
> Median home value: $84,300
> Adults with at least a bachelor’s degree: 13.2%
> Poverty rate: 32.1%
[recirclink id=444468]
23. Skidway Lake, Michigan
> Median household income: $26,040
> Median home value: $49,200
> Adults with at least a bachelor’s degree: 5.5%
> Poverty rate: 31.0%
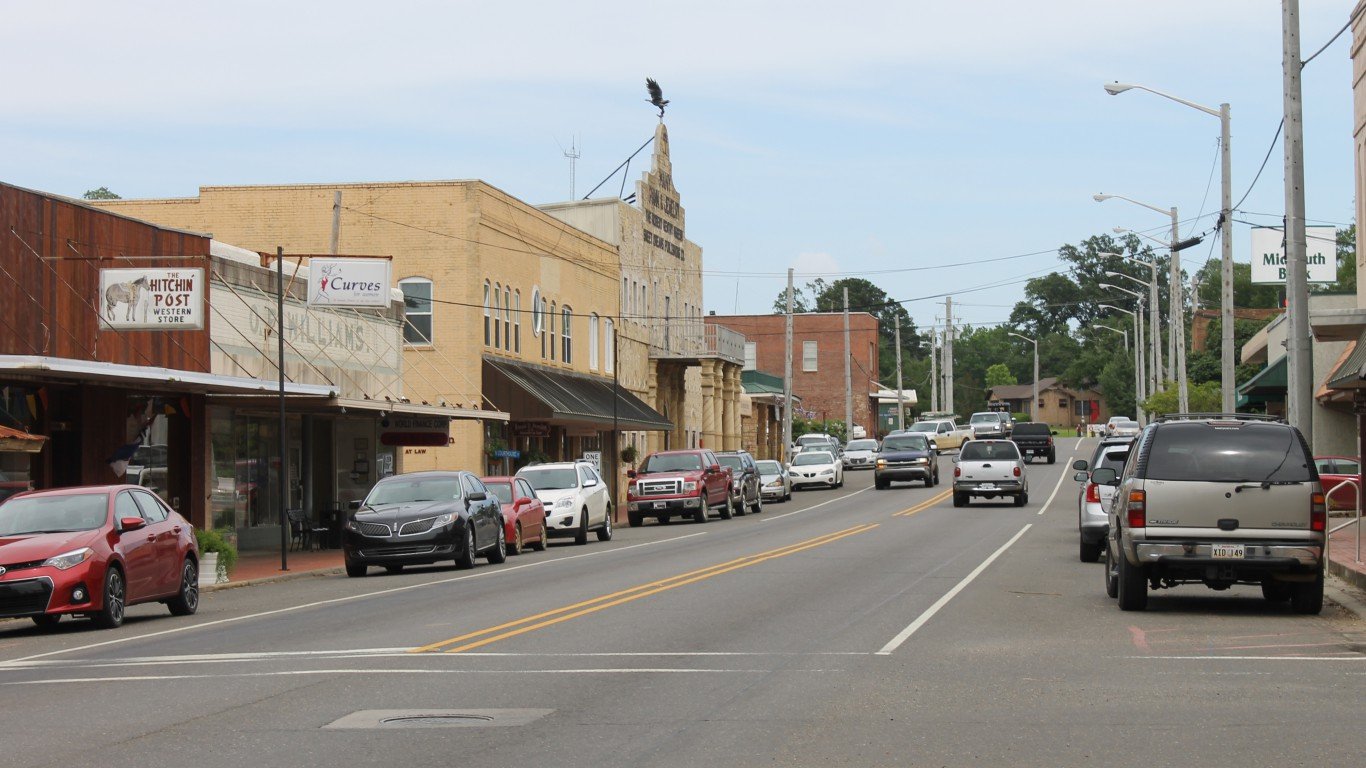
22. Many, Louisiana
> Median household income: $25,899
> Median home value: $88,000
> Adults with at least a bachelor’s degree: 15.6%
> Poverty rate: 32.5%
[in-text-ad-2]
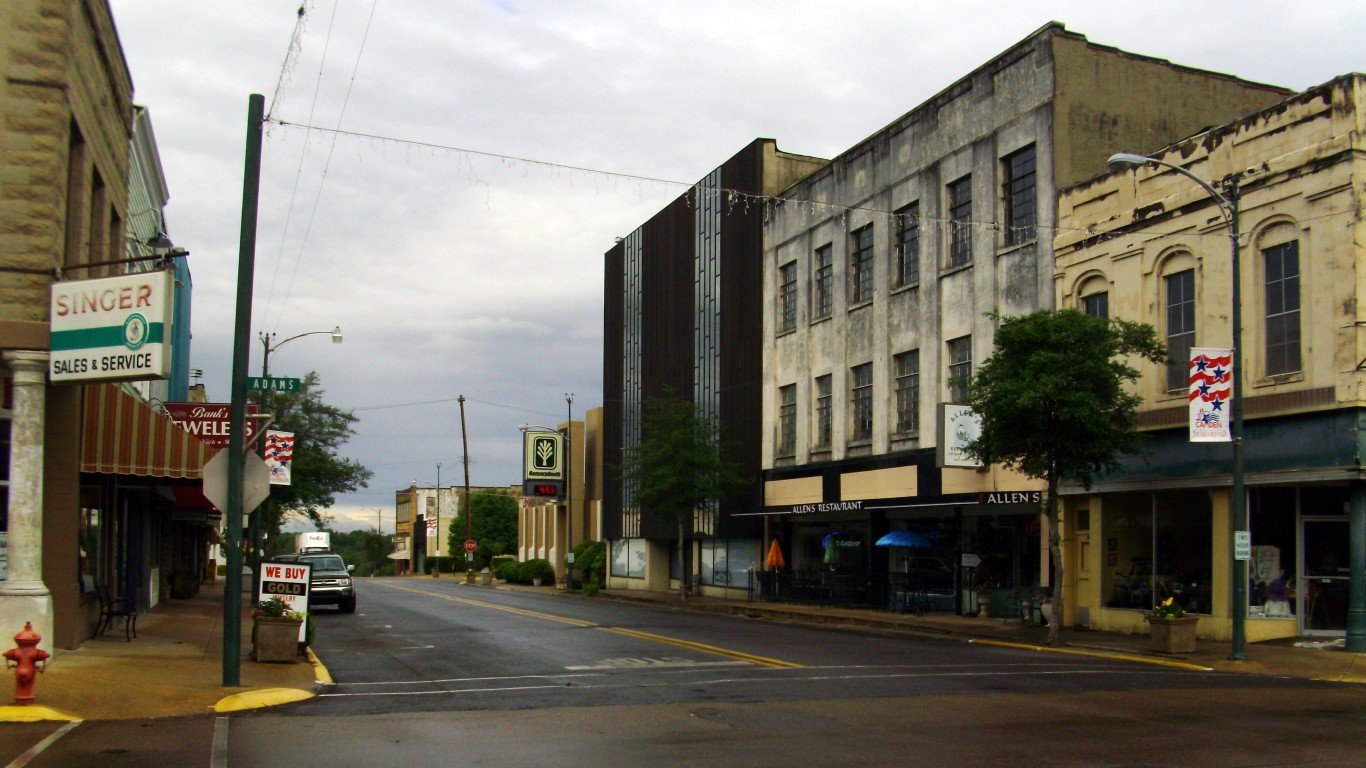
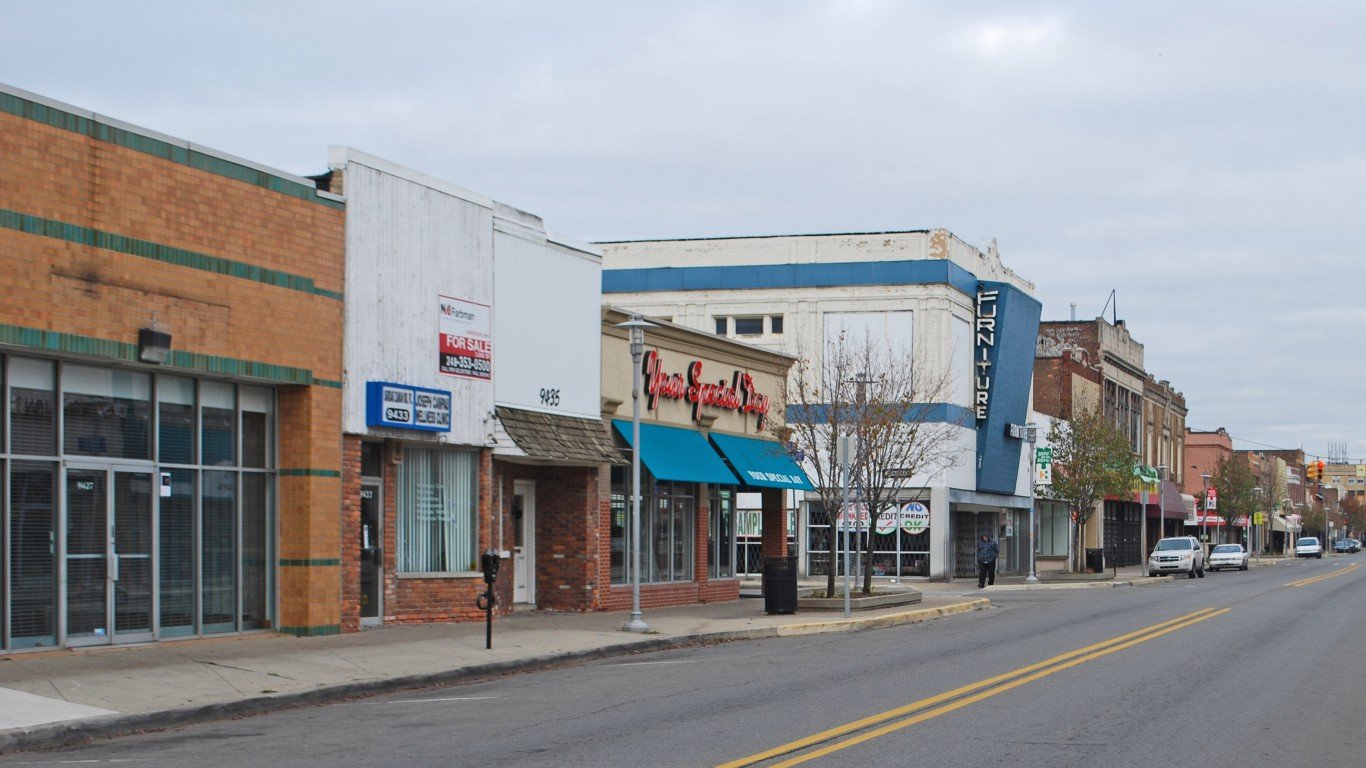
21. Camden, Arkansas
> Median household income: $25,581
> Median home value: $70,900
> Adults with at least a bachelor’s degree: 17.2%
> Poverty rate: 34.0%
![]()
20. Clearlake, California
> Median household income: $25,426
> Median home value: $84,200
> Adults with at least a bachelor’s degree: 9.1%
> Poverty rate: 38.1%
[in-text-ad]
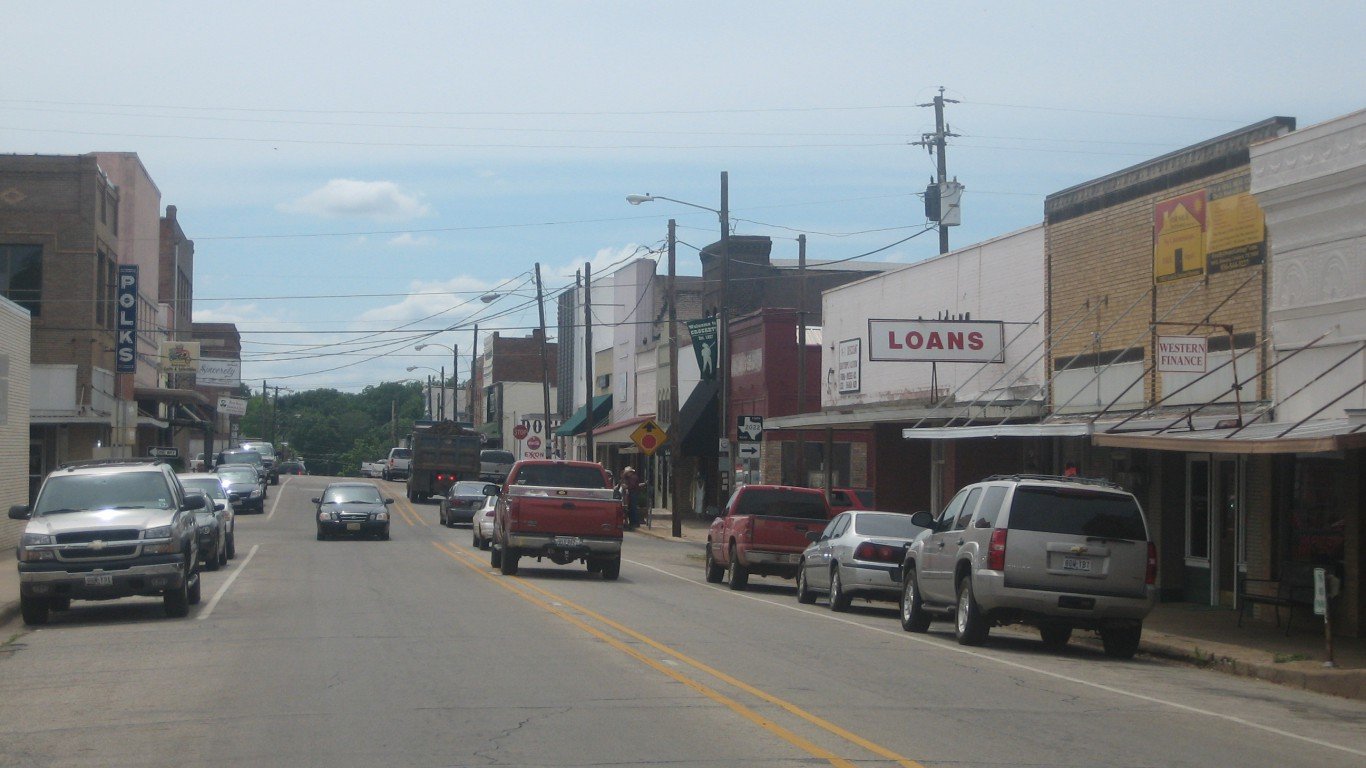
19. Crockett, Texas
> Median household income: $25,190
> Median home value: $77,500
> Adults with at least a bachelor’s degree: 15.9%
> Poverty rate: 39.3%
[recirclink id=444391]
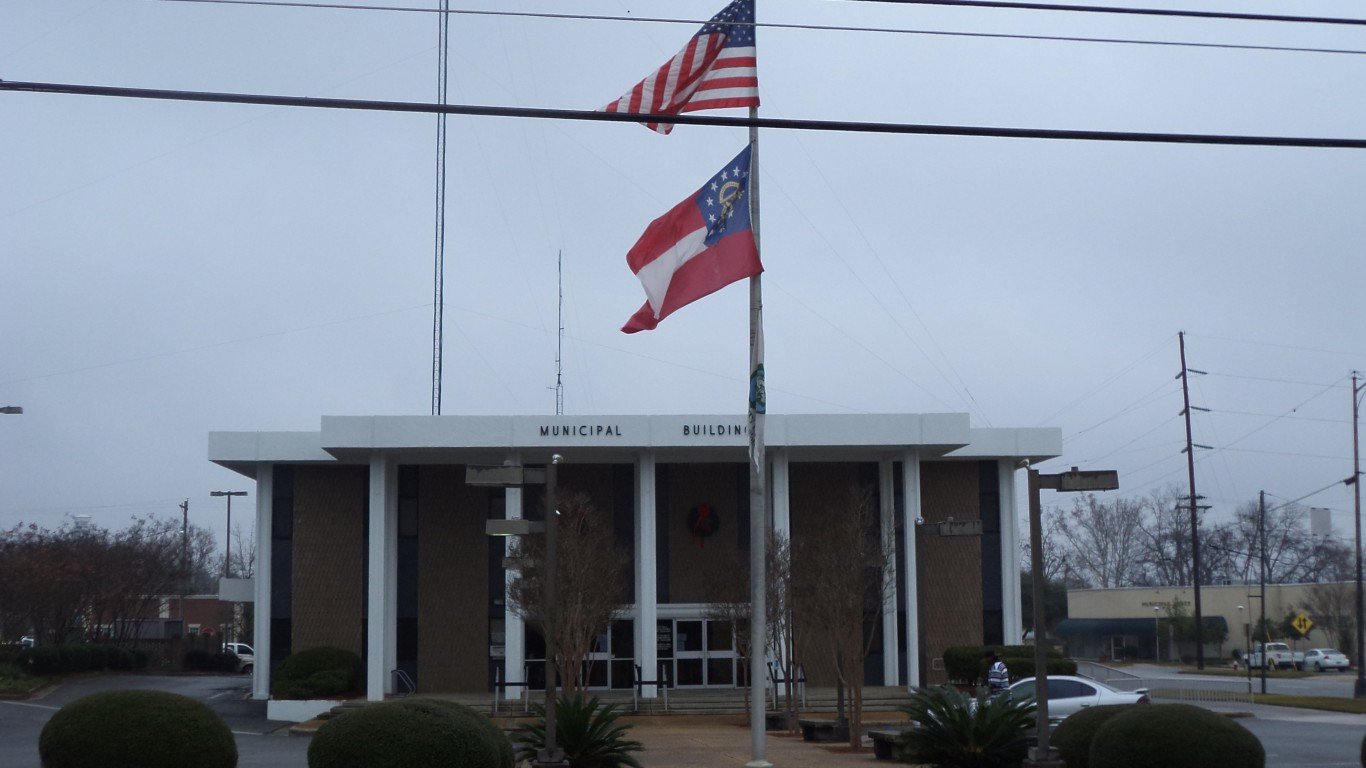
18. Moultrie, Georgia
> Median household income: $24,696
> Median home value: $84,600
> Adults with at least a bachelor’s degree: 14.3%
> Poverty rate: 34.1%
17. Fabens, Texas
> Median household income: $24,612
> Median home value: $61,600
> Adults with at least a bachelor’s degree: 3.4%
> Poverty rate: 48.8%
[in-text-ad-2]
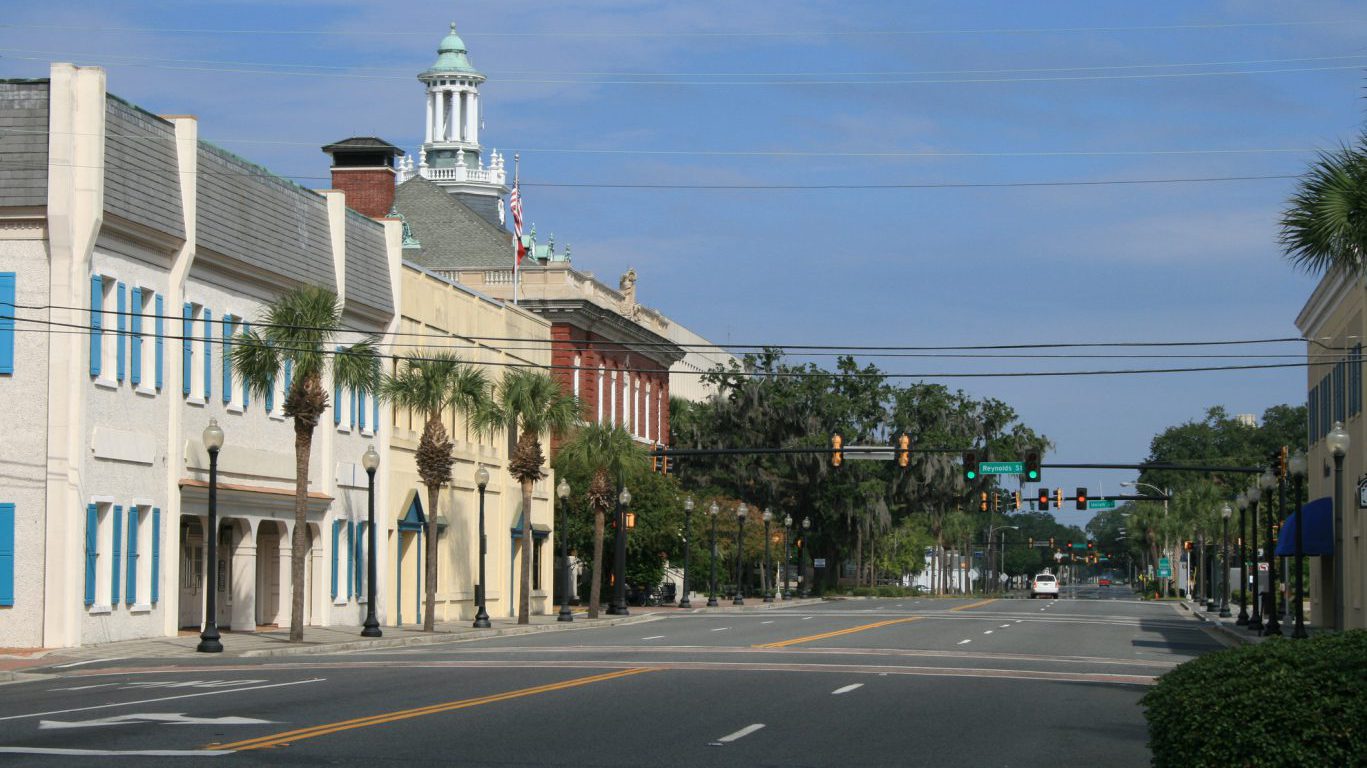
16. Brunswick, Georgia
> Median household income: $24,314
> Median home value: $95,800
> Adults with at least a bachelor’s degree: 14.1%
> Poverty rate: 36.0%
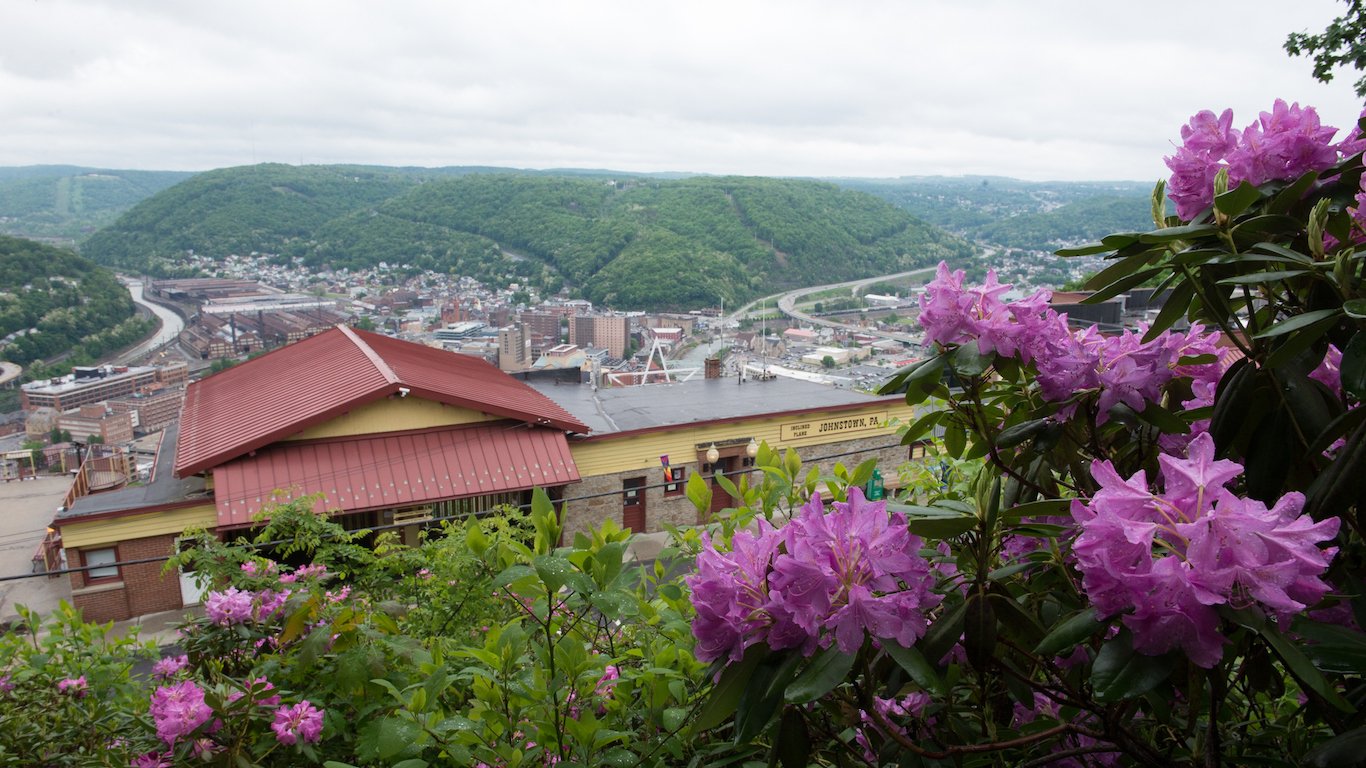
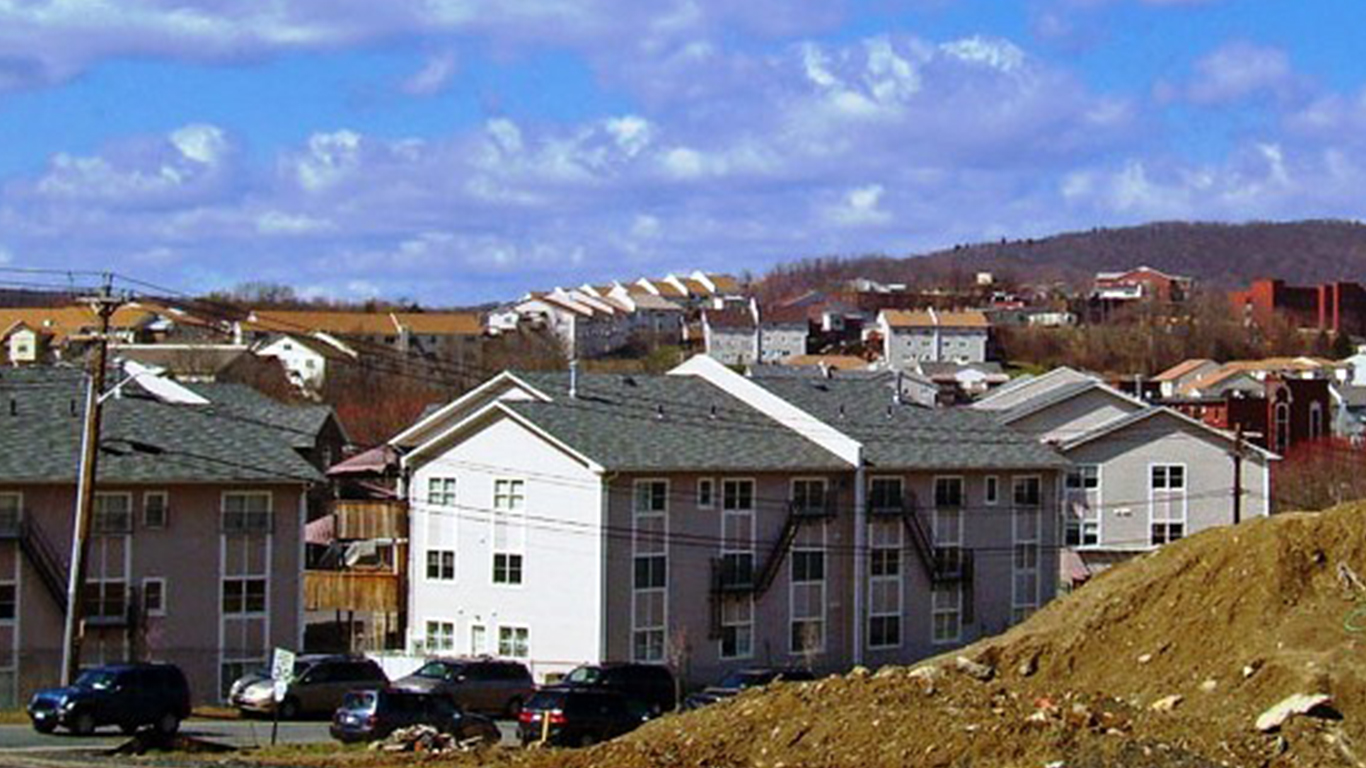
15. Johnstown, Pennsylvania
> Median household income: $24,075
> Median home value: $42,400
> Adults with at least a bachelor’s degree: 11.7%
> Poverty rate: 37.0%
[in-text-ad]
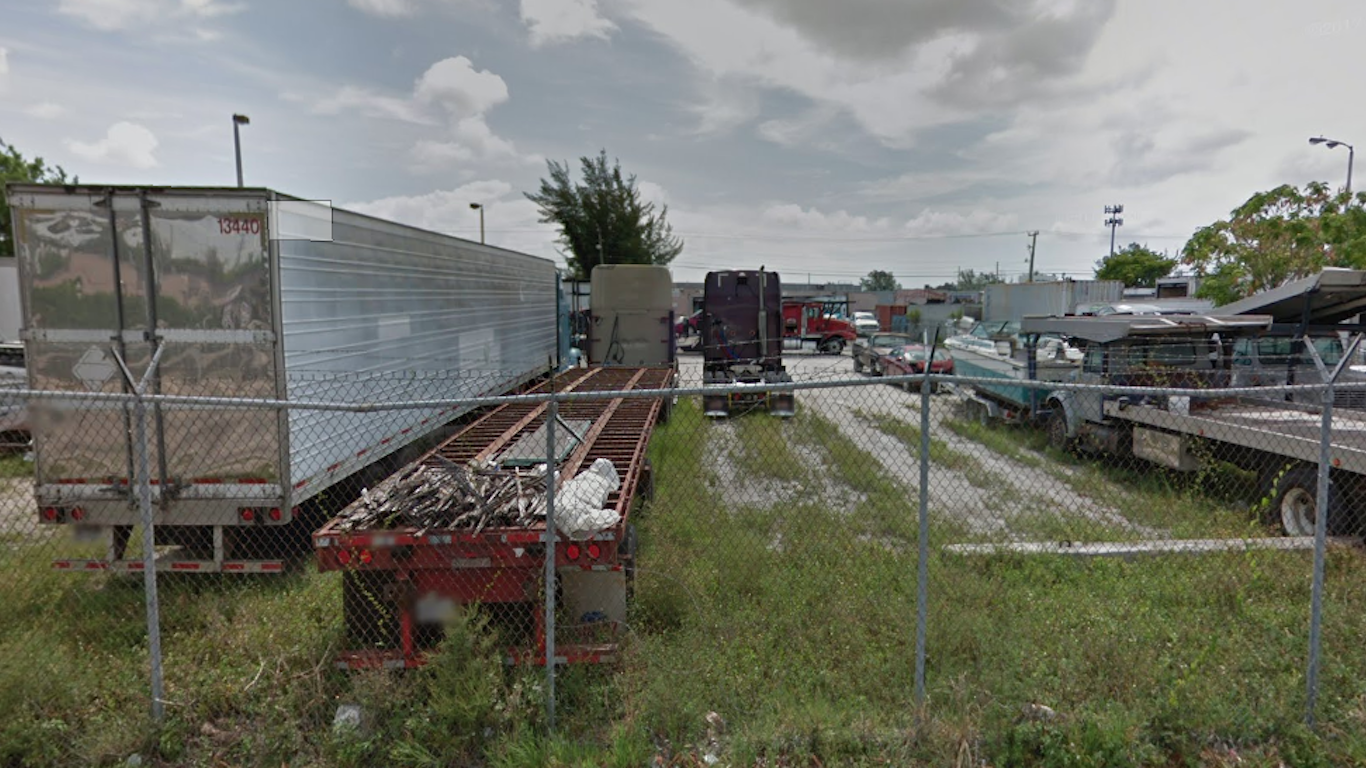
14. Gladeview, Florida
> Median household income: $24,033
> Median home value: $89,800
> Adults with at least a bachelor’s degree: 7.8%
> Poverty rate: 44.6%
[recirclink id=444326]
13. Hamtramck, Michigan
> Median household income: $23,609
> Median home value: $47,300
> Adults with at least a bachelor’s degree: 12.6%
> Poverty rate: 49.7%
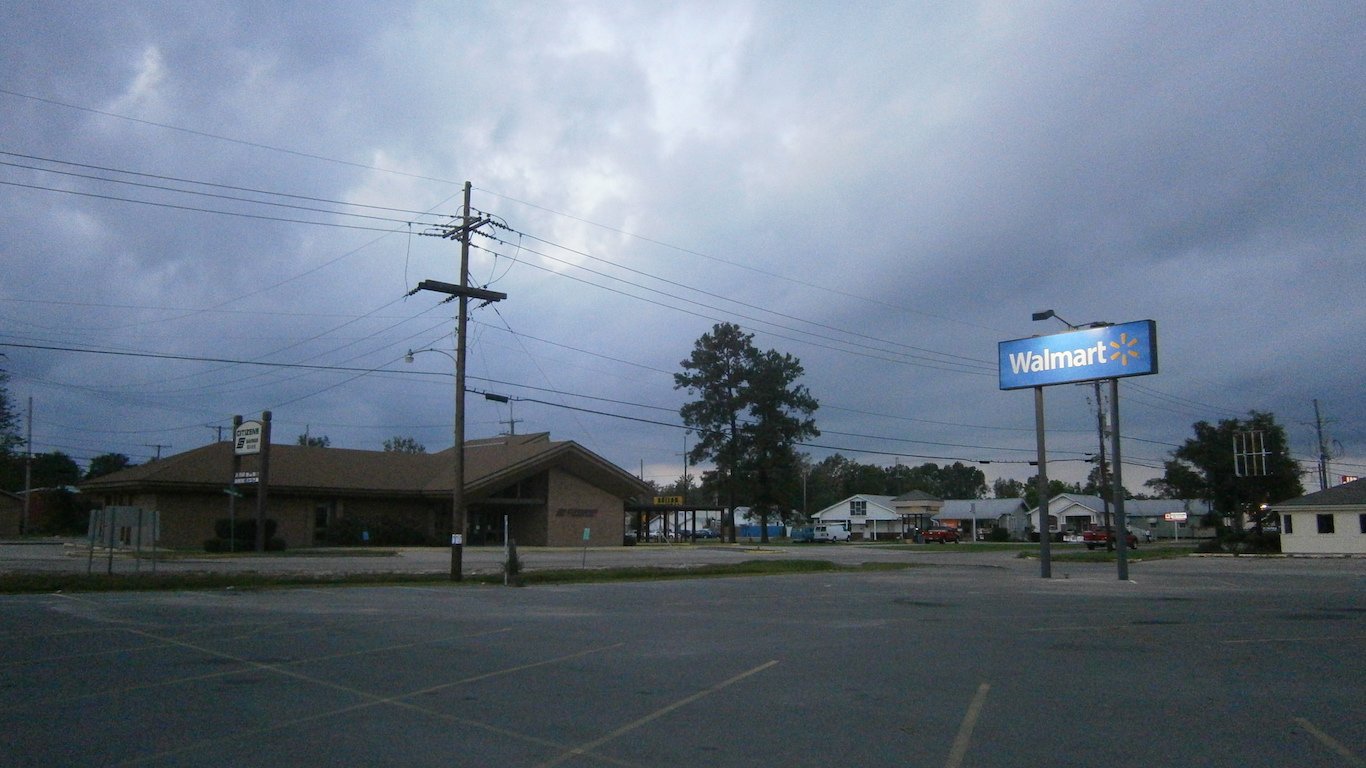
12. Bogalusa, Louisiana
> Median household income: $23,604
> Median home value: $67,000
> Adults with at least a bachelor’s degree: 9.7%
> Poverty rate: 38.2%
[in-text-ad-2]
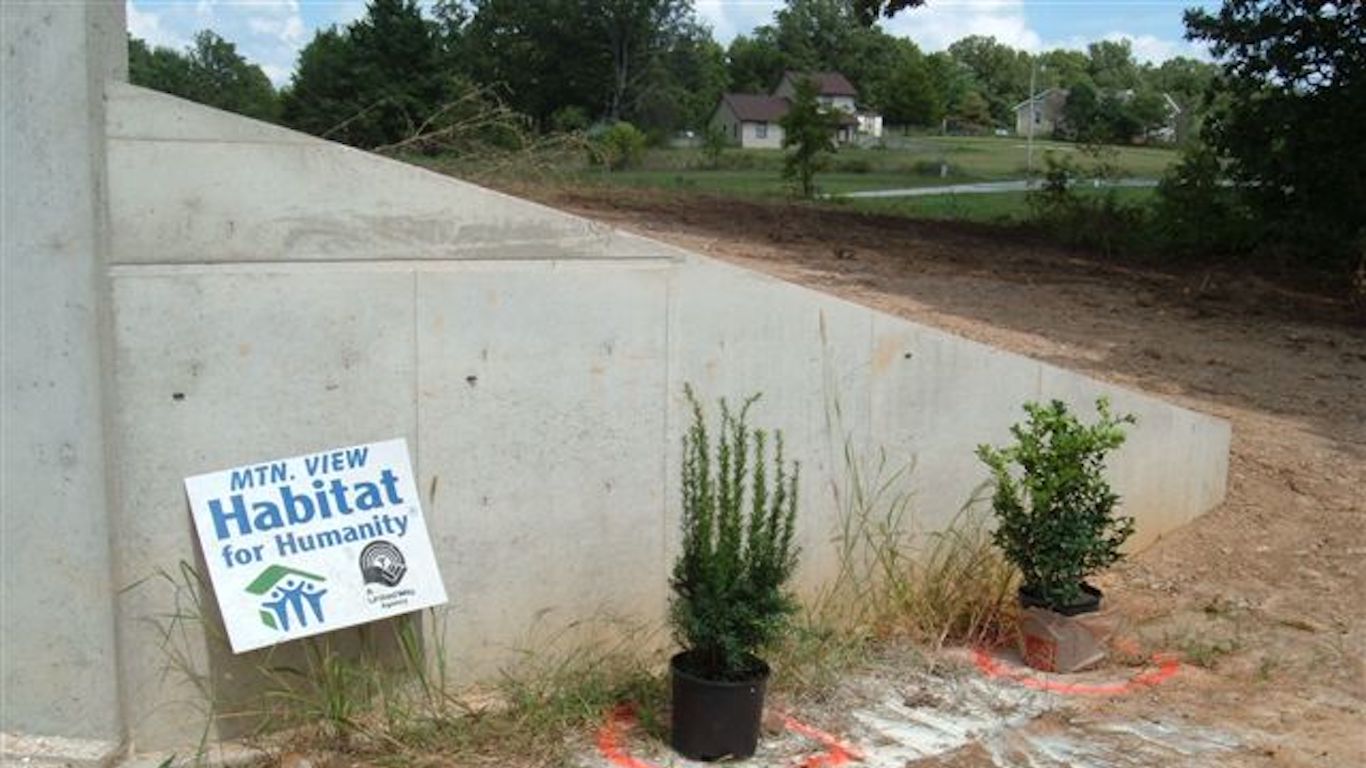
11. Mountain View, Missouri
> Median household income: $23,484
> Median home value: $87,000
> Adults with at least a bachelor’s degree: 8.9%
> Poverty rate: 26.5%
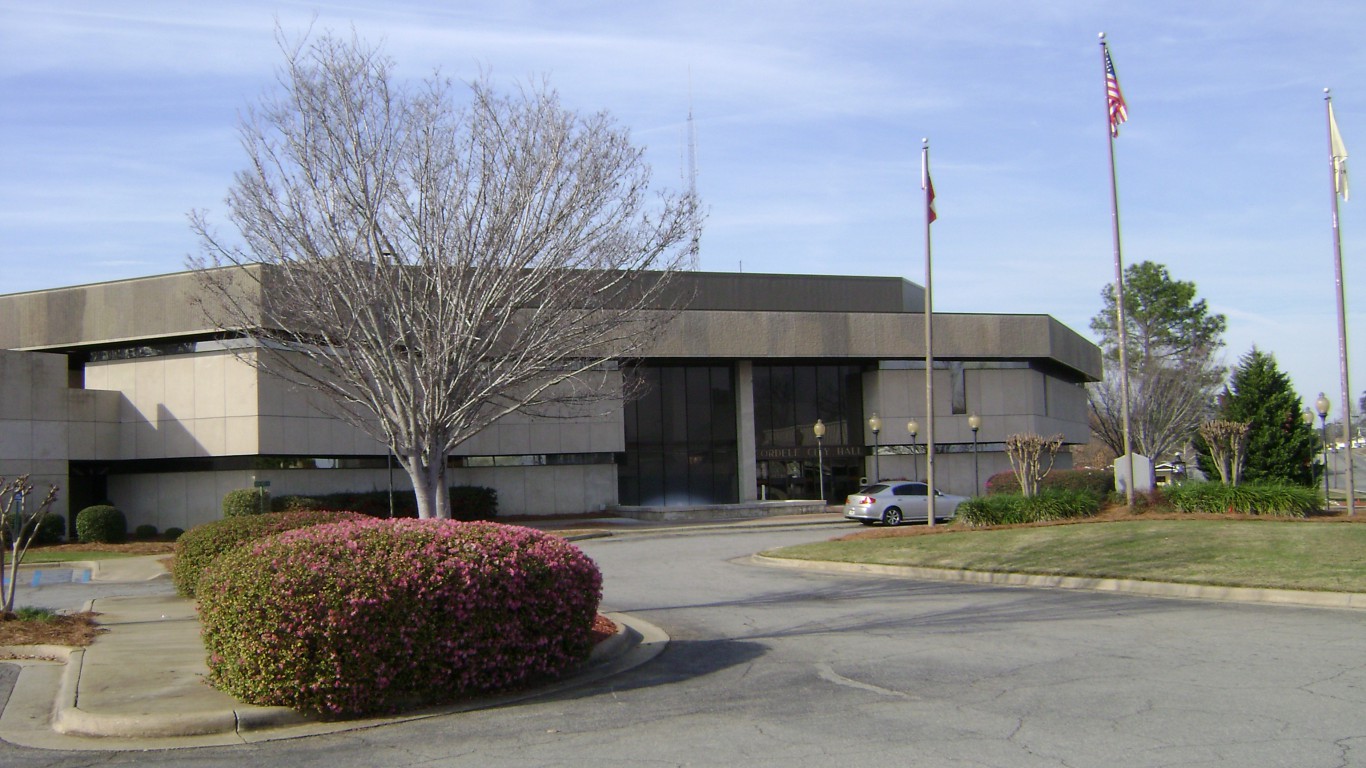
10. Cordele, Georgia
> Median household income: $23,294
> Median home value: $81,800
> Adults with at least a bachelor’s degree: 11.5%
> Poverty rate: 49.6%
[in-text-ad]
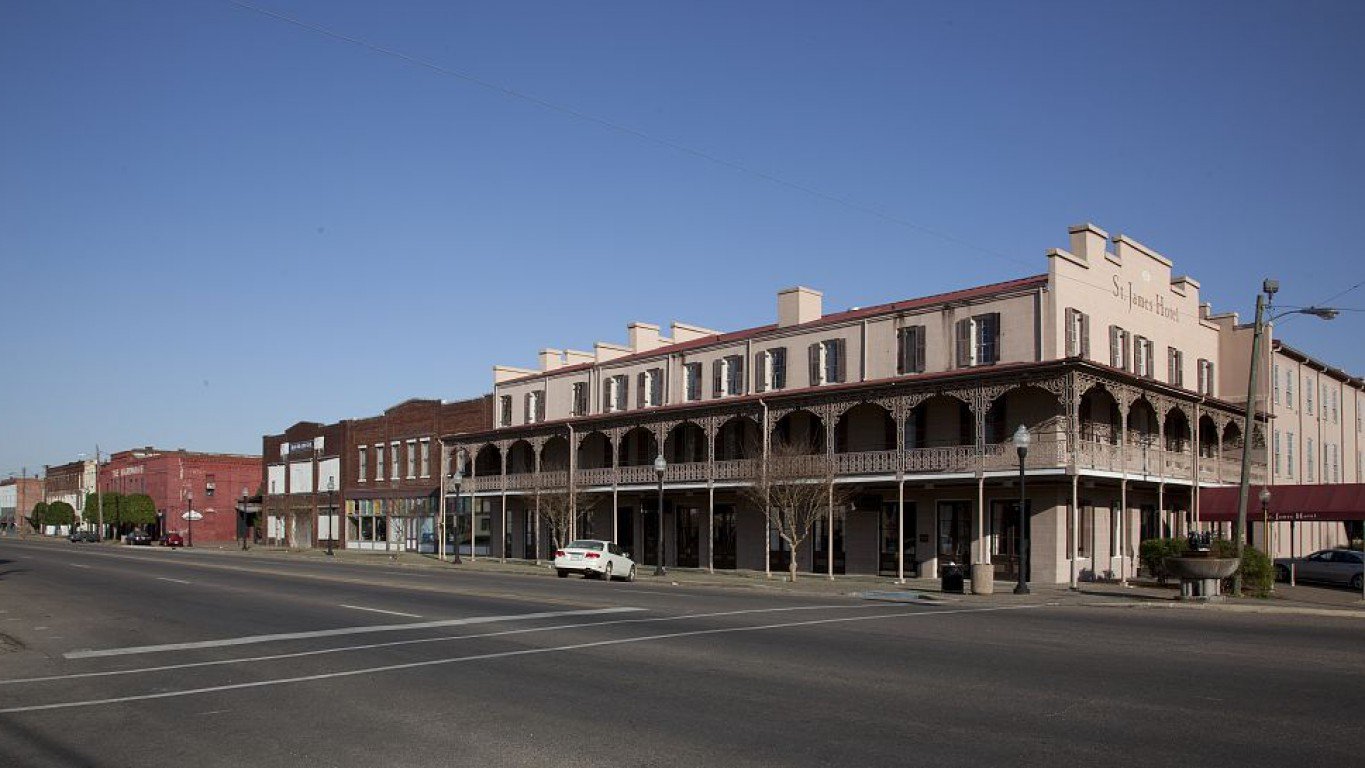
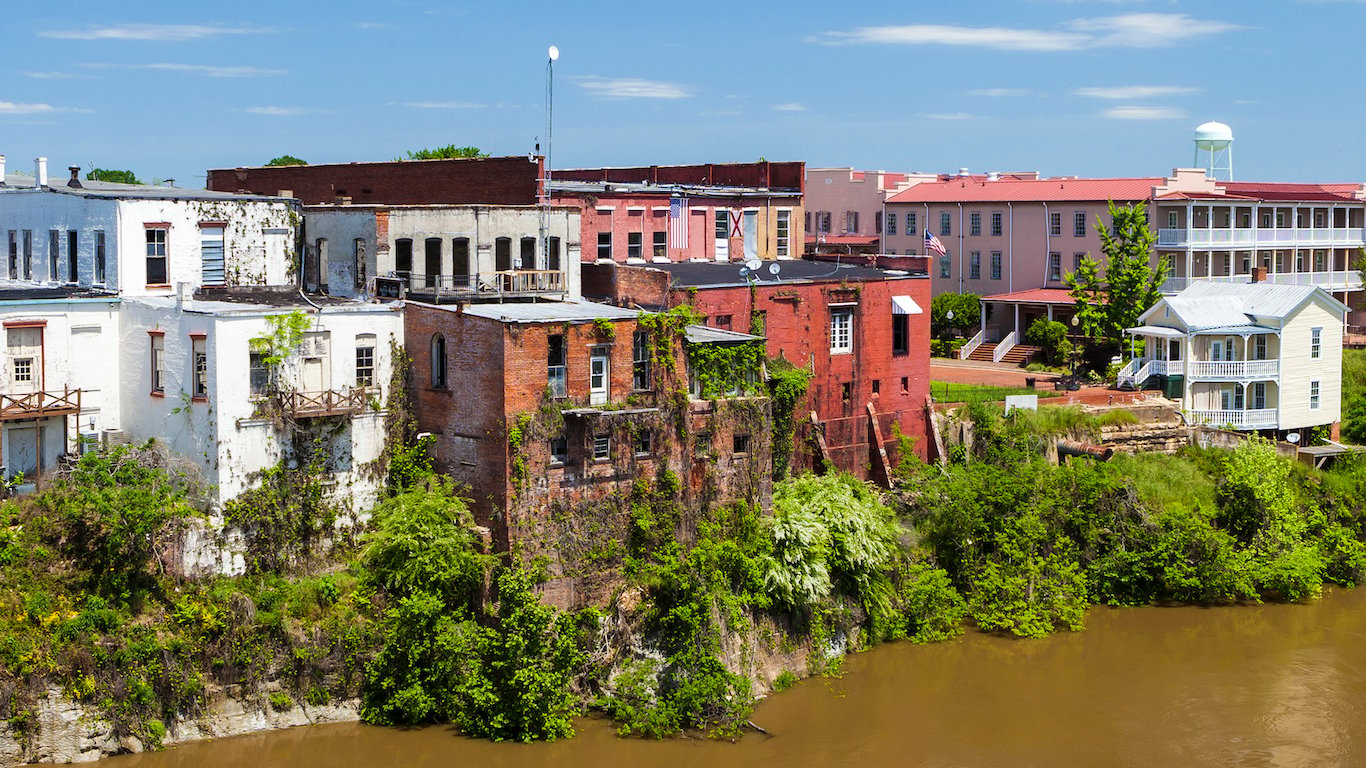
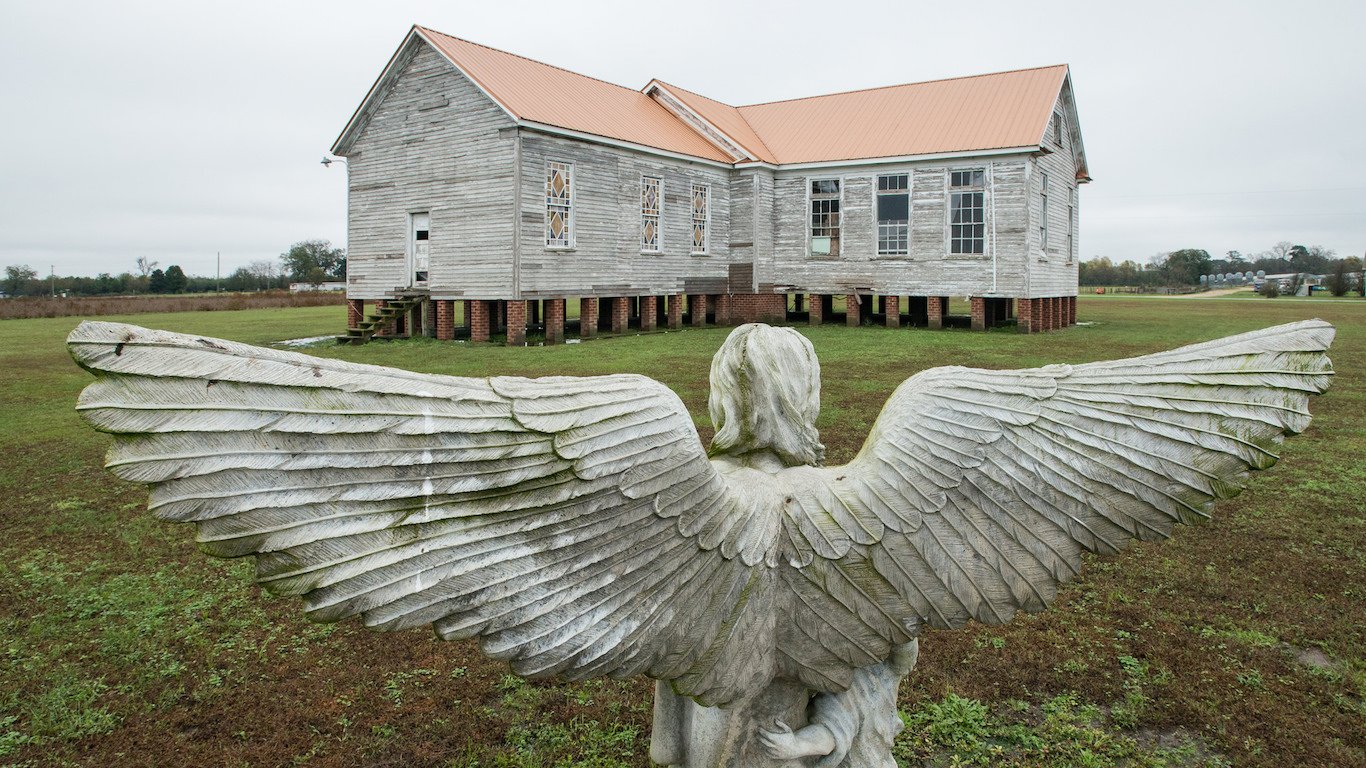
9. Selma, Alabama
> Median household income: $23,283
> Median home value: $90,400
> Adults with at least a bachelor’s degree: 17.0%
> Poverty rate: 41.4%
[recirclink id=444046]
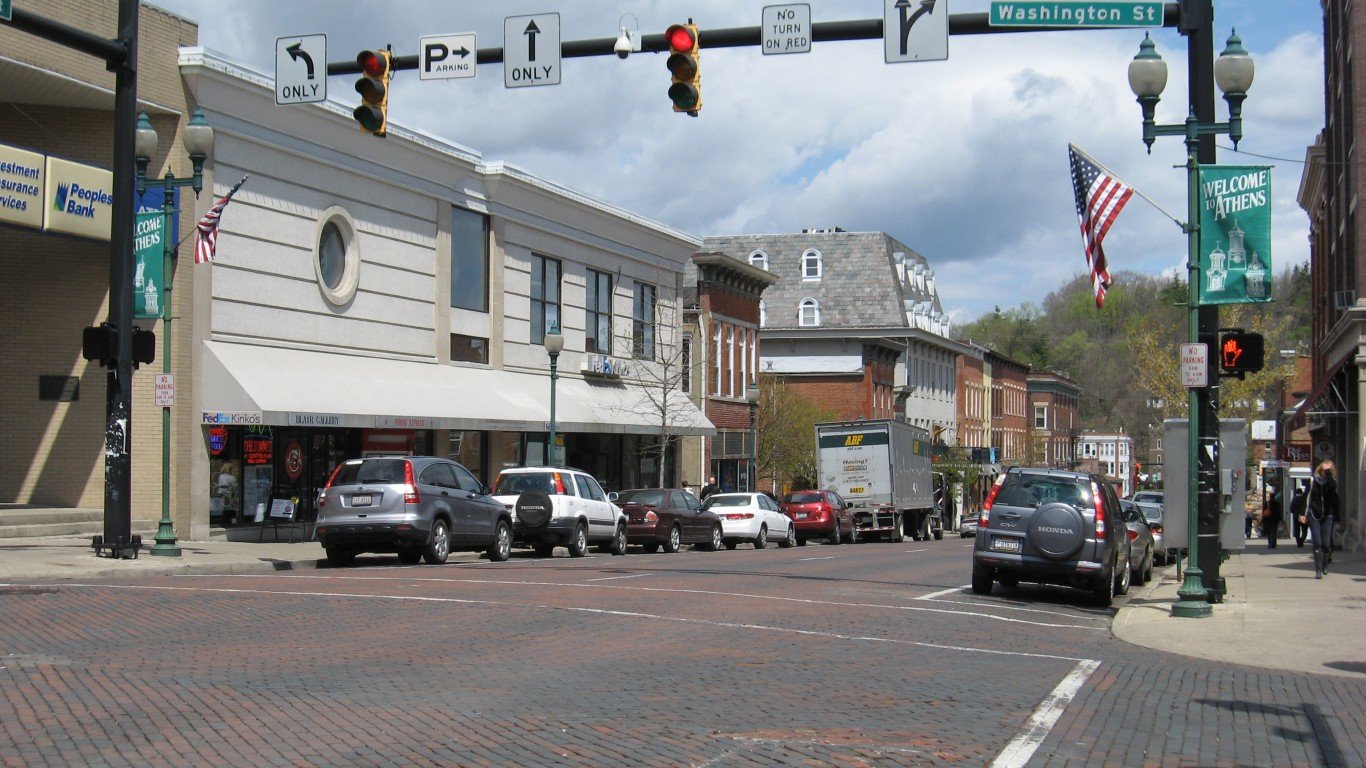
8. Athens, Ohio
> Median household income: $22,204
> Median home value: $164,300
> Adults with at least a bachelor’s degree: 63.2%
> Poverty rate: 54.7%
7. New Square, New York
> Median household income: $21,773
> Median home value: $339,000
> Adults with at least a bachelor’s degree: 3.9%
> Poverty rate: 70.0%
[in-text-ad-2]
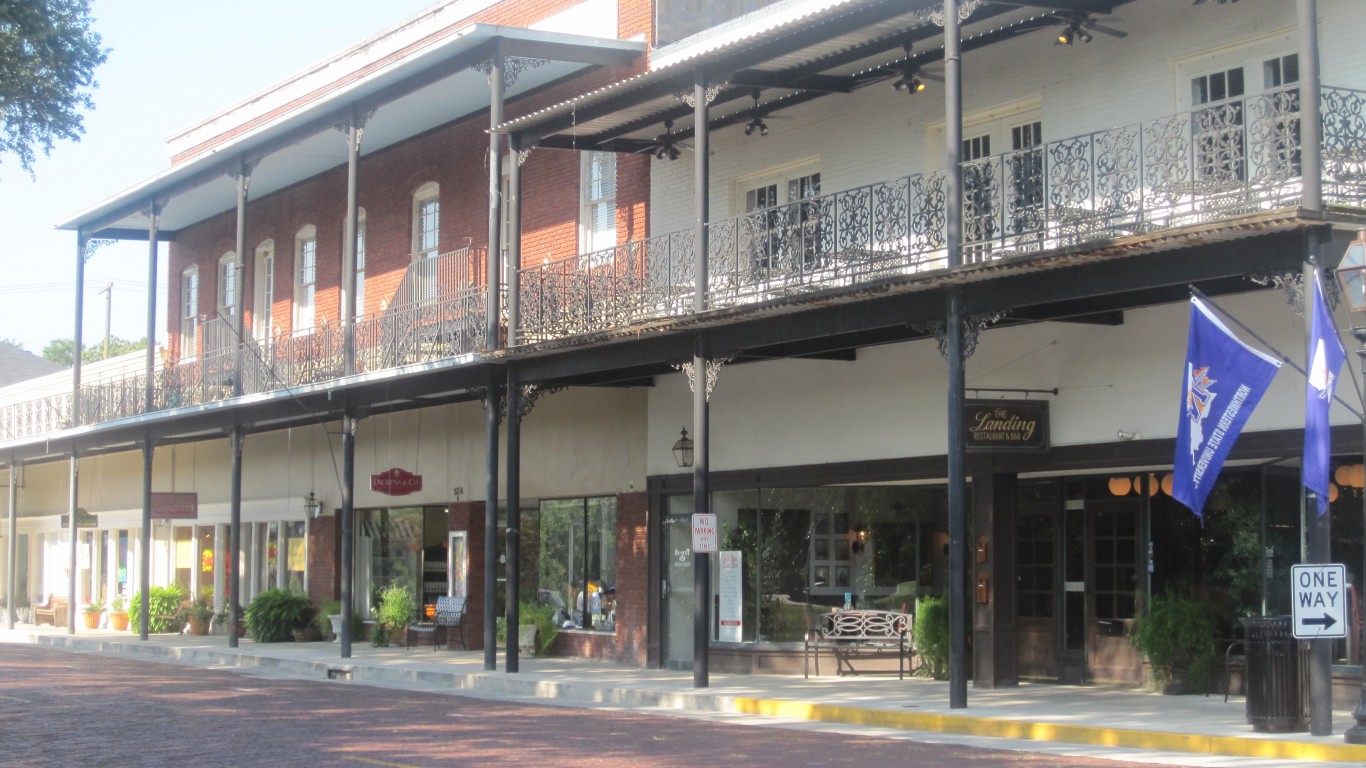
6. Natchitoches, Louisiana
> Median household income: $21,406
> Median home value: $140,900
> Adults with at least a bachelor’s degree: 21.0%
> Poverty rate: 40.4%
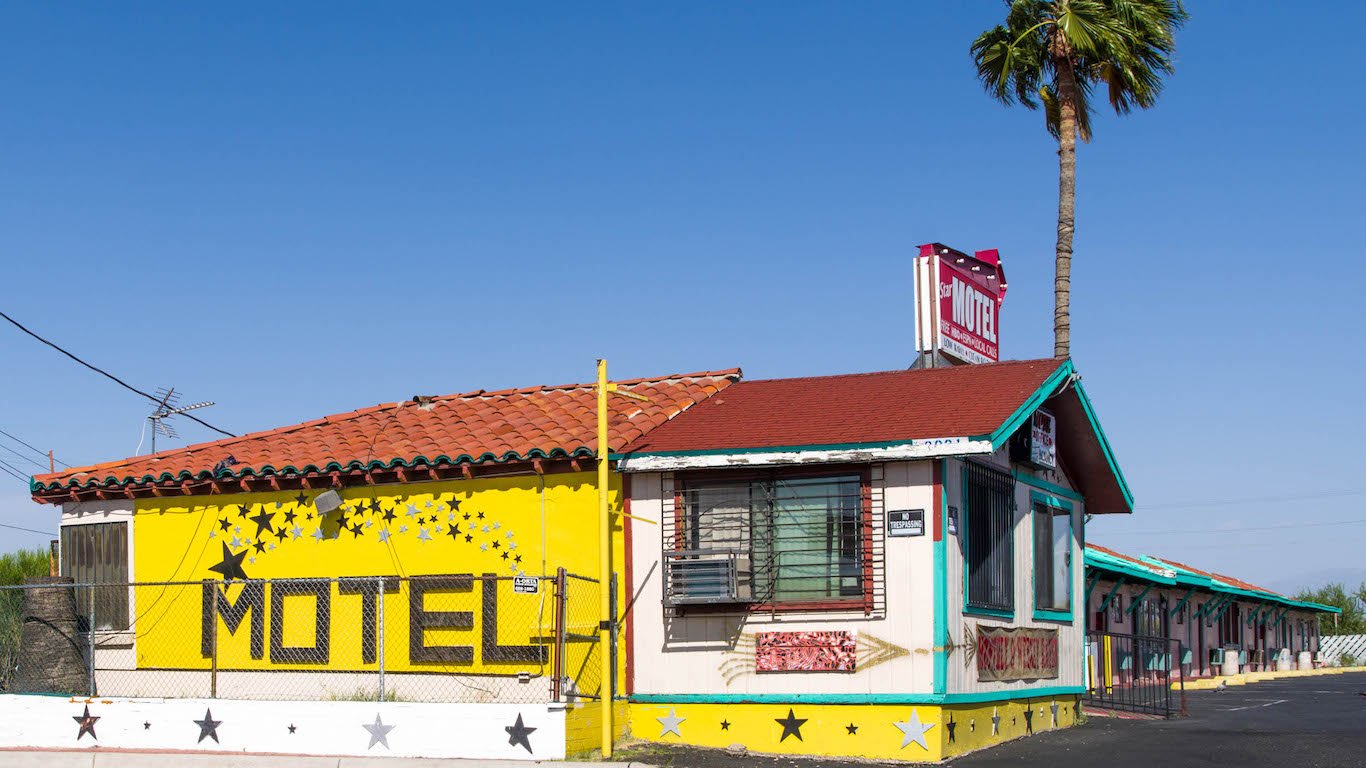
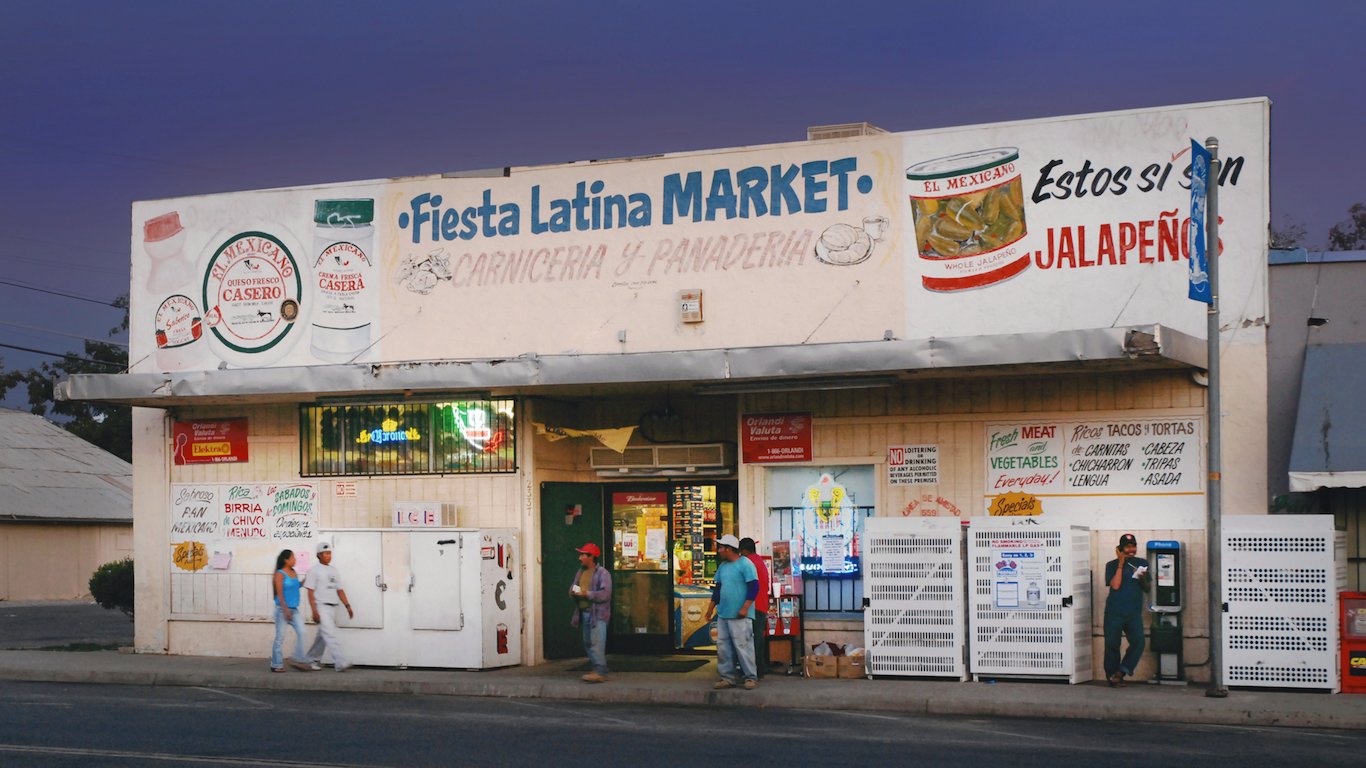
5. South Tucson, Arizona
> Median household income: $20,241
> Median home value: $74,100
> Adults with at least a bachelor’s degree: 2.8%
> Poverty rate: 48.9%
[in-text-ad]
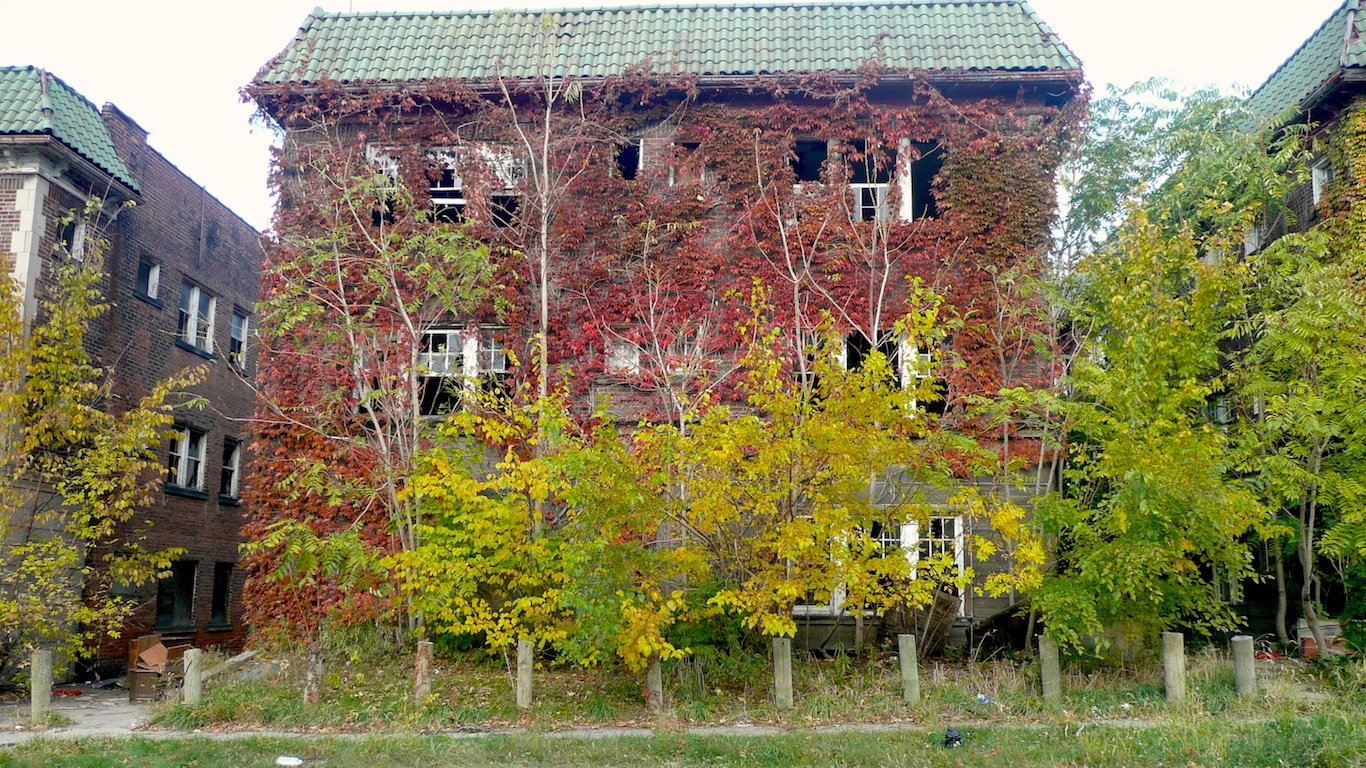
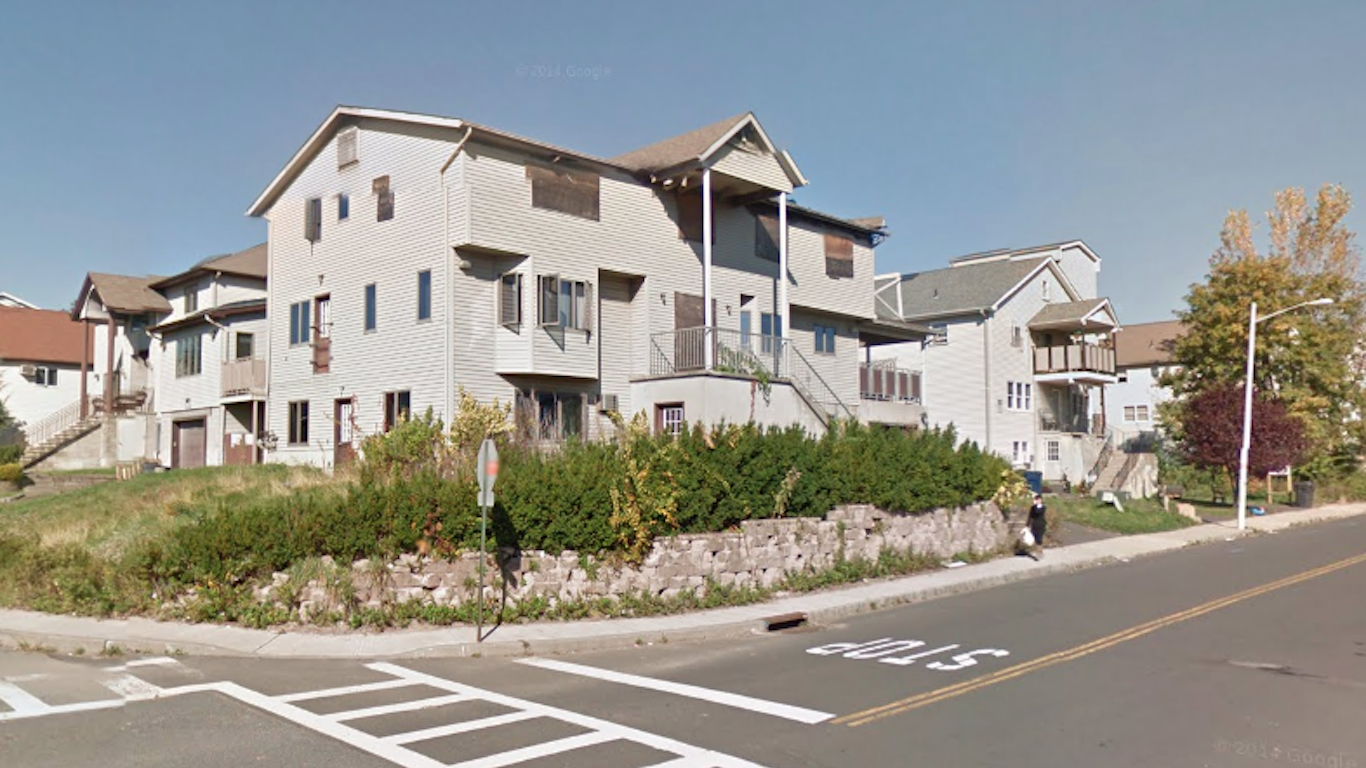
4. East Cleveland, Ohio
> Median household income: $19,953
> Median home value: $58,500
> Adults with at least a bachelor’s degree: 12.4%
> Poverty rate: 41.8%
[recirclink id=443940]
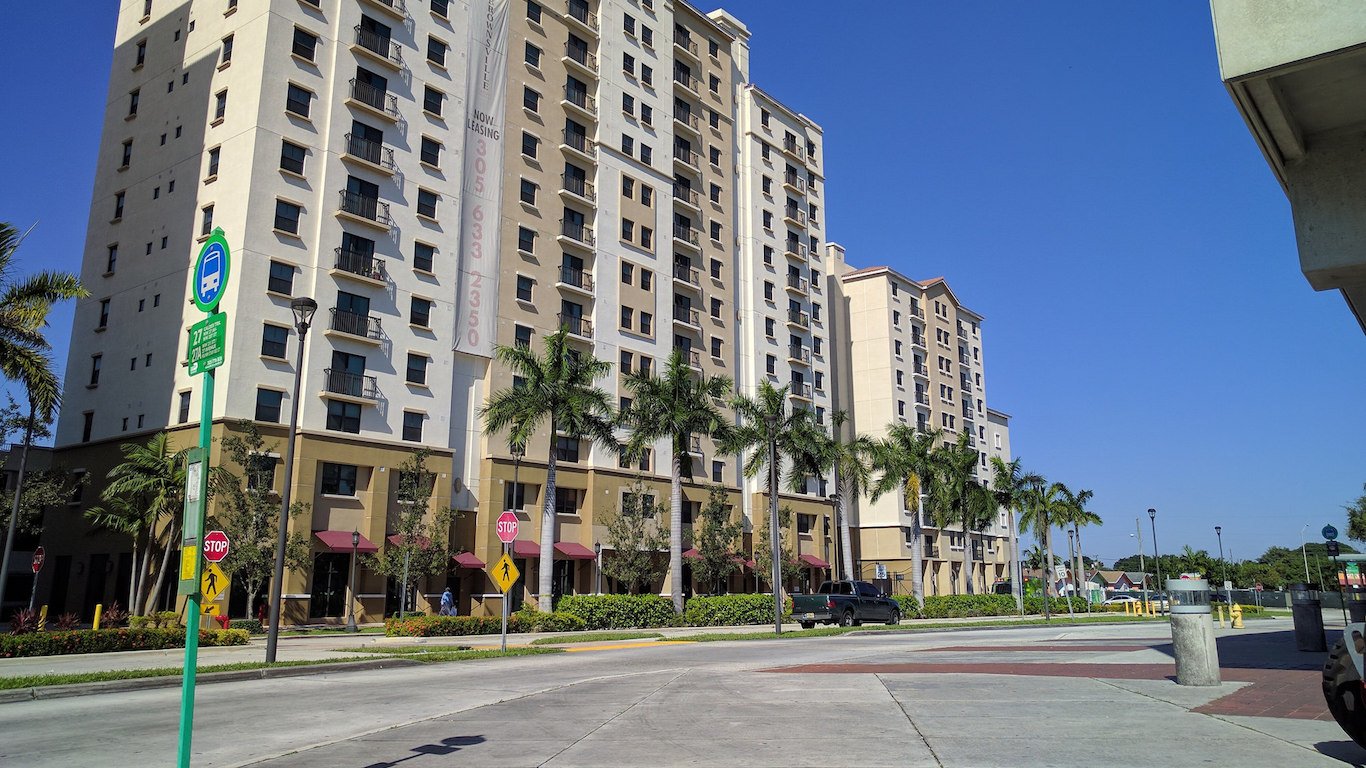
3. Brownsville, Florida
> Median household income: $19,796
> Median home value: $108,400
> Adults with at least a bachelor’s degree: 10.1%
> Poverty rate: 42.4%
2. Ville Platte, Louisiana
> Median household income: $18,679
> Median home value: $84,900
> Adults with at least a bachelor’s degree: 10.2%
> Poverty rate: 38.4%
[in-text-ad-2]
1. Centreville, Illinois
> Median household income: $16,715
> Median home value: $48,400
> Adults with at least a bachelor’s degree: 9.7%
> Poverty rate: 50.1%
Detailed Findings & Methodology
Many of the poorest towns have also experienced substantial economic and population declines over the past several decades as once the nation’s once robust manufacturing and coal mining industries lost out to foreign competition and automation.
East Cleveland, Ohio, for example, rose to prominence as a boomtown during the second industrial revolution, as residents amassed fortunes in iron ore, coal, steel, shipbuilding, and railroads. Over the past seven decades, however, as demand for American manufacturing declined, the city’s economy faltered as well. Since 1950, East Cleveland has experienced a dramatic rise in poverty, a fall in home values, and a loss of more than half its population.
Several of the poorest towns also have large ethnic and immigrant populations. Hamtramck, Michigan, for example, was the first city to have a majority-Muslim population. While Hamtramck’s dependence on the Detroit automobile industry has likely led to an increase in poverty and unemployment in the small town, strict adherence to religious law may also hinder commercial activity. According to a November 2015 Washington Post article, Hamtramck’s mayor has stated that current liquor license restrictions for businesses within 500 feet of a mosque could hurt efforts to develop an entertainment hub downtown.
The villages of Kiryas Joel and New Square, New York, where the typical household earns less than half the national median income, are composed almost entirely of Hasidic Jews. One former resident of New Square has noted that the study of Torah among Orthodox Jews comes at the expense of secular education and limits residents’ ability to earn high incomes outside of the village. Just 6.6% of adults in Kiryas Joel and 3.9% of adults in New Square have a bachelor’s degree, each far smaller shares than the 30.3% national college attainment rate.
Educational attainment is one of the largest determinants of income. Individuals with minimal schooling are less likely to obtain high-paying jobs, and areas with lower educational attainment are less likely to attract advanced industry and commercial activity. In all of the 30 poorest towns — with the exception of Athens, Ohio, where the presence of Ohio University contributes to high college attainment — the share of adults with a bachelor’s degree is less than the national figure.
To determine America’s poorest towns, 24/7 Wall St. reviewed five-year household income data from the U.S. Census Bureau’s American Community Survey in every American town with a population between 1,000 and 25,000. For comparison purposes, boroughs, census designated places, cities, towns, and villages were all considered. We excluded towns for which the margin of error at 90% confidence was greater than 10% of either the median household income or the population. Poverty rates, median home values, and the percentage of adults with at least a bachelor’s degree also came from the ACS and are also five-year estimates through 2016.
Contact [email protected] for any questions or corrections.