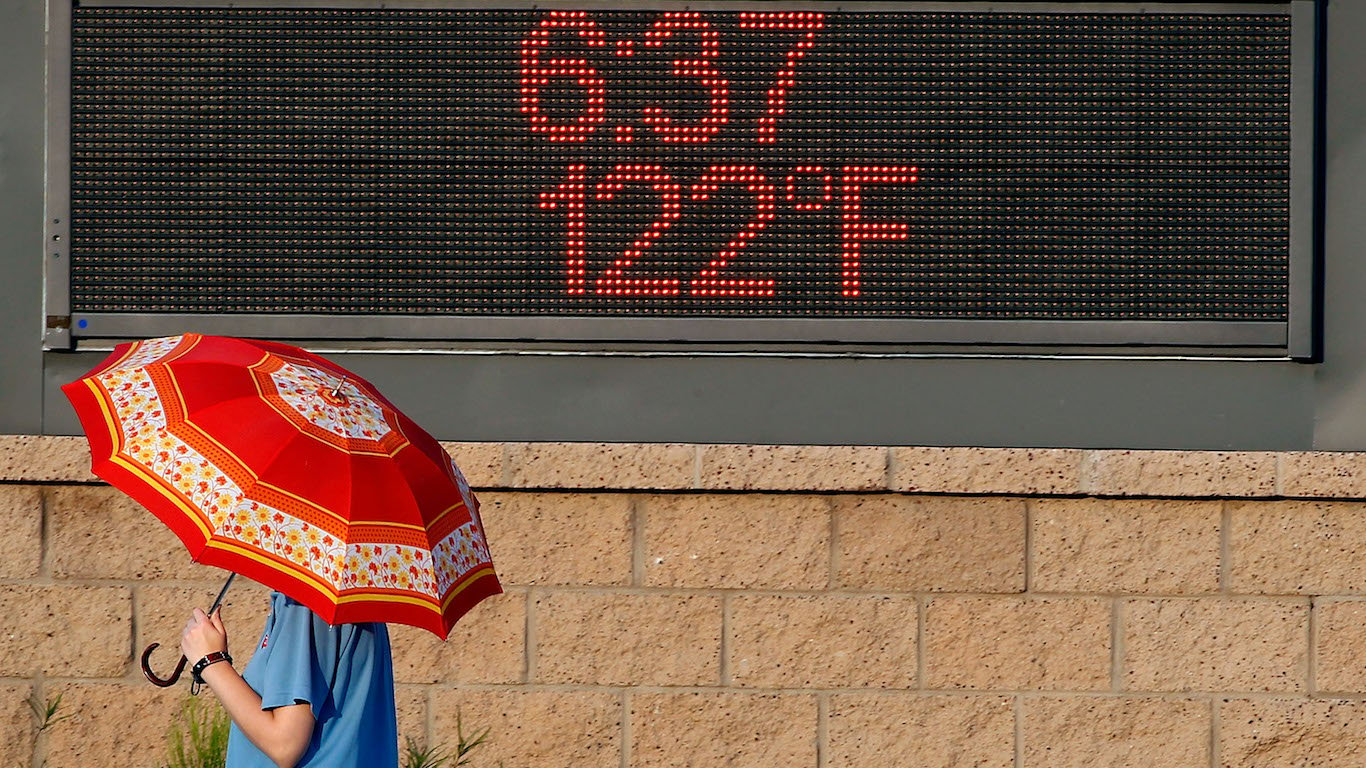
Much of the United States is currently in the midst of a brutal heat wave that could bring record-breaking temperatures to several cities in the Northeast and Midwest. Chicago reached 103 degrees Fahrenheit on Sunday, the hottest Father’s Day in the city since 1995. A handful of other Midwestern cities broke heat records on Sunday, and New York City, Boston, and Washington, D.C. are on track to do the same this week.
Hot weather can exacerbate the formation of ground-level ozone, which can be particularly harmful to children, the elderly, and individuals with respiratory illnesses. Environmental agencies have issued a Code Orange air quality alert in parts of the Northeast and Mid-Atlantic.
While 100-degree weather is a rarity for much of the country, there are a handful of large cities that experience triple-digit temperatures on a regular basis. To identify the 50 hottest cities, 24/7 Wall St. ranked cities based on the average number of 90-plus degree days per year using climate data from the National Oceanic Atmospheric Administration. There are 50 large cities with populations of at least 10,000 where the temperature reaches at least 90 degrees Fahrenheit for more than 67 days in an average year.
Click here to see the 50 hottest cities in America.
Click here to read our detailed findings and methodology.

50. Amarillo, TX
> Days per year with 90°+ temp.: 68
> Highest temp. on record: 111.0° F
> Normal mid-summer high: 91.4° F
> Normal year-round high: 70.9° F
[in-text-ad]

49. Memphis, TN
> Days per year with 90°+ temp.: 68
> Highest temp. on record: 108.0° F
> Normal mid-summer high: 91.6° F
> Normal year-round high: 72.4° F
[recirclink id=444492]

48. Tupelo, MS
> Days per year with 90°+ temp.: 69
> Highest temp. on record: 107.0° F
> Normal mid-summer high: 91.7° F
> Normal year-round high: 73.4° F

47. Savannah, GA
> Days per year with 90°+ temp.: 71
> Highest temp. on record: 105.0° F
> Normal mid-summer high: 92.4° F
> Normal year-round high: 77.4° F
[in-text-ad-2]

46. Oklahoma City, OK
> Days per year with 90°+ temp.: 71
> Highest temp. on record: 113.0° F
> Normal mid-summer high: 93.9° F
> Normal year-round high: 72.2° F

45. Sacramento, CA
> Days per year with 90°+ temp.: 73
> Highest temp. on record: 115.0° F
> Normal mid-summer high: 92.1° F
> Normal year-round high: 73.6° F
[in-text-ad]

44. Tulsa, OK
> Days per year with 90°+ temp.: 73
> Highest temp. on record: 113.0° F
> Normal mid-summer high: 93.5° F
> Normal year-round high: 71.7° F
[recirclink id=444468]

43. New Orleans, LA
> Days per year with 90°+ temp.: 74
> Highest temp. on record: 102.0° F
> Normal mid-summer high: 91.2° F
> Normal year-round high: 78.2° F

42. West Palm Beach, FL
> Days per year with 90°+ temp.: 75
> Highest temp. on record: 101.0° F
> Normal mid-summer high: 90.1° F
> Normal year-round high: 82.9° F
[in-text-ad-2]

41. Little Rock, AR
> Days per year with 90°+ temp.: 75
> Highest temp. on record: 114.0° F
> Normal mid-summer high: 92.6° F
> Normal year-round high: 72.8° F

40. Mobile, AL
> Days per year with 90°+ temp.: 76
> Highest temp. on record: 105.0° F
> Normal mid-summer high: 90.5° F
> Normal year-round high: 76.7° F
[in-text-ad]

39. Columbus, GA
> Days per year with 90°+ temp.: 77
> Highest temp. on record: 106.0° F
> Normal mid-summer high: 92.2° F
> Normal year-round high: 76.2° F
[recirclink id=444391]

38. Columbia, SC
> Days per year with 90°+ temp.: 77
> Highest temp. on record: 109.0° F
> Normal mid-summer high: 92.7° F
> Normal year-round high: 75.4° F

37. Fort Smith, AR
> Days per year with 90°+ temp.: 77
> Highest temp. on record: 115.0° F
> Normal mid-summer high: 93.4° F
> Normal year-round high: 72.8° F
[in-text-ad-2]

36. Lake Charles, LA
> Days per year with 90°+ temp.: 79
> Highest temp. on record: 107.0° F
> Normal mid-summer high: 91.9° F
> Normal year-round high: 78.0° F

35. Jacksonville, FL
> Days per year with 90°+ temp.: 82
> Highest temp. on record: 105.0° F
> Normal mid-summer high: 92.0° F
> Normal year-round high: 79.3° F
[in-text-ad]

34. Stockton, CA
> Days per year with 90°+ temp.: 82
> Highest temp. on record: 115.0° F
> Normal mid-summer high: 93.4° F
> Normal year-round high: 74.3° F
[recirclink id=444326]

33. Jackson, MS
> Days per year with 90°+ temp.: 83
> Highest temp. on record: 107.0° F
> Normal mid-summer high: 91.5° F
> Normal year-round high: 75.5° F

32. Gainesville, FL
> Days per year with 90°+ temp.: 84
> Highest temp. on record: 103.0° F
> Normal mid-summer high: 90.9° F
> Normal year-round high: 80.0° F
[in-text-ad-2]

31. Meridian, MS
> Days per year with 90°+ temp.: 84
> Highest temp. on record: 107.0° F
> Normal mid-summer high: 91.8° F
> Normal year-round high: 75.8° F

30. Montgomery, AL
> Days per year with 90°+ temp.: 84
> Highest temp. on record: 106.0° F
> Normal mid-summer high: 92.1° F
> Normal year-round high: 76.5° F
[in-text-ad]
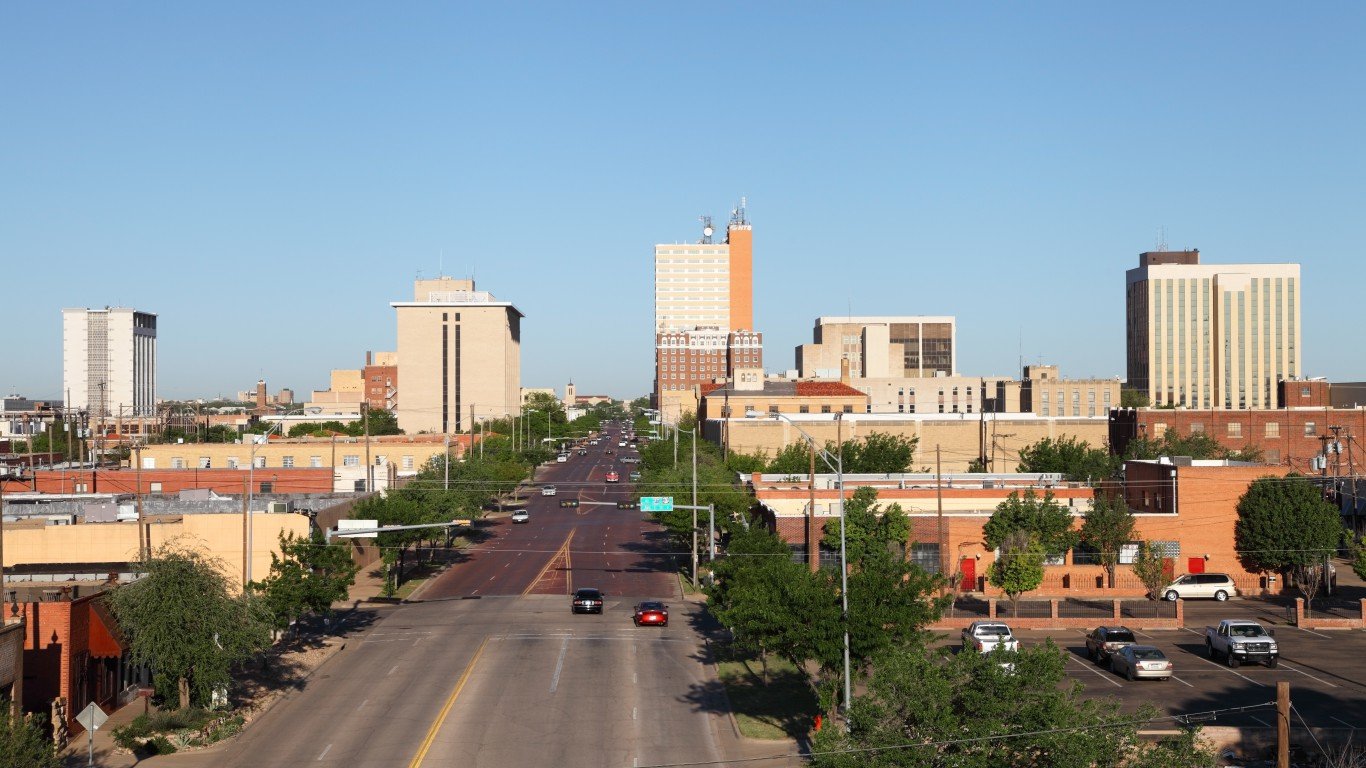
29. Lubbock, TX
> Days per year with 90°+ temp.: 84
> Highest temp. on record: 114.0° F
> Normal mid-summer high: 92.8° F
> Normal year-round high: 74.3° F
[recirclink id=444046]

28. Tampa, FL
> Days per year with 90°+ temp.: 86
> Highest temp. on record: 99.0° F
> Normal mid-summer high: 90.2° F
> Normal year-round high: 81.7° F

27. Port Arthur, TX
> Days per year with 90°+ temp.: 86
> Highest temp. on record: 108.0° F
> Normal mid-summer high: 92.2° F
> Normal year-round high: 78.3° F
[in-text-ad-2]

26. Baton Rouge, LA
> Days per year with 90°+ temp.: 89
> Highest temp. on record: 105.0° F
> Normal mid-summer high: 92.5° F
> Normal year-round high: 78.9° F

25. Tallahassee, FL
> Days per year with 90°+ temp.: 91
> Highest temp. on record: 105.0° F
> Normal mid-summer high: 92.1° F
> Normal year-round high: 79.5° F
[in-text-ad]

24. Shreveport, LA
> Days per year with 90°+ temp.: 92
> Highest temp. on record: 109.0° F
> Normal mid-summer high: 93.4° F
> Normal year-round high: 75.8° F
[recirclink id=443940]

23. Orlando, FL
> Days per year with 90°+ temp.: 97
> Highest temp. on record: 101.0° F
> Normal mid-summer high: 91.8° F
> Normal year-round high: 82.4° F
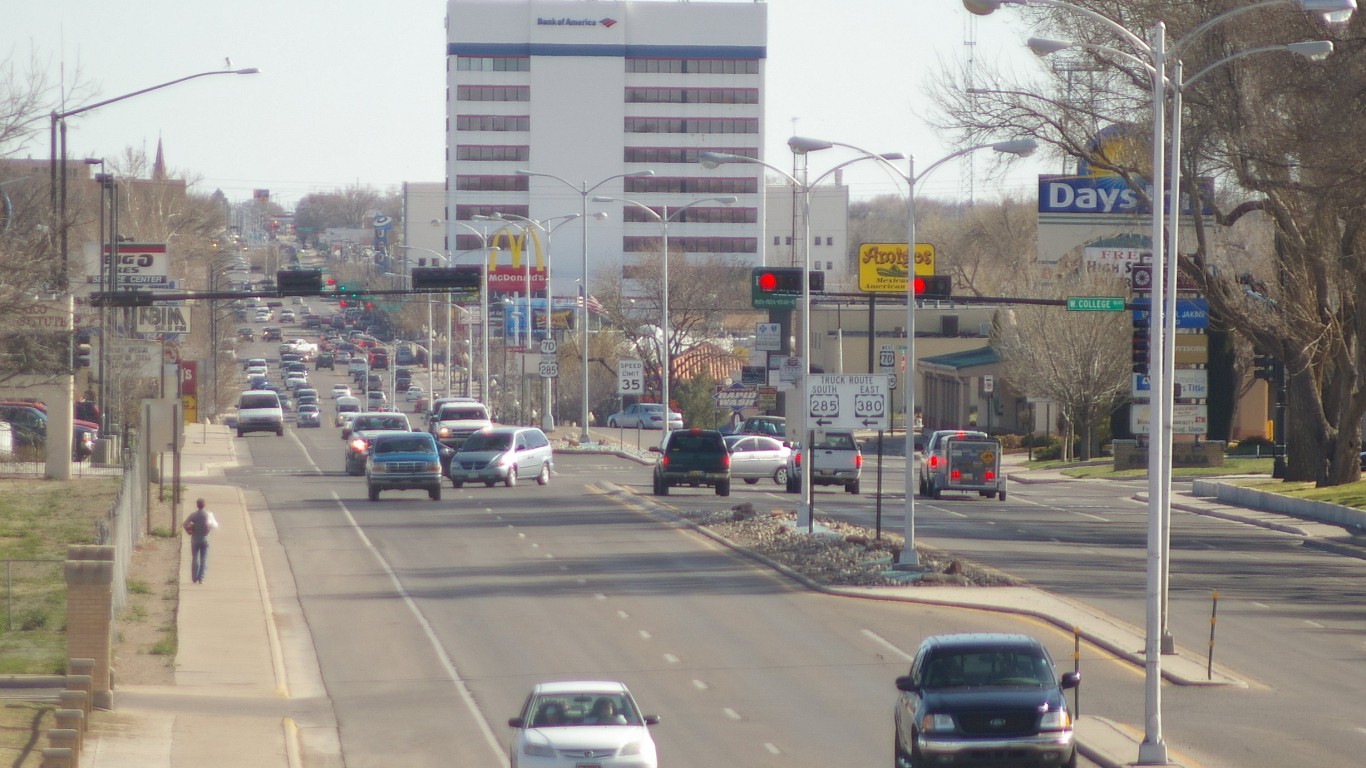
22. Roswell, NM
> Days per year with 90°+ temp.: 98
> Highest temp. on record: 114.0° F
> Normal mid-summer high: 93.7° F
> Normal year-round high: 75.4° F
[in-text-ad-2]

21. Fort Myers, FL
> Days per year with 90°+ temp.: 99
> Highest temp. on record: 103.0° F
> Normal mid-summer high: 91.9° F
> Normal year-round high: 84.7° F

20. Abilene, TX
> Days per year with 90°+ temp.: 102
> Highest temp. on record: 110.0° F
> Normal mid-summer high: 94.2° F
> Normal year-round high: 76.2° F
[in-text-ad]

19. Dallas, TX
> Days per year with 90°+ temp.: 103
> Highest temp. on record: 112.0° F
> Normal mid-summer high: 0.0° F
> Normal year-round high: 0.0° F
[recirclink id=443564]

18. Houston, TX
> Days per year with 90°+ temp.: 103
> Highest temp. on record: 109.0° F
> Normal mid-summer high: 92.3° F
> Normal year-round high: 78.5° F

17. Redding, CA
> Days per year with 90°+ temp.: 104
> Highest temp. on record: 118.0° F
> Normal mid-summer high: 94.9° F
> Normal year-round high: 72.1° F
[in-text-ad-2]

16. Midland-Odessa, TX
> Days per year with 90°+ temp.: 106
> Highest temp. on record: 116.0° F
> Normal mid-summer high: 94.6° F
> Normal year-round high: 77.3° F

15. Wichita Falls, TX
> Days per year with 90°+ temp.: 107
> Highest temp. on record: 117.0° F
> Normal mid-summer high: 96.9° F
> Normal year-round high: 75.7° F
[in-text-ad]

14. El Paso, TX
> Days per year with 90°+ temp.: 108
> Highest temp. on record: 114.0° F
> Normal mid-summer high: 95.5° F
> Normal year-round high: 77.4° F
[recirclink id=443882]

13. Fresno, CA
> Days per year with 90°+ temp.: 108
> Highest temp. on record: 113.0° F
> Normal mid-summer high: 98.4° F
> Normal year-round high: 76.7° F

12. Victoria, TX
> Days per year with 90°+ temp.: 110
> Highest temp. on record: 111.0° F
> Normal mid-summer high: 95.0° F
> Normal year-round high: 80.7° F
[in-text-ad-2]

11. Bakersfield, CA
> Days per year with 90°+ temp.: 110
> Highest temp. on record: 115.0° F
> Normal mid-summer high: 97.1° F
> Normal year-round high: 76.8° F

10. Waco, TX
> Days per year with 90°+ temp.: 111
> Highest temp. on record: 112.0° F
> Normal mid-summer high: 96.8° F
> Normal year-round high: 77.8° F
[in-text-ad]

9. Corpus Christi, TX
> Days per year with 90°+ temp.: 112
> Highest temp. on record: 109.0° F
> Normal mid-summer high: 94.4° F
> Normal year-round high: 81.6° F
[recirclink id=443620]

8. Austin, TX
> Days per year with 90°+ temp.: 114
> Highest temp. on record: 112.0° F
> Normal mid-summer high: 0.0° F
> Normal year-round high: 0.0° F

7. San Angelo, TX
> Days per year with 90°+ temp.: 114
> Highest temp. on record: 111.0° F
> Normal mid-summer high: 95.1° F
> Normal year-round high: 78.2° F
[in-text-ad-2]

6. San Antonio, TX
> Days per year with 90°+ temp.: 116
> Highest temp. on record: 111.0° F
> Normal mid-summer high: 97.5° F
> Normal year-round high: 80.7° F

5. Brownsville, TX
> Days per year with 90°+ temp.: 124
> Highest temp. on record: 106.0° F
> Normal mid-summer high: 94.4° F
> Normal year-round high: 83.5° F
[in-text-ad]

4. Del Rio, TX
> Days per year with 90°+ temp.: 134
> Highest temp. on record: 112.0° F
> Normal mid-summer high: 97.1° F
> Normal year-round high: 81.6° F
[recirclink id=443575]

3. Las Vegas, NV
> Days per year with 90°+ temp.: 135
> Highest temp. on record: 117.0° F
> Normal mid-summer high: 104.1° F
> Normal year-round high: 79.6° F

2. Tucson, AZ
> Days per year with 90°+ temp.: 146
> Highest temp. on record: 117.0° F
> Normal mid-summer high: 100.2° F
> Normal year-round high: 82.9° F
[in-text-ad-2]

1. Phoenix, AZ
> Days per year with 90°+ temp.: 169
> Highest temp. on record: 122.0° F
> Normal mid-summer high: 106.1° F
> Normal year-round high: 86.6° F
Detailed Findings
Of the 50 hottest cities, 17 are located in Texas and seven are in Florida. A majority of the cities on this list are classified as having a humid subtropical climate via the Köppen Climate Classification System. Several are also located in California and Arizona and are classified as having a hot desert or hot semi-arid climate.
Many of the hottest cities in America are also relatively dense and populous urban areas. In what is known as the “heat island effect,” the built changes to a landscape — buildings, roads, and other infrastructure — can reduce green space and interrupt vegetation, ultimately causing urban areas to become hotter than their rural surroundings. The temperature difference between a city with over one million residents and the rural area surrounding it can be between two and five degrees on a year-round basis and up to 22 degrees on a nightly basis. Large cities with populations of at least one million on this list include Phoenix, Arizona, and San Antonio, Houston, and Dallas in Texas.
Urban areas are also the most common setting for heat-related deaths. While the incidence of heat-related death in the United States has fallen over the last several years, it is still higher than it was roughly two decades ago. In 2016, 94 Americans died from extreme heat-related causes. Nevada accounted for more than half of all heat-related deaths that year.
Record-breaking temperatures are likely becoming more common due to climate change. Over the last century, the global average temperature has risen fairly consistently from year to year. According to climate data from NASA, 2016 was the hottest year on record, followed by 2017, 2015, and 2014.
Methodology
To determine the hottest cities in America, 24/7 Wall St. ranked 197 cities based on the average number of 90-plus degree days per year using climate data from the National Oceanic Atmospheric Administration’s 2015 Comparative Climatic Data report. Only cities with populations of at least 10,000 were considered.
Averages for each city were calculated over varying periods, depending on when the city began keeping records.
The normal mid-summer high temperature is the 30-year average daily maximum temperature from the month with the highest average daily temperature for each city using data recorded between 1981 and 2010. The normal year-round high temperature is the 30-year average daily maximum temperature from 1981 to 2010. Highest temperature on record refers to the highest temperature recorded at each city’s weather station and may differ from citywide or statewide figures.
Contact [email protected] for any questions or corrections.